
Mathematicians Discover ‘Soft Cell’ Shapes Behind The Natural World

The mathematical study of how repeating tiles fit together usually involves pointed shapes like triangles or squares, but these aren’t normally found in the natural world.

The chambers of a nautilus shell are an example of a soft cell in nature

A new class of mathematical shapes called soft cells can be used to describe how a remarkable variety of patterns in living organisms – such as muscle cells and nautilus shells – form and grow.

Mathematicians have long studied how tiles fit together and cover surfaces, but they have largely focused on simple shapes that fit together without gaps, such as squares and triangles, because these are easier to work with.

It is rare, however, for nature to use perfectly straight lines and sharp points. Some natural objects are similar enough to straight-edged tiles, known as polyhedrons, that they can be described by polyhedral models, such as a collection of bubbles in a foam or the cracked surface of Mars. But there are some curved shapes, such as three-dimensional polygons found in the epithelial cells that tile the lining of blood vessels and organs, that are harder to describe.

Now, Gábor Domokos at the Budapest University of Technology, Hungary, and his colleagues have discovered a class of shapes that describe tilings with curved edges, which they call soft cells. The key to these shapes is that they contain as few sharp corners as possible, while also fitting together as snugly as they can.

“These shapes emerge in art, but also in biology,” says Domokos. “If you look at sections of muscle tissue, you’ll see the cells having just two sharp corners, which is one less than the triangle – it is a very special kind of tiling.”

In two dimensions, soft cells have just two sharp points connected by curved edges and can take on an infinite number of different forms. But in three dimensions, these shapes have no sharp points, or corners, at all. It isn’t obvious how many of these 3D soft cells, which Domokos and his team call z-cells, there might be or how to easily make them, he says.

After defining soft cells mathematically, Domokos and his team looked for examples in nature and discovered they were widespread. “We found that architects have found these kinds of shapes intuitively when they wanted to avoid corners,” says Domokos. They also found z-cells were common in biological processes that grow from the tip of an object.

One of the clearest examples of z-cells was in seashells made from multiple chambers, such as the nautilus shell, which is an object of fascination for mathematicians because its structure follows a logarithmic pattern.

Domokos and his team noticed that the two-dimensional slices of each of the shell’s chambers looked like a soft cell, so they examined nautilus shells with a CT scanner to measure the chambers in three dimensions. “We saw no corners,” says Domokos, which suggested that the chambers were like the z-cells they had described mathematically.

“They’ve come up with a language for describing cellular materials that might be more physically realistic than the strict polyhedral model that mathematicians have been playing with for millennia,” says Chaim Goodman-Strauss at the University of Arkansas. These models could improve our understanding of how the geometry of biological systems, like in soft tissues, affects their material properties, says Goodman-Strauss. “The way that geometry influences the mechanical properties of tissue is really very poorly understood.”

For more such insights, log into www.international-maths-challenge.com.

*Credit for article given to Alex Wilkins*


Why Science Relies Too Much On Mathematics

Mathematics is at the heart of modern science but we shouldn’t forget other ways to reason, says author and researcher Roland Ennos.

“Science is written in the language of mathematics,” proclaimed Galileo in 1623. And over the past few centuries science has become ever more mathematical. Nowadays, mathematics seems to hold total hegemony, particularly in the fields of quantum physics and relativity – the teaching of modern physics seems to involve deriving an endless series of equations.

But though it is an important tool, mathematical analysis is not the only way of approaching scientific enquiry. Scientists also need to develop concepts on which to build the mathematics and carry out experiments to test and demonstrate their ideas. And they also need to translate the equations back into physical concepts and verbal explanations to make them comprehensible. These other aspects have long been undervalued – in both the teaching and practice of physics – and this has damaged and is continuing to damage our understanding of the world around us.

Nowhere is this better exemplified than in the science of rotation and spin, which might at first glance appear to be a shining example of the triumph of mathematics. In his 1687 magnum opus Principia, Isaac Newton laid out the mathematical workings of our solar system: he showed how the laws of motion and gravity explain how the planets orbit around the sun, and how the spin of the earth causes it to bulge, drives the tides and makes its tilted axis slowly wobble. Over the next hundred years, Newton’s analysis was extended and translated into modern mathematical language. All the problems of cosmology appeared to have been solved, the first of many occasions when scientists have mistakenly thought they had uncovered all the secrets of the universe.

Yet Newton’s triumph was only made possible by his more down-to-earth contemporary Robert Hooke. It was Hooke who made the conceptual leap that an object moving in a circle is travelling at a constant speed but is also accelerating at right angles towards the centre of the circle. He also went on to show experimentally how a universal gravity could provide the force that causes the planets to orbit around the sun and the moon around Earth. He hung a large ball, representing Earth, from the ceiling and a small ball, representing the moon, from the large ball, before pulling them away from vertical and setting them moving. The tension in the ropes, representing gravity, provided the inward force that kept them travelling around in a circle.

Unfortunately, Newton, who came to dominate world science, had little time for such conceptual and experimental approaches, insisting that equations were the only way to describe physical reality. His influence impeded further conceptual advances in mechanics and consequently progress in cosmology. For instance, it delayed our understanding of how the solar system was created.

The accepted model – the nebular hypothesis – was put forward in the 18th century by such luminaries as the philosopher Immanuel Kant and the mathematician Pierre-Simon Laplace. The hypothesis proposed that the solar system formed from a spinning ball of dust and gas. Gravity flattened the ball into a disc before the attraction between the particles pulled them together into planets and moons, all orbiting in the same plane and in the same direction.

All seemed well until the 1850s when engineers such as William Rankine finally developed a new mechanical concept – the conservation of angular momentum – 150 years after the conservation of linear momentum had been accepted. This new concept revealed a potential flaw in the nebular hypothesis that had remained hidden in Newton’s equations. To have shrunk to its size and to spin so slowly, the sun must have lost almost all its angular momentum, something that seemed to break this new law of nature.

It was only 40 years ago that a convincing explanation was proposed about how the sun lost its angular momentum. The charged particles shot out by the sun in the solar wind are channelled within magnetic fields before being flung out slowing the spin of the material that remained and allowing gravity to draw it inwards. It was only two years ago that this explanation was finally verified by the Parker Solar Probe, which found that the solar particles were channelled up to 32 million kilometres outwards before being released. And only in October 2023 did the James Webb Space Telescope reveal the same process occurring in the newly forming solar system of the star HH212.

The overreliance on mathematics also delayed our understanding of how the spin of Earth makes it habitable. By the end of the 18th century, Laplace had derived equations describing how Earth’s spin deflects bodies of water moving over its surface. However, even he failed to observe that it would also affect solid objects and gases, so his work was ignored by the early meteorologists.

This only changed in 1851, when the French physicist Jean Foucault produced a free-hanging pendulum that demonstrated Laplace’s forces in action. The forces diverted the bob to the right during each sweep so that its plane of swing gradually rotated, like a Spirograph drawing. Not only did this prove the spin of Earth to a sceptical public, but it showed schoolteacher William Ferrel that Laplace’s forces would also deflect air masses moving around Earth’s surface. This would explain how global air currents are deflected east and west to form the three convection cells that cover each hemisphere and create the world’s climate zones, and how they divert winds into rotating weather systems, creating depressions, hurricanes and anticyclones. Modern meteorology was born.

In 1835, the French engineer Gaspard-Gustave de Coriolis produced more general equations describing the forces on bodies moving within a rotating reference frame. However, since these were in a paper examining the efficiency of water wheels, his work was largely ignored by scientists. Instead, it was a simple experiment that enabled geophysicists to understand how Earth’s spin diverts fluid movements in its interior and produces its magnetic field.

In 1911, the British physicist G. I. Taylor investigated how beakers of water behave when they are set spinning. The water quickly spins with the beaker and its surface rises in a parabola until the extra pressure counters the centrifugal force on the water. What’s interesting is how the water behaves when it is disturbed. Its movement changes the centrifugal force on it, as Coriolis’s equations predicted, so that when heated from below, it moves not in huge convection currents but up and down in narrow rotating columns. This discovery led the geophysicists Walter Elsasser and Edward Bullard to realise that the same forces would deflect convection currents in Earth’s metal outer core that are driven by radioactive decay. They are diverted into north-to-south columns of rotating metal that act like self-excited dynamos, producing the magnetic field that shields Earth from charged particles. A simple laboratory demonstration had illuminated events in Earth’s core that had been hidden in Coriolis’s equations.

Today, perhaps the most damaging failure to translate the mathematics of spin into easy-to-grasp concepts is in the fields of biomechanics and sports science. Our bodies are complex systems of rotating joints, but despite the sophistication of modern motion analysis software, few researchers realise that accelerating our joints can produce torques that actively accelerate our limbs. Biomechanics researchers are only starting to realise that accelerating our bodies upwards at the start of each step swings our arms and legs when we walk, and that a sling action straightens them at the end of each step.

In the same way, when we throw things, we use a multi-stage sling action; rotating our shoulders accelerates first our upper arm, then our forearm and finally our hands. And the reason we can wield heavy sledgehammers and swing wooden clubs to smash golf balls down the fairway is that their handles act as further sling elements; they accelerate forwards due to the centrifugal forces on them without us having to flex our wrists. Failing to articulate these simple mechanical concepts has made biomechanics ill-equipped to communicate with and help physiotherapists, sports coaches and roboticists.

And there is still confusion about the simplest aspects of rotation among physicists. Even Richard Feynman, for instance, was unable to explain the so-called Dzhanibekov effect – why spinning wing nuts on the International Space Station flip every few seconds. This was despite the fact that the mathematician Leonhard Euler had shown this should happen almost 300 years ago. The same is also true of more down-to-earth events: how children power playground swings and how cats land on their feet, for example.

The truth is that the basics of physics, despite involving simple mathematics, are harder to grasp than we tend to think. It took me two years, for instance, to master just the science of spin and rotation for my latest book. We need to spend more time thinking about, visualising and demonstrating basic physical concepts. If we do, we could produce a generation of physicists who can communicate better with everyone else and discover more about the world around us. The answers are probably already there, hidden in the equations.

The Science of Spin by Roland Ennos is out now.

For more such insights, log into www.international-maths-challenge.com.

*Credit for article given to Roland Ennos*


What are ‘multiplication facts’? Why are they essential to your child’s success in maths?

One of the essential skills students need to master in primary school mathematics are “multiplication facts”.

What are they? What are they so important? And how can you help your child master them?

What are multiplication facts?

Multiplication facts typically describe the answers to multiplication sums up to 10×10. Sums up to 10×10 are called “facts” as it is expected they can be easily and quickly recalled. You may recall learning multiplication facts in school from a list of times tables.

The shift from “times tables” to “multiplication facts” is not just about language. It stems from teachers wanting children to see how multiplication facts can be used to solve a variety of problems beyond the finite times table format.

For example, if you learned your times tables in school (which typically went up to 12×12 and no further), you might be stumped by being asked to solve 15×8 off the top of your head. In contrast, we hope today’s students can use their multiplication facts knowledge to quickly see how 15×8 is equivalent to 10×8 plus 5×8.

The shift in terminology also means we are encouraging students to think about the connections between facts. For example, when presented only in separate tables, it is tricky to see how 4×3 and 3×4 are directly connected.

Maths education has changed

In a previous piece, we talked about how mathematics education has changed over the past 30 years.

In today’s mathematics classrooms, teachers still focus on developing students’ mathematical accuracy and fast recall of essential facts, including multiplication facts.

But we also focus on developing essential problem-solving skills. This helps students form connections between concepts, and learn how to reason through a variety of real-world mathematical tasks.

Why are multiplication facts so important?

By the end of primary school, it is expected students will know multiplication facts up to 10×10 and can recall the related division fact (for example, 10×9=90, therefore 90÷10=9).

Learning multiplication facts is also essential for developing “multiplicative thinking”. This is an understanding of the relationships between quantities, and is something we need to know how to do on a daily basis.

When we are deciding whether it is better to purchase a 100g product for $3 or a 200g product for $4.50, we use multiplicative thinking to consider that 100g for $3 is equivalent to 200g for $6 – not the best deal!

Multiplicative thinking is needed in nearly all maths topics in high school and beyond. It is used in many topics across algebra, geometry, statistics and probability.

This kind of thinking is profoundly important. Research showsstudents who are more proficient in multiplicative thinking perform significantly better in mathematics overall.

In 2001, an extensive RMIT study found there can be as much as a seven-year difference in student ability within one mathematics class due to differences in students’ ability to access multiplicative thinking.

These findings have been confirmed in more recent studies, including a 2021 paper.

So, supporting your child to develop their confidence and proficiency with multiplication is key to their success in high school mathematics. How can you help?

Below are three research-based tips to help support children from Year 2 and beyond to learn their multiplication facts.

1. Discuss strategies

One way to help your child’s confidence is to discuss strategies for when they encounter new multiplication facts.

Prompt them to think of facts they already and how they can be used for the new fact.

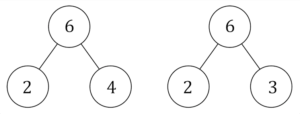
For example, once your child has mastered the x2 multiplication facts, you can discuss how 3×6 (3 sixes) can be calculated by doubling 6 (2×6) and adding one more 6. We’ve now realised that x3 facts are just x2 facts “and one more”!

The Conversation, CC BY-SA

Strategies can be individual: students should be using the strategy that makes the most sense to them. So you could ask a questions such as “if you’ve forgotten 6×7, how could you work it out?” (we might personally think of 6×6=36 and add one more 6, but your child might do something different and equally valid).

This is a great activity for any quiet car trip. It can also be a great drawing activity where you both have a go at drawing your strategy and then compare. Identifying multiple strategies develops flexible thinking.

2. Help them practise

Practising recalling facts under a friendly time crunch can be helpful in achieving what teachers call “fluency” (that is, answering quickly and easily).

A great game you could play with your children is “multiplication heads up” . Using a deck of cards, your child places a card to their forehead where you can see but they cannot. You then flip over the top card on the deck and reveal it to your child. Using the revealed card and the card on your child’s head you tell them the result of the multiplication (for example, if you flip a 2 and they have a 3 card, then you tell them “6!”).

Based on knowing the result, your child then guesses what their card was.

If it is challenging to organise time to pull out cards, you can make an easier game by simply quizzing your child. Try to mix it up and ask questions that include a range of things they know well with and ones they are learning.

Repetition and rehearsal will mean things become stored in long-term memory.

3. Find patterns

Another great activity to do at home is print some multiplication grids and explore patterns with your child.

The Conversation, CC BY-SA

A first start might be to give your child a blank or partially blankmultiplication grid which they can practise completing.

Then, using coloured pencils, they can colour in patterns they notice. For example, the x6 column is always double the answer in the x3 column. Another pattern they might see is all the even answers are products of 2, 4, 6, 8, 10. They can also notice half of the grid is repeated along the diagonal.

This also helps your child become a mathematical thinker, not just a calculator.

The importance of multiplication for developing your child’s success and confidence in mathematics cannot be understated. We believe these ideas will give you the tools you need to help your child develop these essential skills.

For more such insights, log into our website https://international-maths-challenge.com


What does a physicist see when looking at the NFT market?

The market for collectible digital assets, or non-fungible tokens, is an interesting example of a physical system with a large scale of complexity, non-trivial dynamics, and an original logic of financial transactions. At the Institute of Nuclear Physics of the Polish Academy of Sciences (IFJ PAN) in Cracow, its global statistical features have been analysed more extensively.

In the past, the value of money was determined by the amount of precious metals it contained. Today, we attribute it to certain sequences of digital zeros and ones, simply agreeing that they correspond to coins or banknotes. Non-fungible tokens (NFTs) operate by a similar convention: their owners assign a measurable value to certain sets of ones and zeros, treating them as virtual equivalents of assets such as works of art or properties.

NFTs are closely linked to the cryptocurrency markets but change their holders in a different way to, for example, bitcoins. While each bitcoin is exactly the same and has the same value, each NFT is a unique entity with an individually determined value, integrally linked to information about its current owner.

“Trading in digital assets treated in this way is not guided by the logic of typical currency markets, but by the logic of markets trading in objects of a collector’s nature, such as paintings by famous painters,” explains Prof. Stanislaw Drozdz (IFJ PAN, Cracow University of Technology.)

“We have already become familiar with the statistical characteristics of cryptocurrency markets through previous analyses. The question of the characteristics of a new, very young and at the same time fundamentally different market, also built on blockchain technology, therefore arose very naturally.”

The market for NFTs was initiated in 2017 with the blockchain created for the Ethereum cryptocurrency. The popularization of the idea and the rapid growth of trading took place during the pandemic. At that time, a record-breaking transaction was made at an auction organized by the famous English auction house Christie’s, when the art token Everyday: The First 5000 Days, created by Mike Winkelmann, was sold for $69 million.

Tokens are generally grouped into collections of different sizes, and the less frequently certain characteristics of a token occur in a collection, the higher its value tends to be. Statisticians from IFJ PAN examined publicly available data from the CryptoSlam (cryptoslam.io) and Magic Eden (magiceden.io) portals on five popular collections running on the Solana cryptocurrency blockchain.

These were sets of images and animations known as Blocksmith Labs Smyths, Famous Fox Federation, Lifinity Flares, Okay Bears, and Solana Monkey Business, each containing several thousand tokens with an average transaction value of close to a thousand dollars.

“We focused on analysing changes in the financial parameters of a collection such as its capitalization, minimum price, the number of transactions executed on individual tokens per unit of time (hour), the time interval between successive transactions, or the value of transaction volume. The data covered the period from the launch date of a particular collection up to and including August 2023,” says Dr. Marcin Watorek (PK).

For stabilized financial markets, the presence of certain power laws is characteristic, signaling that the likelihood of large events occurring is greater than would result from a typical Gaussian probability distribution. It appears that the operation of such laws is already evident in the fluctuations of NFT market parameters, for example, in the distribution of times between individual trades or in volume fluctuations.

Among the statistical parameters analysed by the researchers from the IFJ PAN was the Hurst exponent, which describes the reluctance of a system to change its trend. The value of this exponent falls below 0.5 when the system has a tendency to fluctuate: all rises increase the probability of a decrease (or vice versa).

In contrast, values above 0.5 indicate the existence of a certain long-term memory: after a rise, there is a higher probability of another rise; after a fall, there is a higher probability of another fall. For the token collections studied, the values of the Hurst exponent were between 0.6 and 0.8, thus at a level characteristic of highly reputable markets. In practice, this property means that the trading prices of tokens from a given collection fluctuate in a similar manner in many cases.

The existence of a certain long-term memory of the system, reaching up to two months in the NFT market, may indicate the presence of multifractality. When we start to magnify a fragment of an ordinary fractal, sooner or later, we see a structure resembling the initial object, always after using the same magnification. Meanwhile, in the case of multifractals, their different fragments have to be magnified at different speeds.

It is precisely this non-linear nature of self-similarity that has also been observed in the digital collectors’ market, among others, for minimum prices, numbers of transactions per unit of time, and intervals between transactions. However, this multifractality was not fully developed and was best revealed in those situations where the greatest fluctuations were observed in the system under study.

“Our research also shows that the price of the cryptocurrency for which collections are sold directly affects the volume they generate. This is an important observation, as cryptocurrency markets are already known to show many signs of statistical maturity,” notes Pawel Szydlo, first author of the article in Chaos: An Interdisciplinary Journal of Nonlinear Science.

The analyses carried out at IFJ PAN lead to the conclusion that, despite its young age and slightly different trading mechanisms, the NFT market is beginning to function in a manner that is statistically similar to established financial markets. This fact seems to indicate the existence of a kind of universalism among financial markets, even of a significantly different nature. However, its closer understanding will require further research.

For more such insights, log into our website https://international-maths-challenge.com

Credit of the article given to Polish Academy of Sciences


Use of decimal point is 1.5 centuries older than historians thought

A mathematical historian at Trinity Wester University in Canada, has found use of a decimal point by a Venetian merchant 150 years before its first known use by German mathematician Christopher Clavius. In his paper published in the journal Historia Mathematica, Glen Van Brummelen describes how he found the evidence of decimal use in a volume called “Tabulae,” and its significance to the history of mathematics.

The invention of the decimal point led to the development of the decimal system, and that in turn made it easier for people working in multiple fields to calculate non-whole numbers (fractions) as easily as whole numbers. Prior to this new discovery, the earliest known use of the decimal point was by Christopher Clavius as he was creating astronomical tables—the resulting work was published in 1593.

The new discovery was made in a part of a manuscript written by Giovanni Bianchini in the 1440s—Van Brummelen was discussing a section of trigonometric tables with a colleague when he noticed some of the numbers included a dot in the middle. One example was 10.4, which Bianchini then multiplied by 8 in the same way as is done with modern mathematics. The finding shows that a decimal point to represent non-whole numbers occurred approximately 150 years earlier than previously thought by math historians.

Giovanni Bianchini worked as a merchant in Venice for many years before being appointed to an administrative role with a major estate owned by the powerful d’Este family. In this role, he also managed assets and investments, giving him a strong background in mathematics. He also published astronomy texts, demonstrating his ability to plot planetary motion and to predict when an eclipse would occur.

The finding suggests that Bianchini played a more important role in the development of math fundamentals than previously known. Van Brummelen notes that, as a merchant, Bianchini would have traveled extensively, including to places in the Islamic world, where math concepts were being developed, possibly influencing his use of non-whole numbers and ways to represent them more easily.

For more such insights, log into our website https://international-maths-challenge.com

Credit of the article given to Bob Yirka , Phys.org


What are ‘multiplication facts’? Why are they essential to your child’s success in math?

One of the essential skills students need to master in primary school mathematics are “multiplication facts.”

What are they? What are they so important? And how can you help your child master them?

What are multiplication facts?

Multiplication facts typically describe the answers to multiplication sums up to 10×10. Sums up to 10×10 are called “facts” as it is expected they can be easily and quickly recalled. You may recall learning multiplication facts in school from a list of times tables.

The shift from “times tables” to “multiplication facts” is not just about language. It stems from teachers wanting children to see how multiplication facts can be used to solve a variety of problems beyond the finite times table format.

For example, if you learned your times tables in school (which typically went up to 12×12 and no further), you might be stumped by being asked to solve 15×8 off the top of your head. In contrast, we hope today’s students can use their multiplication facts knowledge to quickly see how 15×8 is equivalent to 10×8 plus 5×8.

The shift in terminology also means we are encouraging students to think about the connections between facts. For example, when presented only in separate tables, it is tricky to see how 4×3 and 3×4 are directly connected.

Math education has changed

In a previous piece, we talked about how mathematics education has changed over the past 30 years.

In today’s mathematics classrooms, teachers still focus on developing students’ mathematical accuracy and fast recall of essential facts, including multiplication facts.

But we also focus on developing essential problem-solving skills. This helps students form connections between concepts, and learn how to reason through a variety of real-world mathematical tasks.

Why are multiplication facts so important?

By the end of primary school, it is expected students will know multiplication facts up to 10×10 and can recall the related division fact (for example, 10×9=90, therefore 90÷10=9).

Learning multiplication facts is also essential for developing “multiplicative thinking.” This is an understanding of the relationships between quantities, and is something we need to know how to do on a daily basis.

When we are deciding whether it is better to purchase a 100g product for $3 or a 200g product for $4.50, we use multiplicative thinking to consider that 100g for $3 is equivalent to 200g for $6—not the best deal!

Multiplicative thinking is needed in nearly all math topics in high school and beyond. It is used in many topics across algebra, geometry, statistics and probability.

This kind of thinking is profoundly important. Research shows students who are more proficient in multiplicative thinking perform significantly better in mathematics overall.

In 2001, an extensive RMIT study found there can be as much as a seven-year difference in student ability within one mathematics class due to differences in students’ ability to access multiplicative thinking.

These findings have been confirmed in more recent studies, including a 2021 paper.

So, supporting your child to develop their confidence and proficiency with multiplication is key to their success in high school mathematics. How can you help?

Below are three research-based tips to help support children from Year 2 and beyond to learn their multiplication facts.

  1. Discuss strategies

One way to help your child’s confidence is to discuss strategies for when they encounter new multiplication facts.

Prompt them to think of facts they already and how they can be used for the new fact.

For example, once your child has mastered the x2 multiplication facts, you can discuss how 3×6 (3 sixes) can be calculated by doubling 6 (2×6) and adding one more 6. We’ve now realized that x3 facts are just x2 facts “and one more”!

Strategies can be individual: students should be using the strategy that makes the most sense to them. So you could ask a questions such as “if you’ve forgotten 6×7, how could you work it out?” (we might personally think of 6×6=36 and add one more 6, but your child might do something different and equally valid).

This is a great activity for any quiet car trip. It can also be a great drawing activity where you both have a go at drawing your strategy and then compare. Identifying multiple strategies develops flexible thinking.

  1. Help them practice

Practicing recalling facts under a friendly time crunch can be helpful in achieving what teachers call “fluency” (that is, answering quickly and easily).

A great game you could play with your children is “multiplication heads up” . Using a deck of cards, your child places a card to their forehead where you can see but they cannot. You then flip over the top card on the deck and reveal it to your child. Using the revealed card and the card on your child’s head you tell them the result of the multiplication (for example, if you flip a 2 and they have a 3 card, then you tell them “6!”).

Based on knowing the result, your child then guesses what their card was.

If it is challenging to organize time to pull out cards, you can make an easier game by simply quizzing your child. Try to mix it up and ask questions that include a range of things they know well with and ones they are learning.

Repetition and rehearsal will mean things become stored in long-term memory.

  1. Find patterns

Another great activity to do at home is print some multiplication grids and explore patterns with your child.

A first start might be to give your child a blank or partially blank multiplication grid which they can practice completing.

Then, using colored pencils, they can color in patterns they notice. For example, the x6 column is always double the answer in the x3 column. Another pattern they might see is all the even answers are products of 2, 4, 6, 8, 10. They can also notice half of the grid is repeated along the diagonal.

This also helps your child become a mathematical thinker, not just a calculator.

The importance of multiplication for developing your child’s success and confidence in mathematics cannot be understated. We believe these ideas will give you the tools you need to help your child develop these essential skills.

For more such insights, log into our website https://international-maths-challenge.com

Credit of the article given to Bronwyn Reid O’Connor and Benjamin Zunica, The Conversation


Why prices are so high—8 ways retail pricing algorithms gouge consumers

The just-released report of the inquiry into price gouging and unfair pricing conducted by Allan Fels for the Australian Council of Trades Unions does more than identify the likely offenders.

It finds the biggest are supermarkets, banks, airlines and electricity companies.

It’s not enough to know their tricks. Fels wants to give the Australian Competition and Consumer Commission more power to investigate and more power to prohibit mergers.

But it helps to know how they try to trick us, and how technology has enabled them to get better at it. After reading the report, I’ve identified eight key maneuvers.

  1. Asymmetric price movements

Otherwise known as Rocket and Feather, this is where businesses push up prices quickly when costs rise, but cut them slowly or late after costs fall.

It seems to happen for petrol and mortgage rates, and the Fels inquiry was presented with evidence suggesting it happens in supermarkets.

Brendan O’Keeffe from NSW Farmers told the inquiry wholesale lamb prices had been falling for six months before six Woolworths announced a cut in the prices of lamb it was selling as a “Christmas gift.”

  1. Punishment for loyal customers

A loyalty tax is what happens when a business imposes higher charges on customers who have been with it for a long time, on the assumption that they won’t move.

The Australian Securities and Investments Commission has alleged a big insurer does it, setting premiums not only on the basis of risk, but also on the basis of what a computer model tells them about the likelihood of each customer tolerating a price hike. The insurer disputes the claim.

It’s often done by offering discounts or new products to new customers and leaving existing customers on old or discontinued products.

It happens a lot in the electricity industry. The plans look good at first, and then less good as providers bank on customers not making the effort to shop around.

Loyalty taxes appear to be less common among mobile phone providers. Australian laws make it easy to switch and keep your number.

  1. Loyalty schemes that provide little value

Fels says loyalty schemes can be a “low-cost means of retaining and exploiting consumers by providing them with low-value rewards of dubious benefit.”

Their purpose is to lock in (or at least bias) customers to choices already made.

Examples include airline frequent flyer points, cafe cards that give you your tenth coffee free, and supermarket points programs. The purpose is to lock in (or at least bias) consumers to products already chosen.

The Australian Competition and Consumer Commission has found many require users to spend a lot of money or time to earn enough points for a reward.

Others allow points to expire or rules to change without notice or offer rewards that are not worth the effort to redeem.

They also enable businesses to collect data on spending habits, preferences, locations, and personal information that can be used to construct customer profiles that allow them to target advertising and offers and high prices to some customers and not others.

  1. Drip pricing that hides true costs

The Competition and Consumer Commission describes drip pricing as “when a price is advertised at the beginning of an online purchase, but then extra fees and charges (such as booking and service fees) are gradually added during the purchase process.”

The extras can add up quickly and make final bills much higher than expected.

Airlines are among the best-known users of the strategy. They often offer initially attractive base fares, but then add charges for baggage, seat selection, in-flight meals and other extras.

  1. Confusion pricing

Related to drip pricing is confusion pricing where a provider offers a range of plans, discounts and fees so complex they are overwhelming.

Financial products like insurance have convoluted fee structures, as do electricity providers. Supermarkets do it by bombarding shoppers with “specials” and “sales.”

When prices change frequently and without notice, it adds to the confusion.

  1. Algorithmic pricing

Algorithmic pricing is the practice of using algorithms to set prices automatically taking into account competitor responses, which is something akin to computers talking to each other.

When computers get together in this way they can act as it they are colluding even if the humans involved in running the businesses never talk to each other.

It can act even more this way when multiple competitors use the same third-party pricing algorithm, effectively allowing a single company to influence prices.

  1. Price discrimination

Price discrimination involves charging different customers different prices for the same product, setting each price in accordance with how much each customer is prepared to pay.

Banks do it when they offer better rates to customers likely to leave them, electricity companies do it when they offer better prices for business customers than households, and medical specialists do it when they offer vastly different prices for the same service to consumers with different incomes.

It is made easier by digital technology and data collection. While it can make prices lower for some customers, it can make prices much more expensive to customers in a hurry or in urgent need of something.

  1. Excuse-flation

Excuse-flation is where general inflation provides “cover” for businesses to raise prices without justification, blaming nothing other than general inflation.

It means that in times of general high inflation businesses can increase their prices even if their costs haven’t increased by as much.

On Thursday Reserve Bank Governor Michele Bullock seemed to confirm that she though some firms were doing this saying that when inflation had been brought back to the Bank’s target, it would be “much more difficult, I think, for firms to use high inflation as cover for this sort of putting up their prices.”

A political solution is needed

Ultimately, our own vigilance won’t be enough. We will need political help. The government’s recently announced competition review might be a step in this direction.

The legislative changes should police business practices and prioritize fairness. Only then can we create a marketplace where ethics and competition align, ensuring both business prosperity and consumer well-being.

This isn’t just about economics, it’s about building a fairer, more sustainable Australia.

For more such insights, log into our website https://international-maths-challenge.com

Credit of the article given to David Tuffley, The Conversation


Studies recommend increased research into achievement, engagement to raise student math scores

A new study into classroom practices, led by Dr. Steve Murphy, has found extensive research fails to uncover how teachers can remedy poor student engagement and perform well in math.

More than 3,000 research papers were reviewed over the course of the study, but only 26 contained detailed steps for teachers to improve both student engagement and results in math. The review is published in the journal Teaching and Teacher Education.

Dr. Murphy said the scarcity of research involving young childrenwas concerning.

“Children’s engagement in math begins to decline from the beginning of primary school while their mathematical identity begins to solidify,” Dr. Murphy said.

“We need more research that investigates achievement and engagement together to give teachers good advice on how to engage students in mathematics and perform well.

“La Trobe has developed a model for research that can achieve this.”

While teachers play an important role in making decisions that impact the learning environment, Dr. Murphy said parents are also highly influential in children’s math education journeys.

“We often hear parents say, ‘It’s OK, I was never good at math,’ but they’d never say that to their child about reading or writing,” Dr. Murphy said.

La Trobe’s School of Education is determined to improve mathematical outcomes for students, arguing it’s an important school subject that is highly applicable in today’s technologically rich society.

Previous research led by Dr. Murphy published in Educational Studies in Mathematics found many parents were unfamiliar with the modern ways of teaching math and lacked self-confidence to independently assist their children learning math during the COVID-19 pandemic.

“The implication for parents is that you don’t need to be a great mathematician to support your children in math, you just need to be willing to learn a little about how schools teach math today,” Dr. Murphy said.

“It’s not all bad news for educators and parents. Parents don’t need to teach math; they just need to support what their children’s teacher is doing.

“Keeping positive, being encouraging and interested in their children’s math learning goes a long way.”

For more such insights, log into our website https://international-maths-challenge.com

Credit of the article to be given La Trobe Universit


Children’s positive attitude toward mathematics fades during the early school years, finds study

Children’s interest in, and competence perceptions of, mathematics are generally quite positive as they begin school, but turn less positive during the first three years. Changes in interest and self-concept are also associated with each other. In other words, if a child’s interest fades, so does their competence perception, and vice versa.

This is shown by a recent study from Finland published in the British Journal of Educational Psychology that explores the development of children’s motivation for mathematics during the early school years and how that development is associated with their mathematics competence. The researchers followed nearly 300 children for three years.

“A significant observation was that both school beginners’ higher initial motivation, and less decline in motivation during the follow-up, predicted better competence in the third grade, after accounting for initial differences in competence,” says Professor Markku Niemivirta of the University of Eastern Finland.

There were no gender differences in school beginners’ motivation and competence, but at the end of the follow-up, girls’ motivation had, on average, declined more than that of boys.

Gendered development is starting to show

The study shows that children are able to assess their motivation for mathematics rather accurately already when beginning school. In addition, children’s assessments of their interest and competence are already differentiated, despite being closely related.

“It is only natural that children are more interested in things they feel good at. And vice versa, they may do better in something they’re interested in.”

On average however, school beginners’ positive motivation starts to decline during the early school years, and the scale of this decline is associated with later differences in competence. Although there are no gender differences in competence, girls’ more negative change in motivation on average reflects an unfortunate gendered development, the traces of which remain visible until much later.

Practices for maintaining interest and having experiences of success

Although the negative change observed in the study may partly reflect children’s more realistic self-assessment over time, the researchers suspect that a role is also played by mathematics gradually getting more difficult, and an emphasis being placed on performance.

“The observed association between a change in motivation and competence shows, however, the added value of positive interest and self-concept. It would be important to develop and apply teaching practices that support and maintain children’s interest in mathematics and strengthen their experiences of success,” Niemivirta says.

In the three-year study conducted by the Motivation, Learning and Well-being research collective, MoLeWe, children assessed their interest in, and competence perceptions of, mathematics annually. Mathematics competence was assessed by tests and teacher evaluations.

For more such insights, log into our website https://international-maths-challenge.com

Credit of the article to be given University of Eastern Finland


Sports deflation: Study shows NBA 3-point shot has lost its value

When the NBA celebrated the start of its 75th season in fall 2021, it was clear that the 3-point shot adopted by the league in 1979-80 had transformed the sport.

The number of attempts beyond the arc had increased in each of the previous 10 seasons, from 22.2% in 2010-11 to 39.2% in 2020-21, and it had been nearly five years since a team won a game without making at least one 3-pointer (that streak is now up to eight years). Led by 3-point specialists Steph Curry and Klay Thompson, the Golden State Warriors had won three of the previous seven NBA titles and were about to win a fourth in 2022.

It appeared that the 3-point revolution would never end. But a recent study by Falk College of Sport and Human Dynamics sport analytics professor Shane Sanders and associate professor Justin Ehrlich shows that while the number of 3-point shots continues to increase, the average expected value of 3-pointers has become less than 2-pointers since the 2017-18 season.

“When taking fouled shots and made free throws into consideration, we found that what had long been a premium for the 3-point shot started to become a dispremium in the 2017-18 season and that trend is continuing,” Ehrlich says. “The implication of these findings is enormous in terms of potential impact on roster construction and offensive philosophies.”

The research preprint from Sanders and Ehrlich, “Estimating NBA Team Shot Selection Efficiency from Aggregations of True, Continuous Shot Charts: A Generalized Additive Model Approach,” is available through the Social Science Research Network website. Sanders and Ehrlich will present their paper as one of seven finalists in the research competition at the NBA-centric MIT Sloan Sports Analytics Conference March 1-2 in Boston, Massachusetts.

“In past conferences, there has been a lot of discussion among NBA executives about how basketball analytics created the 3-point ‘moneyball’ era of basketball and how this has impacted the popularity of the game,” Sanders says. “Perhaps ironically, our research uses basketball analytics, along with a fully specified team offensive objective function, to say there is now too much 3-point shooting for a point-maximizing offense.”

To conduct their research, Sanders and Ehrlich developed a new shot chart that uses a generalized additive model to estimate total shot proficiency continuously in the half-court. Their shot chart incorporates missed shots that draw a shooting foul—and shot-pursuant free throw scoring—to determine total scoring yield following a shot decision.

Current expected value formulas fall short by not including this additional information, which, when combined with the outcome of the initial shot attempt, results in what Sanders and Ehrlich call the “true point value” of a shot. For the 2022-23 NBA season:

  • True Value from 2-point shot attempts=1.181
  • True Value from 3-point shot attempts=1.094

And even when not factoring in free throws, the researchers found that the expected value from 3-point shots are now worth less than 2-point shots. For the 2022-23 NBA season:

  • Expected value from 2P field goal attempt=2P% * 2 = .548 * 2= 1.096
  • Expected value from 3P field goal attempt=3P% * 3 = .361 * 3= 1.083

The true value data can be found in this dashboard, and the graph above shows the expected and true values of 2- and 3-point shots from 2016-22.

According to this research, the expected value from average 2-point field goal attempts (FGA) is now worth 0.013 points more than average 3-point FGA, even before factoring in shot-pursuant free throw scoring. In other words, if you multiply the probability of making a 3-point FGA times the value of a 3-point FGA, it’s worth less than if you multiple a 2-point FGA times the value of a 2-point FGA.

When discussing true point value, the researchers use the term “shot attempts” instead of “field goal attempts” because their formula includes missed shots when a player is fouled, which is not included in standard field-goal attempt statistics. So, when including made and missed free throws, the disparity based on this new true value metric is even greater as average 2-point shot attempts are now worth 0.087 more points than 3-point shot attempts.

Officials from NBA teams and the league have discussed moving the 3-point line back from its current distance of 23 feet, 9 inches (22 feet in the corners). But as this study shows, the value of a 3-pointer is decreasing at the current distance, and teams are already starting to alter their shot selection to emphasize more high-percentage 2-point shots.

“These research findings do not coincide completely with the unresearched musings of NBA analysts Charles Barkley and Shaquille O’Neal,” Sanders says.

“For example, our findings do not suggest that such perimeter stars as Stephen Curry or Damian Lillard should not shoot a lot of threes. It means marginal stretch fours and other marginal outside shooters should not pull up for a 3 as often and that some marginal outside shooters should not extend their range to 25-26 feet or more. Players can still achieve the offensive spacing benefits of positioning on the perimeter without some players shooting from there quite as often.”

For more such insights, log into our website https://international-maths-challenge.com

Credit of the article given to Matt Michael, Syracuse University