Healing with math

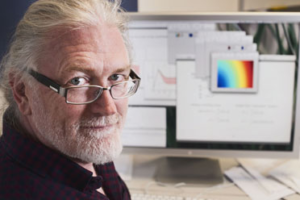
Professor Graeme Pettet is using mathematical equations to better understand how to heal wounds and bone fractures.

Understanding the way our bodies heal is not as easy as 1, 2, 3. But a Queensland University of Technology (QUT) researcher believes mathematics holds the answers to complex biological problems.

Professor Graeme Pettet, a mathematician from QUT’s Institute of Health Biomedical Innovation (IHBI), said maths could be used to better understand the structure of skin and bones and their response to healing techniques, which will eventually lead to better therapeutic innovations.

“Mathematics is the language of any science so if there are spatial or temporal variations of any kind then you can describe it mathematically,” he said.

Professor Pettet is a member of the Tissue Repair and Regeneration group, which in part focuses on growing skin in a laboratory and analysing its growth and repair process.

His team concentrates on the theoretical material, using data to build and solve mathematical equations.

“Skin is very difficult to describe. It’s very messy and very complicated. In fact most of the descriptions that engineers and biologists use are schematic stories (diagrams),” he said.

“Once we understand the structure (of the skin) and how it develops we can begin to analyse how that development impacts upon healing in the skin and maybe also diseases of the skin.”

Professor Pettet said his research would, for the first time, formalise the theories about the way cells interact when healing.

“It is clear that by improving our understanding of how the multiple cellular processes work together in a complex but orchestrated way has great potential in leading to therapeutic innovations,” he said.

Despite skin being our most accessible organ, Professor Pettet said there was a lot more to learn about how and what made it function.

“There’s a lot of structure just in the upper layer of the skin despite the fact it’s only a few cells thick,” he said.

“This can be characterised by how the cells function and change appearance, but what drives them to be that way is not completely known.

“My job is to try and understand and develop ways to describe how the bits and pieces everybody knows about are somehow connected.”

Professor Pettet is also working on applying similar techniques to figure out how to show how small, localised damage at the site of bone fractures can impact on healing.

While the long-term goal of understanding and being able to predict how our bodies heal is still a way off, Professor Pettet’s research is opening up a realm of biological problems where mathematical equations and techniques that have not previously been applied, are providing insights into the biology as well as the maths.

“We’ve discovered essentially new sets of solutions in these contexts and that’s led onto other projects looking at new mathematical tools to describe these new solutions that we’ve never seen before,” he said.

For more such insights, log into our website https://international-maths-challenge.com

Credit of the article given to Alita Pashley, Queensland University of Technology


Yes, there’s a numeracy crisis – so what’s the solution?

There’s been plenty of commentary recently on the “numeracy crisis” threatening the economies of many developed nations, including Australia.

A 2009 report by the National Academies in the US was not the first to highlight the desperate need to improve mathematical education, particularly at the K-12 level, where so many otherwise talented students either fall behind or lose interest. The report’s summary concluded:

“The new demands of international competition in the 21st century require a workforce that is competent in and comfortable with mathematics.

“There is particular concern about the chronically low mathematics and science performance of economically disadvantaged students and the lack of diversity in the science and technical workforce. Particularly alarming is that such disparities exist in the earliest years of schooling and even before school entry …”

The committee found that, although virtually all young children have the capability to learn and become competent in mathematics, the potential to learn mathematics in the early years of school is not currently realised for most.

This stems from a lack of opportunities to learn mathematics either in early childhood settings or through everyday experiences at home and in communities. And this is especially the case for the economically disadvantaged.

A UK report released last month found that millions of British adults have numerical skills at a level more commonly expected of an 11-year-old. The report also found that young people with poor numeracy skills were twice as likely to drop out of school and twice as likely to be unemployed.

The report’s authors called for a change in society’s attitude to mathematics, so that being bad at maths should no longer be seen as a “badge of honour”.

According to the same UK report, one in five of business members questioned last year said they had to teach remedial mathematics to their employees. As James Fothergill, head of education and skills at the employers’ group CSI, explained:

“It’s really important that [employees] are helped to apply maths skills and concepts in practical situations, such as being able to work out what a 30% discount is without doing it on the till.”

Many business leaders also pointed to the fact few of their employees were able to spot “rogue figures” – data that is likely to be in error.

In February this year, speaking at a forum of national educators in Canberra, Australia’s Nobel Prize-winning astronomer Brian Schmidt went so far as to warn that Australia’s resource boom was threatened by a lack of highly-trained engineers, saying:

“Too many kids who are willing and able to excel at maths are taught by teachers without the competency required to teach the subjects they are teaching.”

At the same forum, Australia’s Chief Scientist Ian Chubb said part of the problem was that mathematics and science courses were considered “boring”.

“We need to think about how to deliver the science and mathematics to a generation of students that have many more options available to them,” he said.

The situation is better elsewhere. Finland and Canada, for example, rated an “A” in an international ranking of 17 developed nations in education and skills. Finland has ranked at (or near) the top of the OECD nations in educational performance for more than ten straight years.

Canada’s strength derives in part from the system’s primary focus on K-12 education. On the other hand, Canada faces the challenge of educating and training the three million adults, in a country of under 35m people, who have only “Level 1” literacy. This would seem to show that you do get what you pay for.

Of course, other countries, such as Japan, Taiwan, China, Korea and Singapore are not standing still, with impressive gains in educational performance.

So, what can be done, for the good of everyone? Perhaps all nations can examine the educational programs of highly successful nations such as Finland.

The Finnish educational system eschews standards tests, preferring instead custom tests devised by highly qualified teachers. (Several decades ago, the government required all teachers to have master’s degrees).

Another is Finland’s focus on basic education from age seven until 16, at which point 95% of the population continues in either vocational or academic high schools. According to Pasi Sahlberg, a Finnish educator and author:

“The primary aim of education is to serve as an equalising instrument for society.”

For more such insights, log into our website https://international-maths-challenge.com

Credit of the article given to Jonathan Borwein and David H. Bailey


Contact networks have no influence on cooperation among individuals

This is a simulation of a network of people playing Prisoner’s Dilemma. Red are cooperators; blue are defectors.

For the past twenty years, there has been a great controversy regarding whether the structure of interactions among individuals (that is, if the existence of a certain contact network or social network) helps to foment cooperation among them in situations in which not cooperating brings benefits without generating the costs of helping. Many theoretical studies have analysed this subject, but the conclusions have been contradictory since the way in which people make decisions is almost always based on a hypothesis of the models with very little basis to justify it.

The study carried out by these university researchers adopts a pioneering perspective on the theoretical study of the emergence of cooperation: rather than postulating that people make decisions according to one procedure or another, it incorporates the results obtained in experiments designed precisely to analyse how people decide whether to cooperate or not. The authors of the study are professors from the Interdisciplinary Complex Systems Group (Grupo Interdisciplinar de Sistemas Complejos – GISC) of the Mathematics Department of Carlos III University of Madrid, José Cuesta and Ángel Sánchez, together with Carlos Gracia and Yamir Moreno, from the Complex Systems and Networks Group (Grupo de Redes y Sistemas Complejos – COSNET Lab) of the Institute for Biocomputation and Physics of Complex Systems (Instituto de Biocomputación y Física de Sistemas Complejos – BIFI) of the University of Zaragoza. Their study was recently published in Scientific Reports, Nature’s new open access magazine.

This work is based on the results of an experiment carried out by the researchers and on information from other previous studies, as well as on the results (as yet unpublished) obtained from their own new experiments. The observations from these studies coincide in indicating that people do not consider what those they interact with gain; rather they think about whether or not they cooperate. In addition, their decisions usually depend on their own mood. That is, the authors noticed that the probability of cooperation occurring was considerably higher if there had been cooperation in the previous interaction. They also observed a certain heterogeneity in behaviour, finding a certain percentage of individuals who cooperated very little, regardless of what those around them did, and other individuals who almost always cooperated, again, no matter what others did.

These researchers have mathematically examined what occurs when groups of people who behave as the experiments say have to decide whether or not to cooperate, and how the existence of cooperation, globally or in the group, depends on the structure of the interactions. Specifically, the study analyses what happens if each person interacts with all of the others, if the people are placed in a square reticule and they interact with their four closest neighbours, or if they are arranged in a network that is more similar to a social network, in which the number of neighbours is highly variable and is dependent on each person. In the first case (each individual interacts with all of the others), the problem can be solved mathematically, so the level of resulting cooperation can be predicted. What the researchers observed is that this depends on the makeup of the population; that is, what proportion of the individuals use the previously described strategy, and what proportion almost always cooperates or almost never does, regardless of what the others do. Afterwards, this prediction can be compared with the results of numeric simulations obtains for the populations placed in each of the two networks, and it can be shown that the result is exactly the same, unlike what had been concluded in previous studies.

The consequences of this prediction are very important, according to the authors of the study, because if they are true, it would rule out the existence of one of the five mechanisms that have been proposed to explain the emergence of cooperation, the so-called “network reciprocity” mechanism. In order to prove the prediction, it will be necessary to carry out a large-scale experiment, something that this group of researchers in currently very involved in. These experiments are very difficult to carry out, given that studying heterogeneous networks in such a way as to obtain significant results, the team must work with hundred of volunteers simultaneously. If, as the team hopes, the experiments confirm what this study predicts, we would be witnessing a paradigm shift in the interpretation of decision-making in cooperative dilemmas: instead of considering what is to be gained, individuals would base their decisions on the cooperation they have received, and this would mean that the way that they interact (the underlying social network) would cease to be important.

For more such insights, log into our website https://international-maths-challenge.com

Credit of the article given to Carlos III University of Madrid


Leading education publisher uses SpaceMath@NASA to help students master mathematics

This is a sample from a Spacemath@NASA problem. This diagram shows disks representing the planets discovered in orbit around eight different stars all drawn to the same scale. Earth and Jupiter are also shown for size comparison. This lesson asks the viewer to solve problems using fraction arithmetic to find out how big these new planets are compared to Earth and Jupiter.

NASA today announced that Houghton Mifflin Harcourt (HMH), Boston, has incorporated math problems developed by the SpaceMath@NASA program into some of its latest curriculum and educational products. SpaceMath uses the latest discoveries from NASA’s space science missions to develop grade-appropriate math problems spanning all of the contemporary mathematics topics areas in formal education.

“We are proud of the partnership with HMH, especially at a time when a vibrant, national science, engineering, technology, and math (STEM) education program is a major priority,” said astronomer Sten Odenwald of ADNET Systems, Inc., Lanham, Md. “SpaceMath@NASA has partnered with a major STEM education solutions provider to help students see the deep connections between math and science using NASA and space exploration as a theme.” Odenwald, who is stationed at NASA’s Goddard Space Flight Center in Greenbelt, Md., leads a team of education and public outreach (E&PO) professionals who develop the SpaceMath materials.

“Other education companies are welcome to work with SpaceMath and follow HMH’s example,” says Odenwald. “The informal partnership entails periodic consultation with the company to understand its interests and what types of content best suits its goals. We then build modules on the SpaceMath@NASA website that contain as many content requests as we can accommodate. In turn, we can offer our NASA-version of these modules for open access by all visiting teachers, while HMH is free to download those module elements to populate their own Web pages and books.”

SpaceMath products, simple one-page problems featuring a NASA discovery or engineering issue, are designed for direct classroom use by students in grades 3 through 12 using authentic, on-grade-level math topics rooted in real-world science and engineering data. It was developed in 2003 to help NASA missions upgrade their E&PO offerings by explicitly integrating mathematics problems into the science content. It was also specifically designed to meet the needs of the No Child Left Behind classroom environment where short, targeted math problems in a one-page format were now becoming the preferred method for presenting a variety of math experiences.

Problems are commonly extracted from NASA press releases and written to feature some surprising but quantifiable aspect of an image or discovery that can be paraphrased as simple mathematical problems. “These can be as diverse as a problem on fractions and percentages using Kepler exoplanet data, or as involved as determining the volume of Comet Hartley-2 using integral calculus,” said Odenwald.

“We are very excited to partner with NASA,” said Jim O’Neill, Senior Vice President, Portfolio Strategy and Marketing Management for HMH. “By incorporating the resources provided by SpaceMath@NASA into our programs, HMH can help develop students’ critical thinking skills through real-world applications that are taken from the headlines. These STEM activities also highlight the pedagogy of the Common Core for Mathematics by strengthening students’ abilities to apply concepts and integrate the Standards for Mathematical Practice.”

“Our partnership with HMH has grown out of a 10-year collaboration with them, so we consider them a major partner for future resource development,” adds Odenwald.

SpaceMath was originally funded by NASA’s E&PO programs for the IMAGE and Hinode missions. Since 2008, the program has been funded by two grants from the NASA Science Mission Directorate at NASA Headquarters, Washington – through the Research Opportunities in Space and Earth Sciences/Education and Public Outreach for Earth and Space Science (ROSES/EPOESS) program.

“Funding at the Directorate level has been crucial in allowing SpaceMath to utilize all of NASA’s press releases and extensive resources as subject matter for mathematics problems, rather than focusing exclusively on only a few NASA missions and science themes,” said Odenwald.

For more such insights, log into our website https://international-maths-challenge.com

Credit of the article given to NASA’s Goddard Space Flight Center


The mathematics of jury size: Statistical model shows several interesting properties of US jury configurations

Could different jury sizes improve the quality of justice? The answers are not clear, but mathematicians are analysing juries to identify potential improvements.

The U.S. Constitution does not say that juries in criminal cases must include 12 people or that their decisions must be unanimous. In fact, some states use juries of different sizes.

One primary reason why today’s juries tend to have 12 people is that the Welsh king Morgan of Gla-Morgan, who established jury trials in 725 A.D., decided upon the number, linking the judge and jury to Jesus and his Twelve Apostles.

The Supreme Court has ruled that smaller juries can be permitted. States such as Florida, Connecticut and others have used — or considered — smaller juries of six or nine people. In Louisiana, super-majority verdicts of nine jurors out of 12 are allowed.

However, in 1978, the Supreme Court ruled that a five-person jury is not allowed after Georgia attempted to assign five-person juries to certain criminal trials.

To mathematicians and statisticians, this offers a clear division between acceptable and not acceptable, and therefore an opportunity for analysis.

“What seems to be apparent reading the literature on this is that the Supreme Court is making these decisions basically on an intuitive basis,” said Jeff Suzuki, a mathematician at Brooklyn College in New York. “It’s their sense of how big a jury should be to ensure proper deliberation.”

At a mathematics conference earlier this year, Suzuki presented research comparing the likelihood of conviction of a hypothetical defendant with the same likelihood of guilt but different jury conditions.

Building on a well-established line of research, which began with 18th-century French philosopher and mathematician Nicolas de Condorcet, mathematical analysis of juries has continued over the years, beginning from Condorcet’s idea that each juror has some probability of coming to the correct conclusion about the defendant’s guilt or innocence.

Suzuki used three different probabilities to calculate the likely decision of a jury, including the probability that the defendant is actually guilty, the probability that a juror will make the correct decision if the defendant is guilty, and the probability that a juror will make the correct decision if the defendant is not guilty

Suzuki’s model suggests that smaller juries are more likely than larger juries to convict when the defendant appears less certain to be guilty. All the juries he modeled are very likely to convict when the evidence suggests that a defendant is almost certainly guilty. But for slightly less certain cases, differences become clear.

If it appears that there’s an 80 percent likelihood that the defendant is guilty, then Suzuki’s model suggests that less than 10 percent of the time a 12-person jury would unanimously vote to convict, but a 6-person jury would unanimously vote to convict over 25 percent of the time — and a Louisiana-style jury that can convict with nine out of 12 votes would convict in roughly 60 percent of such trials.

Suzuki admits that the models may not be capturing the complete picture. Even if states that use fewer than 12 jurors had higher conviction rates than other states, that wouldn’t mean smaller juries convict greater numbers of innocent defendants, he said.

One potential problem with translating this research to real world trials is that it leaves out the interaction between jurors, which Suzuki admitted is a problem.

“We don’t have a good model for how jurors interact with each other,” he said. “The real challenge is that the data doesn’t really exist.”

In addition to the issue of juror interaction, the [Suzuki’s] models leave out other factors important to finding the correct verdict, such as the possibility that testimony or evidence could deceive the jury, said Bruce Spencer, a professor of statistics at Northwestern University in Evanston, Ill., who did not work with Suzuki.

“If the evidence is very misleading, it’s going to tend to mislead all of [the jurors],” said Spencer.

In a separate study, Spencer analysed surveys completed by judges just before juries delivered their verdict and compared what the judges thought to the juries’ decisions, finding that the verdicts agreed about 80 percent of the time. He found that in about one in every five trials in his study sample, the judge and the jury came to different conclusions.

Real data on the true guilt or innocence of a defendant on trial is simply not available. The jury’s decision is only half the story of a verdict’s accuracy. Many factors in jury decisions cannot be captured quantitatively.

“If you’re coming up with a measure of the speed of light or a standard kilogram, you like to have some assessment of uncertainty,” said Spencer. “I think it is difficult to assess the uncertainty of our estimates.”

Although Spencer knows either the judge or jury must have been wrong in the 20 percent of cases in his study when the two disagreed, there was not enough information to know which was correct in a given case. Using statistical modeling, he found that overall the judges and juries were about equally accurate, but cautioned about drawing conclusions based on the limited number of cases in his study.

Suzuki is trying to figure out more about verdict accuracy with his research. He said that he can build estimates of false conviction rates by counting how many verdicts are later overturned. The estimates are imperfect, he said, especially given that new technology such as DNA testing was not available when some of the original verdicts were given.

But Suzuki feels that his research can at least examine some of the important details of jury trials. Making better models helps to draw general conclusions, despite the uniqueness of each trial.

“You can use probabilistic methods to model human behaviour, provided that you understand what the statistics are and are not telling you, ”Said Suzuki.

For more such insights, log into our website https://international-maths-challenge.com

Credit of the article given to Chris Gorski, Inside Science News Service


On the hunt for mathematical beauty

Alexei Borodin

For anyone who has ever taken a commercial flight, it’s an all-too-familiar scene: Hundreds of passengers sit around waiting for boarding to begin, then rush to be at the front of the line as soon as it does.

Boarding an aircraft can be a frustrating experience, with passengers often wondering if they will ever make it to their seats. But Alexei Borodin, a professor of mathematics at MIT, can predict how long it will take for you to board an airplane, no matter how long the line. That’s because Borodin studies difficult probability problems, using sophisticated mathematical tools to extract precise information from seemingly random groups.

“Imagine an airplane in which each row has one seat, and there are 100 seats,” Borodin says. “People line up in random order to fill the plane, and each person has a carry-on suitcase in their hand, which it takes them one minute to put into the overhead compartment.”

If the passengers all board the plane in an orderly fashion, starting from the rear seats and working their way forwards, it would be a very quick process, Borodin says. But in reality, people queue up in a random order, significantly slowing things down.

So how long would it take to board the aircraft? “It’s not an easy problem to solve, but it is possible,” Borodin says. “It turns out that it is approximately equal to twice the square root of the number of people in the queue.” So with a 100-seat airplane, boarding would take 20 minutes, he says.

Borodin says he has enjoyed solving these kinds of tricky problems since he was a child growing up in the former Soviet Union. Born in the industrial city of Donetsk in eastern Ukraine, Borodin regularly took part in mathematical Olympiads in his home state. Held all over the world, these Olympiads set unusual problems for children to solve, requiring them to come up with imaginative solutions while working against the clock.

It is perhaps no surprise that Borodin had an interest in math from an early age: His father, Mikhail Borodin, is a professor of mathematics at Donetsk State University. “He was heavily involved in research while I was growing up,” Borodin says. “I guess children always look up to their parents, and it gave me an understanding that mathematics could be an occupation.”

In 1992, Borodin moved to Russia to study at Moscow State University. The dissolution of the USSR meant that, arriving in Moscow, Borodin found himself faced with a choice of whether to take Ukrainian citizenship, like his parents back in Donetsk, or Russian. It was a difficult decision, but for practical reasons Borodin opted for Russian citizenship.

Times were tough while Borodin was studying in Moscow. Politically there was a great deal of unrest in the city, including a coup attempt in 1993. Many scientists began leaving Russia, in search of a more stable life elsewhere.

Financially things were not easy for Borodin either, as he had just $15 each month to spend on food and accommodation. “But I still remember the times fondly,” he says. “I didn’t pay much attention to politics at the time, I was working too hard. And I had my friends, and my $15 per month to live on.”

After Borodin graduated from Moscow State University in 1997, a former adviser who had moved to the United States invited Borodin over to join him. So he began splitting his time between Moscow and Philadelphia, where he studied for his PhD at the University of Pennsylvania.

He then spent seven years at the California Institute of Technology before moving to MIT in 2010, where he has continued his research into probabilities in large random objects.

Borodin says there are no big mathematical problems he is desperate to solve. Instead, his greatest motivation is the pursuit of what he calls the beauty of the subject. While it may seem strange to talk about finding beauty in abstract mathematical constructions, many mathematicians view their work as an artistic endeavor.

“If one asks 100 mathematicians to describe this beauty, one is likely to get 100 different answers,” he says.

And yet all mathematicians tend to agree that something is beautiful when they see it, he adds, saying, “It is this search for new instances of mathematical beauty that largely drives my research.”

For more such insights, log into our website https://international-maths-challenge.com

Credit of the article given to Helen Knight, Massachusetts Institute of Technology


Mathematical methods help predict movement of oil and ash following environmental disasters

When oil started gushing into the Gulf of Mexico in late April 2010, friends asked George Haller whether he was tracking its movement. That’s because the McGill engineering professor has been working for years on ways to better understand patterns in the seemingly chaotic motion of oceans and air. Meanwhile, colleagues of Josefina Olascoaga in Miami were asking the geophysicist a similar question. Fortunately, she was.

For those involved in managing the fallout from environmental disasters like the Deepwater Horizon oil spill, it is essential to have tools that predict how the oil will move, so that they make the best possible use of resources to control the spill. Thanks to work done by Haller and Olascoaga, such tools now appear to be within reach. Olascoaga’s computational techniques and Haller’s theory for predicting the movement of oil in water are equally applicable to the spread of ash in the air, following a volcanic explosion.

“In complex systems such as oceans and the atmosphere, there are a lot of features that we can’t understand offhand,” Haller explains. “People used to attribute these to randomness or chaos. But it turns out, when you look at data sets, you can find hidden patterns in the way that the air and water move.” Over the past decade, the team has developed mathematical methods to describe these hidden structures that are now broadly called Lagrangian Coherent Structures (LCSs), after the French mathematician Joseph-Louis Lagrange.

“Everyone knows about the Gulf Stream, and about the winds that blow from the West to the East in Canada,” says Haller, “but within these larger movements of air or water, there are intriguing local patterns that guide individual particle motion.” Olascoaga adds, “Though invisible, if you can imagine standing in a lake or ocean with one foot in warm water and the other in the colder water right beside it, then you have experienced an LCS running somewhere between your feet.”

“Ocean flow is like a busy city with a network of roads,” Haller says, “except that roads in the ocean are invisible, in motion, and transient.” The method Haller and Olascoaga have developed allows them to detect the cores of LCSs. In the complex network of ocean flows, these are the equivalent of “traffic intersections” and they are crucial to understanding how the oil in a spill will move. These intersections unite incoming flow from opposite directions and eject the resulting mass of water. When such an LCS core emerges and builds momentum inside the spill, we know that oil is bound to seep out within the next four to six days. This means that the researchers are now able to forecast dramatic changes in pollution patterns that have previously been considered unpredictable.

So, although Haller wasn’t tracking the spread of oil during the Deepwater Horizon disaster, he and Olascoaga were able to join forces to develop a method that does not simply track: it actually forecasts major changes in the way that oil spills will move. The two researchers are confident that this new mathematical method will help those engaged in trying to control pollution make well-informed decisions about what to do.

For more such insights, log into our website https://international-maths-challenge.com

Credit of the article given to University of Miami


Making sports statistics more scientific

Whether it is the sprinter who finished first or the team that scored more points, it’s usually easy to determine who won a sporting event. But finding the statistics that explain why an athlete or team wins is more difficult — and major figures at the intersection of sports and numbers are determined to crack this problem.

Many statistics explain part of the picture, especially in team sports, such as the number of points scored by a point guard, a quarterback’s passing yards, or a slugger’s batting average. But many of these numbers — some of them sacred among sports fans — don’t directly address a player’s contribution to winning. This was a primary topic of discussion last weekend at the Sloan Sports Analytics Conference in Boston.

Organised by students from the MIT Sloan School of Management and sponsored by several sports-related companies, including media outlet ESPN, the conference brought together over 2,200 people to discuss player evaluation and other factors important to the business of sports.

Many of the research presentations and panel discussions described efforts to remove subjective judgments from sports statistics — and how to define new statistics more directly explain a player’s value.

“We have huge piles of statistics now,” said Bill James, Boston Red Sox official and baseball statistics pioneer, at a panel discussion about adding modern statistics to box scores. “What you have to do is reduce it to significant but small concepts,” said James.

New technology and analysis is only now making it possible to learn more about many fundamental events in several sports, which are not often addressed by traditional sports statistics.

“We’re going to talk about stats that work and stats that don’t work,” said John Walsh, executive vice president of ESPN, who moderated the box score panel discussion.

The panel, which also included three other experts, cited several examples of statistics that didn’t work: a receiver might drop a pass for one of several reasons — but rarely are drops broken down into categories; an assist in basketball is a judgment call with room for different interpretations; and fielding percentage in baseball only generally describes a defensive player’s ability.

In another session, Greg Moore, the director of baseball products for the sports graphics and visualization company Sportvision, described recent data-collection advances in baseball. When all the company’s systems are fully deployed in Major League Baseball stadiums, they plan to track the trajectory of each pitch thrown, the movement of all the players on the field and the speed of every swing and hit ball. Their systems, already fully installed in some ballparks, will collect over a million data points at every game. Some of this data is publicly available.

The data will make it possible to say not just that a player hit a double or that he hit a hard line drive, but that the ball left the bat at a certain speed and launch angle and a certain number of degrees from the foul line. No scout or official scorer can contaminate those kinds of measures with subjectivity. On the other hand, a string of objective data is not inherently more useful than a flawed statistic, which may contain useful wisdom.

During the box-score panel discussion, Dean Oliver, ESPN’s sports analytics director, said that collecting information this way opens a new frontier.

“It’s an immense amount of data, but you have to know what to do with it,” said Oliver.

The winner of the conference’s research paper competition found one way to make new data useful. Using SportVU, a basketball database collected by the company STATS, a team from the University of Southern California’s computer science department studied rebounding a basketball from its absolute first concepts. The data shows the movement of all the players and the ball, including rebounds, passes and other game events.

The research team showed empirically what was only previously accessible from inference and experience. They were able to show that by the time almost all rebounds travel 14 feet from the hoop they also drop below eight feet of elevation — easy reaching distance for a basketball player. The researchers were able to compare shot distance with rebound distance and to show where strategic changes might change offensive rebounding success.

Rajiv Maheswaran, the researcher who presented the paper, compared the effort to find new insights about sports to astronomy. Once you start looking at the stars, he said, you make discoveries, which lead to new hypotheses and more research.

For more such insights, log into our website https://international-maths-challenge.com

Credit of the article to Chris Gorski, Inside Science News Service


Flight of the bumblebee decoded by mathematicians

© Dr Tom Ings

Bumblebees use complex flying patterns to avoid predators according to new research from Queen Mary, University of London.

Writing in the journal Physical Review Letters, Dr Rainer Klages from Queen Mary’s School of Mathematical Sciences, Professor Lars Chittka from the School of Biological and Chemical Sciences, and their teams, describe how they carried out a statistical analysis of the velocities of foraging bumblebees. They found that bumblebees respond to the presence of predators in a much more intricate way than was previously thought.

Bumblebees visit flowers to collect nectar, often visiting multiple flowers in a single patch. There is an ongoing debate as to whether they employ an ‘optimal foraging strategy’, and what such a theory may look like.

Dr Klages explains: “In mathematical theory we treat a bumblebee as a randomly moving object hitting randomly distributed targets. However, bumblebees in the wild are under the constant risk of predators, such as spiders, so the question we wanted to answer is how such a threat might modify their foraging behaviour.”

The team used experiments that track real bumblebees visiting replenishing nectar sources under threat from artificial spiders, which can be simulated with a trapping mechanism that grabs the bumblebee for two seconds.

They found that, in the absence of the spiders, the bumblebees foraged more systematically and travelled directly from flower to flower. When predators were present, however, the bumblebees turned around more often highlighting a more careful approach to avoid the spiders.

PhD student Friedrich Lenz, who did the key analysis, explains: “We learned that the bumblebees display the same statistics of velocities irrespective of whether predators are present or not. Surprisingly, however, the way the velocities change with time during a flight is characteristically different under predation threat.”

The team’s analysis indicates that, when foraging in the wild, factors such as bumblebee sensory perception, memory, and even the individuality of different bumblebees should be taken into account in addition to the presence of predators. All of this may cause deviations from predictions of more simplistic foraging theories.

For more such insights, log into our website https://international-maths-challenge.com

Credit of the article given to Queen Mary, University of London


Researchers create first large-scale model of human mobility that incorporates human nature

For more than half a century, many social scientists and urban geographers interested in modeling the movement of people and goods between cities, states or countries have relied on a statistical formula called the gravity law, which measures the “attraction” between two places. Introduced in its contemporary form by linguist George Zipf in 1946, the law is based on the assumption that the number of trips between two cities is dependent on population size and the distance between the cities. (The name comes from an analogy with Newton’s Law of Gravity, which describes the attraction of two objects based on mass and distance.)

Though widely used in empirical studies, the gravity model isn’t very accurate in making predictions. Researchers must retrofit data to the model by including variables specific to each study in order to force the results to match reality. And with much more data now being generated by new technologies such as cellphones and the Internet, researchers in many fields are eyeing the study of human mobility with a desire to increase its scientific rigor.

To this end, researchers from MIT, Northeastern University and Italy’s University of Padua have identified an underlying flaw in the gravity model: The distance between two cities is far less important than the population size in the area surrounding them. The team has now created a model that considers human motives rather than simply assuming that a larger city attracts commuters. They then tested their “radiation model” on five types of mobility studies and compared the results to existing data. In each case, the radiation model’s predictions were far more accurate than the gravity model’s, which are sometimes off by an order of magnitude.

“Using a multidisciplinary approach, we came up with a simple formula that works better in all situations and shows that population distribution is the key factor in determining mobility fluxes, not distance,” says Marta González, the Gilbert Winslow Career Development Assistant Professor in MIT’s Department of Civil and Environmental Engineering and Engineering Systems Division, and co-author of a paper published Feb. 26 in the online edition of Nature. “I wanted to see if we could find a way to make the gravity model work more accurately without having to change it to fit each situation.”

Physics professor Albert-László Barabási of Northeastern is lead author and principal investigator on the project. Filippo Simini of Northeastern and Amos Maritan of the University of Padua are co-authors.

“I think this paper is a major advance in our understanding of human behaviour,” says Dirk Brockmann, an associate professor of engineering sciences and applied mathematics at Northwestern University who was not involved in the research project. “The key value of the work is that they propose a real theory of mobility making a few basic assumptions, and this model is surprisingly consistent with empirical data.”

The gravity law states that the number of people in a city who will commute to a larger city is based on the population of the larger city. (The larger the population of the big city, the more trips the model predicts.) The number of trips will decrease as the distance between cities grows. One obvious problem with this model is that it will predict trips to a large city without taking into account that the population size of the smaller city places a finite limit on how many people can possibly travel.

The radiation model accounts for this and other limitations of the gravity model by focusing on the population of the surrounding area, which is defined by the circle whose center is the point of origin and whose radius is the distance to the point of attraction, usually a job. It assumes that job availability is proportional to the population size of the entire area and rates a potential job’s attractiveness based on population density and travel distance. (People are willing to accept longer commutes in sparsely populated areas that have fewer job opportunities.)

To demonstrate the radiation model’s accuracy in predicting the number of commuters, the researchers selected two pairs of counties in Utah and Alabama — each with a set of cities with comparable population sizes and distances between them. In this instance, the gravity model predicts that one person will commute between each set of cities. But according to census data, 44 people commuted in Utah and six in the sparsely populated area of Alabama. The radiation model predicts 66 commuters in Utah and two in Alabama, a result well within the acceptable limit of statistical error, González says.

The co-authors also tested the model on other indices of connectedness, including hourly trips measured by phone data, commuting between U.S. counties, migration between U.S. cities, intercity telephone calls made by 10 million anonymous users in a European country, and the shipment of goods by any mode of transportation among U.S. states and major metropolitan areas. In all cases, the model’s results matched existing data.

“What differentiates the radiation model from other phenomenological models is that Simini et al. assume that an individual’s migration or move to a new location is determined by what ‘is offered’ at the location — e.g., job opportunities — and that this employment potential is a function of the size of a location,” Brockmann says. “Unlike the gravity model and other models of the same nature, the radiation model is thus based on a plausible human motive. Gravity models just assume that people move to large cities with high probability and that also this movement probability decreases with distance; they are not based on an underlying first principle.”

For more such insights, log into our website https://international-maths-challenge.com

Credit of the article given to Denise Brehm, Massachusetts Institute of Technology