Facebook’s AI Mathematician Can Solve University Calculus Problems

Machines are getting better at maths – artificial intelligence has learned to solve university-level calculus problems in seconds.

François Charton and Guillaume Lample at Facebook AI Research trained an AI on tens of millions of calculus problems randomly generated by a computer. The problems were mathematical expressions that involved integration, a common technique in calculus for finding the area under a curve.

To find solutions, the AI used natural language processing (NLP), a computational tool commonly used to analyse language. This works because the mathematics in each problem can be thought of as a sentence, with variables, normally denoted x, playing the role of nouns and operations, such as finding the square root, playing the role of verbs. The AI then “translates” the problem into a solution.

When the pair tested the AI on 500 calculus problems, it found a solution with an accuracy of 98 per cent. A comparable standard program for solving maths problems had only an accuracy of 85 per cent on the same problems.

The team also gave the AI differential equations to solve, which are other equations that require integration to solve as well as other techniques. For these equations, the AI wasn’t quite as good, solving them correctly 81 per cent for one type of differential equation and 40 per cent on a harder type.

Despite this, it could still correctly answer questions that confounded other maths programs.

Doing calculus on a computer isn’t especially useful in practice, but with further training AI might one day be able to tackle maths problems that are too hard for humans to crack, says Charton.

The efficiency of the AI could save humans time in other mathematical tasks, for example, when proving theorems, says Nikos Aletras at the University of Sheffield, UK.

For more such insights, log into www.international-maths-challenge.com.

*Credit for article given to Gege Li*


The Whole is Equivalent to Some of Its Parts

The whole is equivalent to the sum of its parts

Which is bigger, 10 or 7?

I suspect that for most, the response to this question is instinctive, unconscious, and immediate. So how about I pose a follow-up question:

How do you know?

If you can refrain from dismissing this question as trivial, I invite you to pause and try to reflect on what happened in your mind in that instant – is this factual recall, was there something visual, was it something contextual, or was it something else?

Perhaps you will indulge me and delve a little deeper:

In how many ways do you know?

Here again, I invite you to pause and consider your response before continuing. Maybe you would like to imagine that you are trying to convince someone or different people. Pick up a piece of paper and draw pictures, write things down, and try to form another approach that is different in some way from the others.

When we compare numerical values, there are many helpful approaches that we can take. These might be based on processes such as: counting, “1, 2, 3, 4, 5, 6, 7, 8, 9, 10. I said 7 first so it must be smaller (that’s how numbers work!)”; motion/movement, “If we start together at the bottom, then I climb 7 stairs and you climb 10 stairs, you will be higher than me (and more tired!)”; measurement/length, “This length (7cm) is shorter than this length (10cm)”; matching/creating correspondences, “There are 10 people and 7 cupcakes if I hand out a cupcake to each person I will run out – not everyone will get one!”

Each of these approaches (and the many more you might imagine) might be grounded in two prominent types of reasoning: part-whole and/or correspondence. These two ideas are used pervasively, interchangeably, and often simultaneously when reasoning with numbers in most of school mathematics and in our daily experiences.

Part-whole

Let’s take another comparison problem, this time inspired by questions posed to children in a study by Falk (2010):

What are there more of:

  1. Hairs on your head OR fingers on two hands?
  2. Fingers on two hands OR days in a month?
  3. Grains of sand on Earth OR hairs on your head?
  4. All numbers OR grains of sand on Earth?

This time, I suspect, your responses were not always instantaneous and more conscious thought was required. How convinced are you of your responses? Did you feel as though more information was required?

When you reflect on the reasoning you employed in making these comparisons, I wonder whether you assigned numerical values to the quantities – did you feel an urge to do so, as a first step, before applying similar techniques to those used before?

When the children in this study were faced with such comparisons, an interesting misconception revealed itself: many of them considered a very large number, for instance, the number of grains of sand on Earth, to be synonymous with infinity. This, of course, presents a potential difficulty with question 4; I suspect you won’t be alone if you encounter this, too.

When we encounter numbers or quantities that are so large/vast that they are beyond our comprehension, it is perhaps unsurprising that we equate these with infinity – that magical word that creeps into our consciousness from a very young age as the default answer to any questions about “biggest number.” So, is this a problematic concept to hold? In practical terms, for most people, probably not. But mathematically it is, and actually confronting it offers some wonderful opportunities to explore, discuss and better understand the numbers that we work with, the structure of mathematical systems, and the nature of the mathematics that we study.

So how could we confront this misconception? How can we take advantage of the opportunities alluded to above? Well, one possibility is purposefully to create situations where the misconception might arise.

Position the quantities representing the grains of sand on Earth and all numbers on a number line.

  • Would they be in the same place, or would one be closer to zero than the other?
  • If they are not in the same place, are they very close together or very far apart?
  • Is it possible to measure the gap between these two quantities?

Talking around this task is likely to draw attention to the fact that some quantities may be large and unknown, but we can be certain they are finite – a single number exists to represent them, we just don’t know what it is. Others, however, are large, unknown, and also not finite – they are not represented by a single large number but are unbounded, often the result of an infinite process such as counting. These infinite quantities cannot be positioned on a number line, and the gap (the difference) between any finite quantity and an infinite one is immeasurable – it is infinitely large in itself!

So, is it possible to make comparisons with infinite quantities? Or is this “not allowed?!” Well, we can certainly say that any finite quantity is smaller than any infinite quantity. But how about this:

What are there more of: natural numbers or even numbers?

I would encourage you, once again, to establish and hold your own response to this question in your mind before reading on.

As at the beginning of this blog, the follow-up question is:

How do you know?

Intuition tends to be strong here, grounded in our experiences with finite quantities and part-whole reasoning: the even numbers are a part of the natural numbers so there must be more natural numbers (twice as many, we might argue). We can confirm this with examples; for instance, by comparing the number of natural numbers and even numbers there are up to a fixed point, say 100:

Now, what if I asked you to find an alternative approach, another way of explaining how you know that there are more natural numbers than even numbers? When we compared 7 and 10, we discussed two main approaches, those based on part-whole reasoning and those based on matching / correspondences. What would a correspondence approach look like here?

It looks as though I can pair up the two sets of numbers, I can match every natural number, one-to-one, with an even number, so the two sets are equal… Uh oh! And, more than that, our two methods of comparison, which are usually used interchangeably, lead to different results!

How do you feel about this seemingly contradictory situation? Maybe this example is something you are comfortable with, but most likely not! For many students, and indeed teachers, this is a troubling situation, causing us to throw up our hands in despair and confusion! However, if we can overcome this sensation and recognise that the conflict is real (it’s not that we’ve made an error), then the stage is set for thinking more carefully about assumptions that might have been made and when and where our mathematical rules and procedures are used and valid. Giving students similar opportunities to encounter situations where their intuition is called into question, inviting them to discuss (and argue!), expose their own lines of reasoning, and compare contexts and situations in the search for an explanation, is surely a good thing! Perhaps, when prompted in this way they might also be more receptive to the introduction of standard, accepted approaches within mathematics.

As a closing comment, let’s notice that our discussions are touching on the most fundamental property of any infinite set: that it can be matched, one-to-one, with a proper subset of itself. In other words, in the case of infinite sets, the whole is equivalent to some of its parts!

For more insights like this, visit our website at www.international-maths-challenge.com.

Credit for the article given to Tabitha Gould


AI is Helping Tackle One of The Biggest Unsolved Problems In Maths

AI can search through numbers and equations to find patterns

Artificial intelligence’s ability to sift through large amounts of data is helping us tackle one of the most difficult unsolved problems in mathematics.

Yang-Hui He at City, University of London, and his colleagues are using the help of machine learning to better understand the Birch and Swinnerton-Dyer conjecture. This is one of the seven fiendishly difficult Millennium Prize Problems, each of which has a $1 million reward on offer for the first correct solution.

The conjecture describes solutions to equations known as elliptic curves, equations in the form of y2 = x3 + ax + b, where x and y are variables and a and b are fixed constants.

Elliptic curves were essential in cracking the long-standing Fermat’s last theorem, which was solved by mathematician Andrew Wiles in the 1990s, and are also used in cryptography.

To study the behaviour of elliptic curves, mathematicians also use an equation called the L-series. The conjecture, first stated by mathematicians Bryan Birch and Peter Swinnerton-Dyer in the 1960s, says that if an elliptic curve has an infinite number of solutions, its L-series should equal 0 at certain points.

“It turns out to be a very, very difficult problem to find a set of integer solutions on such equations,” says He, meaning solutions only involving whole numbers. “This is part of the biggest problem in number theory: how do you find integer solutions to polynomials?”

Finding integer solutions or showing that they cannot exist has been crucial. “For example, Fermat’s last theorem is reduced completely to the statement of whether you can find certain properties of elliptic curves,” says He.

He and his colleagues used an AI to analyse close to 2.5 million elliptic curves that had been compiled in a database by John Cremona at the University of Warwick, UK. The rationale was to search the equations to see if any statistical patterns emerged.

Plugging different values into the elliptic curve equation and plotting the results on a graph, the team found that the distribution takes the shape of a cross, which mathematicians hadn’t previously observed. “The distribution of elliptic curves seems to be symmetric from left to right, and up and down,” says He.

“If you spot any interesting patterns, then you can raise a conjecture which may later lead to an important result,” says He.  “We now have a new, really powerful thing, which is machine learning and AI, to do this.”

To see whether a theoretical explanation exists for the cross-shaped distribution, He consulted number theorists. “Apparently, nobody knows,” says He.

“Machine learning hasn’t yet been applied very much to problems in pure maths,” says Andrew Booker at the University of Bristol, UK. “Elliptic curves are a natural place to start.”

“Birch and Swinnerton-Dyer made their conjecture based on patterns that they observed in numerical data in the 1960s, and I could imagine applications of machine learning that tried to detect those patterns efficiently,” says Booker, but the approach so far is too simple to turn up any deep patterns, he says.

For more such insights, log into www.international-maths-challenge.com.

*Credit for article given to Donna Lu*


Mathematicians Find a Completely New Way to Write The Number 3

Third time’s a charm: just weeks after cracking an elusive problem involving the number 42, mathematicians have found a solution to an even harder problem for the number 3.

Andrew Booker at Bristol University, UK, and Andrew Sutherland at the Massachusetts Institute of Technology have found a big solution to a maths problem known as the sum of three cubes.

The problem asks whether any integer, or whole number, can be represented as the sum of three cubed numbers.

There were already two known solutions for the number 3, both of which involve small numbers: 13 + 13 + 1and 43 + 43 + (-5)3.

But mathematicians have been searching for a third for decades. The solution that Booker and Sutherland found is:

5699368212219623807203 + (-569936821113563493509) 3 + (-472715493453327032) 3 = 3

Earlier this month, the pair also found a solution to the same problem for 42, which was the last remaining unsolved number less than 100.

To find these solutions, Booker and Sutherland worked with software firm Charity Engine to run an algorithm across the idle computers of half a million volunteers.

For the number 3, the amount of processing time was equivalent to a single computer processor running continuously for 4 million hours, or more than 456 years.

When a number can be expressed as the sum of three cubes, there are infinitely many possible solutions, says Booker. “So there should be infinitely many solutions for three, and we’ve just found the third one,” he says.

There’s a reason the third solution for 3 was so hard to find. “If you look at just the solutions for any one number, they look random,” he says. “We think that if you could get your hands on loads and loads of solutions – of course, that’s not possible, just because the numbers get so huge so quickly – but if you could, there’s kind of a general trend to them: that the digit sizes are growing roughly linearly with the number of solutions you find.”

It turns out that this rate of growth is extremely small for the number 3 – only 114, now the smallest unsolved number, has a smaller rate of growth. In other words, numbers with a slow rate of growth have fewer solutions with a lower number of digits.

The duo also found a solution to the problem for 906. We know for sure that certain numbers, such as 4, 5 and 13, can’t be expressed as the sum of three cubes. There now remain nine unsolved numbers under 1000. Mathematicians think these can be written as the sum of three cubes, but we don’t yet know how.

For more such insights, log into www.international-maths-challenge.com.

*Credit for article given to Donna Lu*


Mathematicians Crack Elusive Puzzle Involving The Number 42

Can three cubed numbers be added up to give 42? Until now, we didn’t know

It might not tell us the meaning of life, the universe, and everything, but mathematicians have cracked an elusive problem involving the number 42.

Since the 1950s, mathematicians have been puzzling over whether any integer – or whole number – can be represented as the sum of three cubed numbers.

Put another way: are there integers k, x, y and z such that k = x3 + y3 + z3 for each possible value of k?

Andrew Booker at Bristol University, UK, and Andrew Sutherland at the Massachusetts Institute of Technology, US, have solved the problem for the number 42, the only number less than 100 for which a solution had not been found.

Some numbers have simple solutions. The number 3, for example, can be expressed as 1+ 1+ 1and 4+ 4+ (-5) 3 . But solving the problem for other numbers requires vast strings of digits and, correspondingly, computing power.

The solution for 42, which Booker and Sutherland found using an algorithm, is:

42 = (-80538738812075974)3 + 804357581458175153 + 126021232973356313

They worked with software firm Charity Engine to run the program across more than 400,000 volunteers’ idle computers, using computing power that would otherwise be wasted. The amount of processing time is equivalent to a single computer processor running continuously for more than 50 years, says Sutherland.

Earlier this year, Booker found a sum of cubes for the number 33, which was previously the lowest unsolved example.

We know for certain that some numbers, such as 4, 5 and 13, can’t be expressed as the sum of three cubes.

The problem is still unsolved for 10 numbers less than 1000, the smallest of which is 114.

The team will next search for another solution to the number 3.

“It’s possible we’ll find it in the next few months; it’s possible it won’t be for another hundred years,” says Booker.

People interested in aiding the search can can volunteer computing power through Charity Engine, says Sutherland.

For more such insights, log into www.international-maths-challenge.com.

*Credit for article given to Donna Lu*


Purposeful Planning

Planning is a key ingredient for effective teaching. But why is it so important? What is ‘good’ planning? How do we make our planning purposeful and focused? Let’s delve further into planning, and what it encompasses.

Curriculum is central to planning. It guides what we teach. The other crucial factor is to know the needs of your students. Effective planning begins with finding where these two elements meet.

The Purposeful planning podcast has been developed to complement the Explicit Teaching in Maths professional learning modules. In this podcast, Dr Emily Ross from The University of Queensland uses the analogy of planning being like a road trip. Dr Ross explains that the curriculum (the knowledge and skills taught) is the destination of this road trip. It’s where you want your students to get to by the end of the lesson or topic.

The road trip itself includes the places you see and the stops on the way to your destination, and this is likened to the teaching and learning. It’s the steps in the lesson or unit plan that enable your students to reach their destination.

Using this road trip analogy, we can ask ourselves two big questions in terms of planning: where are we going? and how will we get there?

Let’s breakdown this analogy further.

  • Some people like to be very well planned and outline the detailed steps required to reach the destination.
  • Some people like to make a more general plan and they outline the main signposts required to travel past to get to the destination.
  • Sometimes you may need to take some detours along the way depending on the needs of your learners. Listen to your learners: Are you moving too slowly? Are you going too fast? Or are you on the wrong road?There are different ways of getting to your end destination, and understanding your students and their needs will determine the path you take.

The process of planning

Planning involves interpreting the curriculum and working out how we can support our students to learn knowledge and develop skills. So, what might ‘good’ planning look like?

Start with the learner

What do your students know about the topic? What prior knowledge do they have? This isn’t always straightforward as students in your class will bring a range of skills and knowledge to each topic, and your planning needs to reflect this.

The curriculum

Use your curriculum knowledge and understandings and know exactly what you want your students to achieve.

The steps

Break the learning into small steps. Think about the chunks of knowledge and skills the students need to learn and build upon this throughout the lesson and topic.

Learning sequences

Build authentic teaching and learning sequences to support students to learn knowledge, develop skills, and understand and apply concepts.

Learning intentions and success criteria

Planning is enhanced by including purposeful learning intentions and success criteria.

A learning intention states the goal of the lesson. What will you learn?  The success criteria outlines how the students will know they have succeeded. How do you know you have learnt it? How do you know you can now do it?

Learning intention (LI) and success criteria (SC) checklist

  • Sharethe LI and SC with your students.
  • Make the LI and SC explicitso that students know exactly what is expected.
  • Make the LI challenging,but not too difficult. Students need to be learning new knowledge and skills, and experience success in doing so.
  • Make the SC measurableso students can easily see if they have been successful or not.
  • Provide feedbackto students throughout the lesson, so they know what to do next to achieve the learning intention.

Good planning is essential for quality maths teaching and learning. If you’d like to know more about planning:

  • sign-up to The Maths in schools: Explicit teaching in Maths learning modules. This self-paced, professional leaning course offers five modules that are designed around the seven components of explicit teaching. The modules are aligned to the Australian Institute and School Leadership (ASITSL) professional standards, and they include lessons and activities you can use to teach maths concepts from the Australian Curriculum.
  • listen to the Maths hub podcast, Episode 1: Purposeful planning. This engaging and informative podcast is hosted by Allan Dougan, the CEO of the Australian Association of Mathematics Teachers (AAMT). Allan chats to expert Dr Emily Ross about planning. The podcast provides practical ideas you can readily use as you plan your maths lessons. A highlight is the discussion on how to incorporate learning intentions and success criteria in creative and flexible ways.
  • watch the Explicit teaching in mathematics: purposeful planning webinar. Associate Professor Helen Chick, University of Tasmania, discusses purposeful planning when thinking through and constructing maths lessons using the explicit teaching model and how careful planning of lessons is just as important as teaching the lesson and can enable explicit teaching to be successful.

For more such insights, log into our website https://international-maths-challenge.com

Credit of the article given to The Mathematics Hub


Math Anxiety in Students With and Without Math Learning Difficulties

The importance of mathematics in daily and professional life has been increasing with the contribution of developing technology. The level of mathematical knowledge and skills directly influence the quality standards of our individual and social life. However, mathematics the importance of which we feel in every aspect of our life is unfortunately not learned enough by many individuals for many reasons. The leading reasons regarding this issue are as follows: the abstract and hierarchical structure of mathematics, methods and strategies in learning mathematics, and the learning difficulties in mathematics. Developmental Dyscalculia (DD)/Mathematics Learning Difficulty (MLD) is a brain-based condition that negatively affects mathematics acquisition.

The mathematical performance of a student with MLD is much lower than expected for age, intelligence, and education, although there are no conditions such as intellectual disability, emotional disturbances, cultural deprivation, or lack of education. Difficulties in mathematics result from a number of cognitive and emotional factors. Math anxiety is one of the emotional factors that may severely disrupt a significant number of children and adults in learning and achievement in math.

Math anxiety is defined as “the feelings of tension and anxiety that interfere with the manipulation of numbers and the solving of mathematical problems in a wide variety of ordinary life and academic situations”. Sherard describes math anxiety as the fear of math or an intense and negative emotional response to mathematics. There are many reasons for the cause of the math anxiety. These include lack of the appropriate mathematical background of the students, study habits of memorizing formulas, problems and applications that are not related to real life, challenging and time-limited exams, lack of concrete materials, the difficulty of some subjects in mathematics, type of personality, negative approach on mathematics, lack of confidence, the approaches, feelings, and thoughts of teachers and parents on mathematics.

The negative relationship between math anxiety and math performance is an international issue. The PISA (Programme for International Student Assessment) statistics measuring a wide variety of countries and cultures depict that the high level of negative correlation between math anxiety and mathematical performance is remarkable. Some studies showed that highly math-anxious individuals are worse than those with low mathematics anxiety in terms of solving mathematical problems. These differences are not typically observed in simple arithmetic operations such as 7 + 9 and 6 × 8, but it is more evident when more difficult arithmetic problems are tested.

Math anxiety is associated with cognitive information processing resources during arithmetic task performance in a developing brain. It is generally accepted that math anxiety negatively affects mathematical performance by distorting sources of working memory. The working memory is conceptualized as a limited source of cognitive systems responsible for the temporary storage and processing of information in momentary awareness.

The learning difficulties in mathematics relate to deficiencies in the central executive component of the working memory. Many studies suggest that individuals with learning difficulties in mathematics have a lack of working memory. It is stated that students with learning difficulties in mathematics use more inferior strategies than their peers for solving basic (4 + 3) and complex (16 + 8) addition and fall two years behind their peers while they fall a year behind in their peers’ working memory capacities.

Highly math-anxious individuals showed smaller working memory spans, especially when evaluated with a computationally based task. This reduced working memory capacity, when implemented simultaneously with a memory load task, resulting in a significant increase in the reaction time and errors. A number of studies showed that working memory capacity is a robust predictor of arithmetic problem-solving and solution strategies.

Although it is not clear to what extent math anxiety affects mathematical difficulties and how much of the experience of mathematical difficulties causes mathematical anxiety, there is considerable evidence that math anxiety affects mathematical performance that requires working memory. Figure below depicts these reciprocal relationships among math anxiety, poor math performance, and lack of working memory. The findings of the studies mentioned above, make it possible to draw this figure.

Basic numerical and mathematical skills have been crucial predictors of an individual’s vital success. When anxiety is controlled, it is seen that the mathematical performance of the students increases significantly. Hence, early identification and treatment of math anxiety is of importance. Otherwise, early anxieties can have a snowball effect and eventually lead students to avoid mathematics courses and career options for math majors. Although many studies confirm that math anxiety is present at high levels in primary school children, it is seen that the studies conducted at this level are relatively less when the literature on math anxiety is examined. In this context, this study aims to determine the dimensions of the relationship between math anxiety and mathematics achievement of third graders by their mathematics achievement levels.

Methods

The study was conducted by descriptive method. The purpose of the descriptive method is to reveal an existing situation as it is. This study aims to examine the relationship between math anxiety and mathematics achievement of third graders in primary school in terms of student achievement levels.

Participants

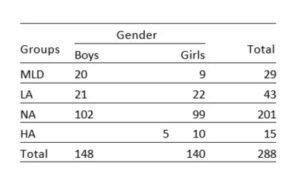
Researchers of mathematics learning difficulties (MLD) commonly use cutoff scores to determine which participants have MLD. These cutoff scores vary between -2 ss and -0.68 ss. Some researchers apply more restrictive cutoffs than others (e.g., performance below the 10th percentile or below the 35th percentile). The present study adopted the math achievement test to determine children with MLD based below the 10th percentile. The unit of analysis was third graders of an elementary school located in a low socioeconomic area. The study reached 288 students using math anxiety scale and math achievement test tools. The students were classified into four groups by their mathematics achievement test scores: math learning difficulties (0-10%), low achievers (11-25%), normal achievers (26-95%), and high achievers (96-100%).

Table 1. Distribution of participants by gender and groups

Data Collection Tools

Two copyrighted survey scales, consisting of 29 items were used to construct a survey questionnaire. The first scale is the Math Anxiety Scale developed by Mutlu & Söylemez for 3rd and 4th graders with a 3-factor structure of 13 items. The Cronbach’s Alpha coefficient is adopted by the study to evaluate the extent to which a measurement produces reliable results at different times. The Cronbach Alpha coefficient of the scale is .75 which confirms the reliability of and internal consistency of the study. The response set was designed in accordance with the three- point Likert scale with agree, neutral, and disagree. Of the 13 items in the scale, 5 were positive and 8 were negative. Positive items were rated as 3-2-1, while negative items were rated as 1-2-3. The highest score on the scale was 39 and the lowest on the scale was 13.

The second data collection tool adopted by this study is the math achievement test for third graders developed by Fidan (2013). It has 16 items designed in accordance with the national math curriculum. Correct responses were scored one point while wrong responses were scored zero point.

Data Analysis

The study mainly utilized five statistical analyses which are descriptive analysis, independent samples t-test, Pearson product-moment correlation analysis, linear regression and ANOVA. First, an independent samples t-test was performed to determine whether there was a significant difference between the levels of math anxiety by gender. Then, a Pearson product-moment correlation analysis was performed to determine the relationship between the math anxiety and mathematics achievement of the students. After that, a linear regression analysis was performed to predict the mathematics achievement of the participants based on their math anxiety. Finally, an ANOVA was performed to determine if there was a significant difference between the math anxiety of the groups determined in terms of mathematics achievement.

Results

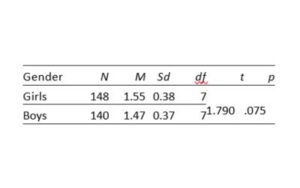
The findings of the math anxiety scores by gender of the study found no significant difference between the averages [t(286)= 1.790, p< .05]. This result shows that the math anxiety levels of girls and boys are close to each other. Since there is no difference between math anxiety scores by gender, the data in the study were combined.

Table 2. Comparison of anxiety scores by gender

There was a strong and negative correlation between math anxiety and mathematics achievement with the values of r= -0.597, n= 288, and p= .00. This result indicates that the highly math-anxious students and decreases in math anxiety were correlated with increases in rating of math achievement.

A simple linear regression was calculated to predict math achievement level based on the math anxiety. A significant regression equation was found (F(1,286)= 158.691, p< .000) with an R2 of .357. Participants’ predicted math achievement is equal to 20.153 + -6.611 when math anxiety is measured in unit. Math achievement decreased -6.611 for each unit of the math anxiety.

Figure below shows the relationship between the math anxiety of the children and their mathematics achievement on a group basis. Figure 1 provides us that there is a negative correlation between mathematical performance and math anxiety. The results depict that the HA group has the lowest math anxiety score, while the MLD group has the highest math anxiety.

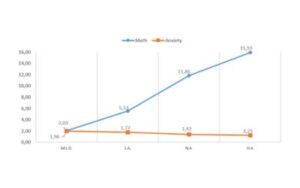
Table 3. Comparison of the mathematical anxiety scores of the groups

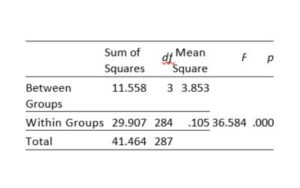
The table indicates that there is a statistically significant difference between groups as determined at the p<.05 level by one-way ANOVA (F(3,284)= 36.584, p= .000). Post hoc comparisons using the Tukey test indicated that the mean score for MLD group (M= 1.96, sd= 0.30) was significantly different than the NA group (M= 1.41, sd= 0.84) and HA group (M= 1.24, sd= 0.28). However, the MLD group (M= 1.96, sd= 0.30) did not significantly differ from the LA group (M= 1.76, sd= 0.27).

Discussion and Conclusion

Math anxiety is a problem that can adversely affect the academic success and employment prospects of children. Although the literature on math anxiety is largely focused on adults, recent studies have reported that some children begin to encounter math anxiety at the elementary school level. The findings of the study depict that the correlation level of math anxiety and math achievement is -.597 among students. In a meta-analysis study of Hembre and Ma, found that the level of relationship between mathematical success and math anxiety is -.34 and -.27, respectively. In a similar meta-analysis study performed in Turkey, the correlation coefficient was found to be -.44. The different occurrence of the coefficients is probably dependent on the scales used and the sample variety.

The participants of the study were classified into four groups: math learning difficulties (0-10%), low success (11-25%), normal (26-95%), and high success (96-100%) by the mathematics achievement test scores. The study compared the math anxiety scores of the groups and found no significant difference between the mean scores of the math anxiety of the lower two groups (mean of MLD math anxiety, .196; mean of LA math anxiety .177) as it was between the upper two groups (mean of NA math anxiety, .142; mean of HA math anxiety .125). This indicates that the math anxiety level of the students with learning difficulties in math does not differ from the low math students. However, a significant difference was found between the mean scores of math anxiety of the low successful and the normal group.

It may be better for some students to maintain moderate levels of math anxiety to make their learning and testing materials moderately challenging, but it can be clearly said that high math anxiety has detrimental effects on the mathematical performance of the individuals. Especially for students with learning difficulties in math, the high level of math anxiety will lead to destructive effects in many dimensions, primarily a lack of working memory.

Many of the techniques employed to reduce or eliminate the link between math anxiety and poor math performance involve addressing the anxiety rather than training math itself. Some methods for reducing math anxiety can be used in teaching mathematics. For instance, effective instruction for struggling mathematics learners includes instructional explicitness, a strong conceptual basis, cumulative review and practice, and motivators to help maintain student interest and engagement.

For more insights like this, visit our website at www.international-maths-challenge.com.

Credit for the article given to Yılmaz Mutlu


Google Has Created a Maths AI That Has Already Proved 1200 Theorems

Mathematicians don’t need to worry about AI taking over their jobs just yet

You don’t need a human brain to do maths — even artificial intelligence can write airtight proofs of mathematical theorems.

An AI created by a team at Google has proven more than 1200 mathematical theorems. Mathematicians already knew proofs for these particular theorems, but eventually the AI could start working on more difficult problems.

One of the core pillars of maths is the concept of proof. It is an argument based on known statements, assumptions, or rules, that a certain mathematical statement, such as a theorem, is true.

To train their AI, the Google team started with a database of more than 10,000 human-written mathematical proofs, along with the reasoning behind each step known as a tactic. Tactics could include using a known property about numbers, such as the fact that multiplying x by y is the same as multiplying y by x, or applying the chain rule.

Then, they tested the AI on 3225 theorems it hadn’t seen before and it successfully proved 1253 of them. Those that it couldn’t prove were because it had only 41 tactics at its disposal.

To prove each theorem, the AI split them into smaller and smaller components using the list of tactics. Eventually each of the smaller components could be proven with a single tactic, thus proving the larger theorem.

“Most of the proofs we used are relatively short, so they don’t require a lot of long complicated reasoning, but this is a start,” says Christian Szegedy at Google. “Where we want to get to is a system that can prove all the theorems that humans can prove, and maybe even more.”

Tackling harder problems

While this particular algorithm is focused on linear algebra and complex calculus, changing its training set could allow it to do any sort of mathematics, says Szgedy. For now, the AI’s main application is filling in the details of long and arduous proofs with extreme precision.

Mathematicians often make intellectual jumps in their proofs without spelling out the exact tactics used to get from one step to the next, and provers like this could walk through the intermediate work automatically, without requiring a human mathematician to fill in each exact tactic used.

“You get the maximum of precision and correctness all really spelled out, but you don’t have to do the work of filling in the details,” says Jeremy Avigad at Carnegie Mellon University in Pennsylvania. “Maybe offloading some things that we used to do by hand frees us up for looking for new concepts and asking new questions.”

AIs like this could one day even solve maths problems we don’t know how to solve or that are too long and complicated. But that will take a much larger training set, more tactics, and a simpler way to plug the theorems into the computer. “That’s far away, but I think it could happen in our lifetime,” says Szgedy.

“Pretty much anything that you can state and try to prove mathematically, you can put into this system,” says Avigad. “You can distill just about all of mathematics down to very basic rules and assumptions, and these systems implement those rules and assumptions.”

All of this happens in a matter of seconds per proof and the only source of error is the translation of the theorem into formal language the computer can understand. Szegedy says that the team is now working on the problem of automatic translation so that it’s easier for mathematicians to interact with the system.

For more such insights, log into www.international-maths-challenge.com.

*Credit for article given to Leah Crane*


We Could Solve The Biggest Problem in Maths in The Next Decade

P is not NP? That is the question

One of the biggest open problems in mathematics may be solved within the next decade, according to a poll of computer scientists. A solution to the so-called P versus NP problem is worth $1 million and could have a profound effect on computing, and perhaps even the entire world.

The problem is a question about how long algorithms take to run and whether some hard mathematical problems are actually easy to solve.

P and NP both represent groups of mathematical problems, but it isn’t known if these groups are actually identical.

P, which stands for polynomial time, consists of problems that can be solved by an algorithm in a relatively short time. NP, which stands for nondeterministic polynomial time, comprises the problems that are easy to check if you have the right answer given a potential candidate, although actually finding an answer in the first place might be difficult.

NP problems include a number of important real-world tasks, such as the travelling salesman problem, which involves finding a route between a list of cities that is shorter than a certain limit. Given such a route, you can easily check if it fits the limit, but finding one might be more difficult.

Equal or not

The P versus NP problem asks whether these two collections of problems are actually the same. If they are, and P = NP, the implications are potentially world-changing, because it could become much easier to solve these tasks. If they aren’t, and P doesn’t equal NP, or P ≠ NP, a proof would still answer fundamental questions about the nature of computation.

The problem was first stated in 1971 and has since become one of the most important open questions in mathematics – anyone who can find the answer either way will receive $1 million from the Clay Mathematics Institute in Cambridge, Massachusetts.

William Gasarch, a computer scientist at the University of Maryland in College Park, conducts polls of his fellow researchers to gauge the current state of the problem. His first poll, in 2002, found that just 61 per cent of respondents thought P ≠ NP. In 2012, that rose to 83 per cent, and now in 2019 it has slightly increased to 88 per cent. Support for P = NP has also risen, however, from 9 per cent in 2002 to 12 per cent in 2019, because the 2002 poll had a large number of “don’t knows”.

Confidence that we might soon have an answer is also rising. In 2002, just 5 per cent thought the problem would be resolved in the next decade, falling to 1 per cent in 2012, but now the figure sits at 22 per cent. “This is very surprising since there has not been any progress on it,” says Gasarch. “If anything, I think that as the problem remains open longer, it seems harder.” More broadly, 66 per cent believe it will be solved before the end of the century.

There was little agreement on the kind of mathematics that would ultimately be used to solve the problem, although a number of respondents suggested that artificial intelligence, not humans, could play a significant role.

“I can see this happening to some extent, but the new idea needed will, I think, come from a human,” says Gasarch. “I hope so, not for any reason of philosophy, but just because if a computer did it we might know that (say) P ≠ NP, but not really know why.”

Neil Immerman at the University of Massachusetts Amherst thinks that this kind of polling is interesting, but ultimately can’t tell us much about the P versus NP problem.

“As this poll demonstrates, there is no consensus on how this problem will be eventually solved,” he says. “For that reason, it is hard to measure the progress we have made since 1971 when the question was first stated.”

For more such insights, log into www.international-maths-challenge.com.

*Credit for article given to Jacob Aron*


What The Mathematics of Knots Reveals About The Shape of The Universe

Knot theory is linked to many other branches of science, including those that tell us about the cosmos.

The mathematical study of knots started with a mistake. In the 1800s, mathematician and physicist William Thomson, also known as Lord Kelvin, suggested that the elemental building blocks of matter were knotted vortices in the ether: invisible microscopic currents in the background material of the universe. His theory dropped by the wayside fairly quickly, but this first attempt to classify how curves could be knotted grew into the modern mathematical field of knot theory. Today, knot theory is not only connected to many branches of theoretical mathematics but also to other parts of science, like physics and molecular biology. It’s not obvious what your shoelace has to do with the shape of the universe, but the two may be more closely related than you think.

As it turns out, a tangled necklace offers a better model of a knot than a shoelace: to a mathematician, a knot is a loop in three-dimensional space rather than a string with loose ends. Just as a physical loop of string can stretch and twist and rotate, so can a mathematical knot – these loops are floppy rather than fixed. If we studied strings with free ends, they could wiggle around and untie themselves, but a loop stays knotted unless it’s cut.

Most questions in knot theory come in two varieties: sorting knots into classes and using knots to study other mathematical objects. I’ll try to give a flavour of both, starting with the simplest possible example: the unknot.

Draw a circle on a piece of paper. Congratulations, you’ve just constructed an unknot! This is the name for any loop in three-dimensional space that is the boundary of a disc. When you draw a circle on a piece of paper, you can see this disc as the space inside the circle, and your curve continues to be an unknot if you crumple the paper up, toss it through the air, flatten it out and then do some origami. As long as the disc is intact, no matter how distorted, the boundary is always an unknot.

Things get more interesting when you start with just the curve. How can you tell if it’s an unknot? There may secretly be a disc that can fill in the loop, but with no limits on how deformed the disc could be, it’s not clear how you can figure this out.

Two unknots

It turns out that this question is both hard and important: the first step in studying complicated objects is distinguishing them from simple ones. It’s also a question that gets answered inside certain bacterial cells each time they replicate. In the nuclei of these cells, the DNA forms a loop, rather than a strand with loose ends, and sometimes these loops end up knotted. However, the DNA can replicate only when the loop is an unknot, so the basic life processes of the cell require a process for turning a potentially complicated loop into an unknotted one.

A class of proteins called topoisomerases unknot tangled loops of DNA by cutting a strand, moving the free ends and then reattaching them. In a mathematical context, this operation is called a “crossing change”, and it’s known that any loop can be turned into the unknot by some number of crossing changes. However, there’s a puzzle in this process, since random crossing changes are unlikely to simplify a knot. Each topoisomerase operates locally, but collectively they’re able to reliably unknot the DNA for replication. Topoisomerases were discovered more than 50 years ago, but biologists are still studying how they unknot DNA so effectively.

When mathematicians want to identify a knot, they don’t turn to a protein to unknot it for them.  Instead, they rely on invariants, mathematical objects associated with knots. Some invariants are familiar things like numbers, while others are elaborate algebraic structures. The best invariants have two properties: they’re practical to compute, given the input of a specific knot, and they distinguish many different classes of knots from each other. It’s easy to define an invariant with only one of these properties, but a computable and effective knot invariant is a rare find.

The modern era of knot theory began with the introduction of an invariant called the Jones Polynomial in the 1980s. Vaughan Jones was studying statistical mechanics when he discovered a process that assigns a polynomial – a type of simple algebraic expression – to any knot. The method he used was technical, but the essential feature is that no amount of wiggling, stretching or twisting changes the output. The Jones Polynomial of an unknot is 1, no matter how complicated the associated disc might be.

Jones’s discovery caught the attention of other researchers, who found simpler techniques for computing the same polynomial. The result was an invariant that satisfies both the conditions listed above: the Jones Polynomial can be computed from a drawing of a knot on paper, and many thousands of knots can be distinguished by the fact that they have different Jones Polynomials.

However, there are still many things we don’t know about the Jones Polynomial, and one of the most tantalising questions is which knots it can detect. Most invariants distinguish some knots while lumping others together, and we say an invariant detects a knot if all the examples sharing a certain value are actually deformations of each other. There are certainly pairs of distinct knots with the same Jones Polynomial, but after decades of study, we still don’t know whether any knot besides the unknot has the polynomial 1. With computer assistance, experts have examined nearly 60 trillion examples of distinct knots without finding any new knots whose Jones Polynomials equal 1.

The Jones Polynomial has applications beyond knot detection. To see this, let’s return to the definition of an unknot as a loop that bounds a disc. In fact, every knot is the boundary of some surface – what distinguishes an unknot is that this surface is particularly simple. There’s a precise way to rank the complexity of surfaces, and we can use this to rank the complexity of knots. In this classification, the simplest knot is the unknot, and the second simplest is the trefoil, which is shown below.

Trefoil knot

To build a surface with a trefoil boundary, start with a strip of paper. Twist it three times and then glue the ends together. This is more complicated than a disc, but still pretty simple. It also gives us a new question to investigate: given an arbitrary knot, where does it fit in the ranking of knot complexity? What’s the simplest surface it can bound? Starting with a curve and then hunting for a surface may seem backwards, but in some settings, the Jones Polynomial answers this question: the coefficients of the knot polynomial can be used to estimate the complexity of the surfaces it bounds.

Joan Licata

Knots also help us classify other mathematical objects. We can visually distinguish the two-dimensional surface of sphere from the surface a torus (the shape of a ring donut), but an ant walking on one of these surfaces might need knot theory to tell them apart. On the surface of a torus, there are loops that can’t be pulled any tighter, while any loop lying on a sphere can contract to a point.

We live inside a universe of three physical dimensions, so like the ant on a surface, we lack a bird’s eye view that could help us identify its global shape. However, we can ask the analogous question: can each loop we encounter shrink without breaking, or is there a shortest representative? Mathematicians can classify three-dimensional spaces by the existence of the shortest knots they contain. Presently, we don’t know if some knots twisting through the universe are unfathomably long or if every knot can be made as small as one of Lord Kelvin’s knotted vortices.

For more such insights, log into www.international-maths-challenge.com.

*Credit for article given to Joan Licata*