
What The Mathematics of Knots Reveals About The Shape of The Universe

Knot theory is linked to many other branches of science, including those that tell us about the cosmos.

The mathematical study of knots started with a mistake. In the 1800s, mathematician and physicist William Thomson, also known as Lord Kelvin, suggested that the elemental building blocks of matter were knotted vortices in the ether: invisible microscopic currents in the background material of the universe. His theory dropped by the wayside fairly quickly, but this first attempt to classify how curves could be knotted grew into the modern mathematical field of knot theory. Today, knot theory is not only connected to many branches of theoretical mathematics but also to other parts of science, like physics and molecular biology. It’s not obvious what your shoelace has to do with the shape of the universe, but the two may be more closely related than you think.

As it turns out, a tangled necklace offers a better model of a knot than a shoelace: to a mathematician, a knot is a loop in three-dimensional space rather than a string with loose ends. Just as a physical loop of string can stretch and twist and rotate, so can a mathematical knot – these loops are floppy rather than fixed. If we studied strings with free ends, they could wiggle around and untie themselves, but a loop stays knotted unless it’s cut.

Most questions in knot theory come in two varieties: sorting knots into classes and using knots to study other mathematical objects. I’ll try to give a flavour of both, starting with the simplest possible example: the unknot.

Draw a circle on a piece of paper. Congratulations, you’ve just constructed an unknot! This is the name for any loop in three-dimensional space that is the boundary of a disc. When you draw a circle on a piece of paper, you can see this disc as the space inside the circle, and your curve continues to be an unknot if you crumple the paper up, toss it through the air, flatten it out and then do some origami. As long as the disc is intact, no matter how distorted, the boundary is always an unknot.

Things get more interesting when you start with just the curve. How can you tell if it’s an unknot? There may secretly be a disc that can fill in the loop, but with no limits on how deformed the disc could be, it’s not clear how you can figure this out.

Two unknots

It turns out that this question is both hard and important: the first step in studying complicated objects is distinguishing them from simple ones. It’s also a question that gets answered inside certain bacterial cells each time they replicate. In the nuclei of these cells, the DNA forms a loop, rather than a strand with loose ends, and sometimes these loops end up knotted. However, the DNA can replicate only when the loop is an unknot, so the basic life processes of the cell require a process for turning a potentially complicated loop into an unknotted one.

A class of proteins called topoisomerases unknot tangled loops of DNA by cutting a strand, moving the free ends and then reattaching them. In a mathematical context, this operation is called a “crossing change”, and it’s known that any loop can be turned into the unknot by some number of crossing changes. However, there’s a puzzle in this process, since random crossing changes are unlikely to simplify a knot. Each topoisomerase operates locally, but collectively they’re able to reliably unknot the DNA for replication. Topoisomerases were discovered more than 50 years ago, but biologists are still studying how they unknot DNA so effectively.

When mathematicians want to identify a knot, they don’t turn to a protein to unknot it for them.  Instead, they rely on invariants, mathematical objects associated with knots. Some invariants are familiar things like numbers, while others are elaborate algebraic structures. The best invariants have two properties: they’re practical to compute, given the input of a specific knot, and they distinguish many different classes of knots from each other. It’s easy to define an invariant with only one of these properties, but a computable and effective knot invariant is a rare find.

The modern era of knot theory began with the introduction of an invariant called the Jones Polynomial in the 1980s. Vaughan Jones was studying statistical mechanics when he discovered a process that assigns a polynomial – a type of simple algebraic expression – to any knot. The method he used was technical, but the essential feature is that no amount of wiggling, stretching or twisting changes the output. The Jones Polynomial of an unknot is 1, no matter how complicated the associated disc might be.

Jones’s discovery caught the attention of other researchers, who found simpler techniques for computing the same polynomial. The result was an invariant that satisfies both the conditions listed above: the Jones Polynomial can be computed from a drawing of a knot on paper, and many thousands of knots can be distinguished by the fact that they have different Jones Polynomials.

However, there are still many things we don’t know about the Jones Polynomial, and one of the most tantalising questions is which knots it can detect. Most invariants distinguish some knots while lumping others together, and we say an invariant detects a knot if all the examples sharing a certain value are actually deformations of each other. There are certainly pairs of distinct knots with the same Jones Polynomial, but after decades of study, we still don’t know whether any knot besides the unknot has the polynomial 1. With computer assistance, experts have examined nearly 60 trillion examples of distinct knots without finding any new knots whose Jones Polynomials equal 1.

The Jones Polynomial has applications beyond knot detection. To see this, let’s return to the definition of an unknot as a loop that bounds a disc. In fact, every knot is the boundary of some surface – what distinguishes an unknot is that this surface is particularly simple. There’s a precise way to rank the complexity of surfaces, and we can use this to rank the complexity of knots. In this classification, the simplest knot is the unknot, and the second simplest is the trefoil, which is shown below.

Trefoil knot

To build a surface with a trefoil boundary, start with a strip of paper. Twist it three times and then glue the ends together. This is more complicated than a disc, but still pretty simple. It also gives us a new question to investigate: given an arbitrary knot, where does it fit in the ranking of knot complexity? What’s the simplest surface it can bound? Starting with a curve and then hunting for a surface may seem backwards, but in some settings, the Jones Polynomial answers this question: the coefficients of the knot polynomial can be used to estimate the complexity of the surfaces it bounds.

Joan Licata

Knots also help us classify other mathematical objects. We can visually distinguish the two-dimensional surface of sphere from the surface a torus (the shape of a ring donut), but an ant walking on one of these surfaces might need knot theory to tell them apart. On the surface of a torus, there are loops that can’t be pulled any tighter, while any loop lying on a sphere can contract to a point.

We live inside a universe of three physical dimensions, so like the ant on a surface, we lack a bird’s eye view that could help us identify its global shape. However, we can ask the analogous question: can each loop we encounter shrink without breaking, or is there a shortest representative? Mathematicians can classify three-dimensional spaces by the existence of the shortest knots they contain. Presently, we don’t know if some knots twisting through the universe are unfathomably long or if every knot can be made as small as one of Lord Kelvin’s knotted vortices.

For more such insights, log into www.international-maths-challenge.com.

*Credit for article given to Joan Licata*

Deepmind Created a Maths AI That Can Add Up To 6 But Gets 7 Wrong

Artificial intelligence firm DeepMind has tackled games like Go and Starcraft, but now it is turning its attention to more sober affairs: how to solve school-level maths problems.

Researchers at the company tasked an AI with teaching itself to solve arithmetic, algebra and probability problems, among others. It didn’t do a very good job: when the neural network was tested on a maths exam taken by 16-year-olds in the UK, it got just 14 out of 40 questions correct, or the equivalent of an E grade.

There were also strange quirks in the AI’s ability. For example, it could successfully add up 1+1+1+1+1+1 to make 6, but failed when an extra 1 was added. On the other hand, it gave the correct answer for longer sequences and much bigger numbers.

Other oddities included the ability to correctly answer 68 to the question “calculate 17×4.”, but when the full stop was removed, the answer came out at 69.

Puzzling behaviour

The DeepMind researchers concede they don’t have a good explanation for this behaviour. “At the moment, learning systems like neural networks are quite bad at doing ‘algebraic reasoning’,” says David Saxton, one of the team behind the work.

Despite this, it is still worth trying to teach a machine to solve maths problems, says Marcus du Sautoy, a mathematician at the University of Oxford.

“There are already algorithms out there to do these problems much faster, much better than machine-learning algorithms, but that’s not the point,” says du Sautoy. “They are setting themselves a different target – we want to start from nothing, by being told whether you got that one wrong, that one right, whether it can build up how to do this itself. Which is fascinating.”

An AI capable of solving advanced mathematics problems could put him out of a job, says du Sautoy. “That’s my fear. It may not take too much for an AI to get maturity in this world, whereas a maturity in the musical or visual or language world might be much harder for it. So I do think my subject is vulnerable.”

However, he takes some comfort that machine learning’s general weakness in remaining coherent over a long form – such as a novel, rather than a poem – will keep mathematicians safe for now. Creating mathematical proofs, rather than solving maths problems for 16-year-olds, will be difficult for machines, he says.

Noel Sharkey at the University of Sheffield, UK, says the research is more about finding the limits of machine-learning techniques, rather than promoting advancements in mathematics.

The interesting thing, he says, will be to see how the neural networks can adapt to challenges outside of those they were trained on. “The big question is to ask how well they can generalise to novel examples that were not in the training set. This has the potential to demonstrate formal limits to what this type of learning is capable of.”

Saxton says training a neural network on maths problems could help provide AI with reasoning skills for other applications.

“Humans are good at maths, but they are using general reasoning skills that current artificial learning systems don’t possess,” he says. “If we can develop models that are good at solving these problems, then these models would likely be using general skills that would be good at solving other hard problems in AI as well.”

He hopes the work could make a small contribution towards more general mathematical AIs that could tackle things such as proving theorems.

The DeepMind team has published its data set of maths questions, and encouraged people to train their own AI.

For more such insights, log into www.international-maths-challenge.com.

*Credit for article given to Adam Vaughan*


Mathematicians Have Found a New Way to Multiply Two Numbers Together

It’s a bit more complicated than this

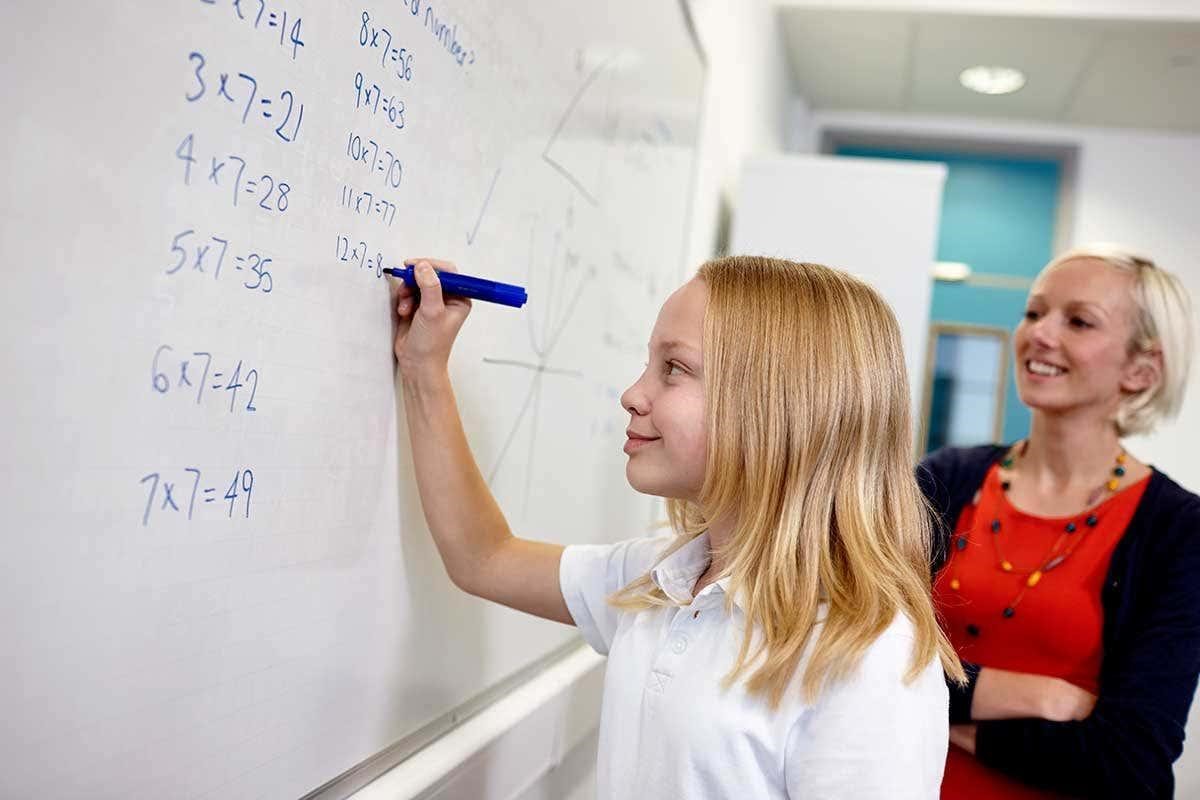
Forget your times tables – mathematicians have found a new, faster way to multiply two numbers together. The method, which works only for whole numbers, is a landmark result in computer science. “This is big news,” says Joshua Cooper at the University of South Carolina.

To understand the new technique, which was devised by David Harvey at the University of New South Wales, Australia, and Joris van der Hoeven at the Ecole Polytechnique near Paris, France, it helps to think back to the longhand multiplication you learned at school.

We write down two numbers, one on top of the other, and then painstakingly multiply each digit of one by each digit of the other, before adding all the results together. “This is an ancient algorithm,” says Cooper.

If your two numbers each have n digits, this way of multiplying will require roughly n2 individual calculations. “The question is, can you do better?” says Cooper.

Lots of logs

Starting in the 1960s, mathematicians began to prove that they could. First Anatoly Karatsuba found an algorithm that could turn out an answer in no more than n1.58 steps, and in 1971, Arnold Schönhage and Volker Strassen found a way to peg the number of steps to the complicated expression n*(log(n))*log(log(n)) – here “log” is short for logarithm.

These advances had a major impact on computing. Whereas a computer using the longhand multiplication method would take about six months to multiply two billion-digit numbers together, says Harvey, the Schönhage-Strassen algorithm can do it in 26 seconds.

The landmark 1971 paper also suggested a possible improvement, a tantalising prediction that multiplication might one day be possible in no more than n*log(n) steps. Now Harvey and van der Hoeven appear to have proved this is the case. “It finally appears to be possible,” says Cooper. “It passes the smell test.”

“If the result is correct, it’s a major achievement in computational complexity theory,” says Fredrik Johansson at INRIA, the French research institute for digital sciences, in Bordeaux. “The new ideas in this work are likely to inspire further research and could lead to practical improvements down the road.”

Cooper also praises the originality of the research, although stresses the complexity of the mathematics involved. “You think, jeez, I’m just multiplying two integers, how complicated can it get?” says Cooper. “But boy, it gets complicated.”

So, will this make calculating your tax returns any easier? “For human beings working with pencil and paper, absolutely not,” says Harvey. Indeed, their version of the proof only works for numbers with more than 10 to the power of 200 trillion trillion trillion digits. “The word ‘astronomical’ falls comically short in trying to describe this number,” says Harvey.

While future improvements to the algorithm may extend the proof to more humdrum numbers only a few trillion digits long, Cooper thinks its real value lies elsewhere. From a theoretical perspective, he says, this work allows programmers to provide a definitive guarantee of how long a certain algorithm will take. “We are optimistic that our new paper will allow us to achieve further practical speed-ups,” says van der Hoeven.

Harvey thinks this may well be the end of the story, with no future algorithm capable of beating n*log(n). “I would be extremely surprised if this turned out to be wrong,” he says, “but stranger things have happened.”

For more such insights, log into www.international-maths-challenge.com.

*Credit for article given to Gilead Amit*


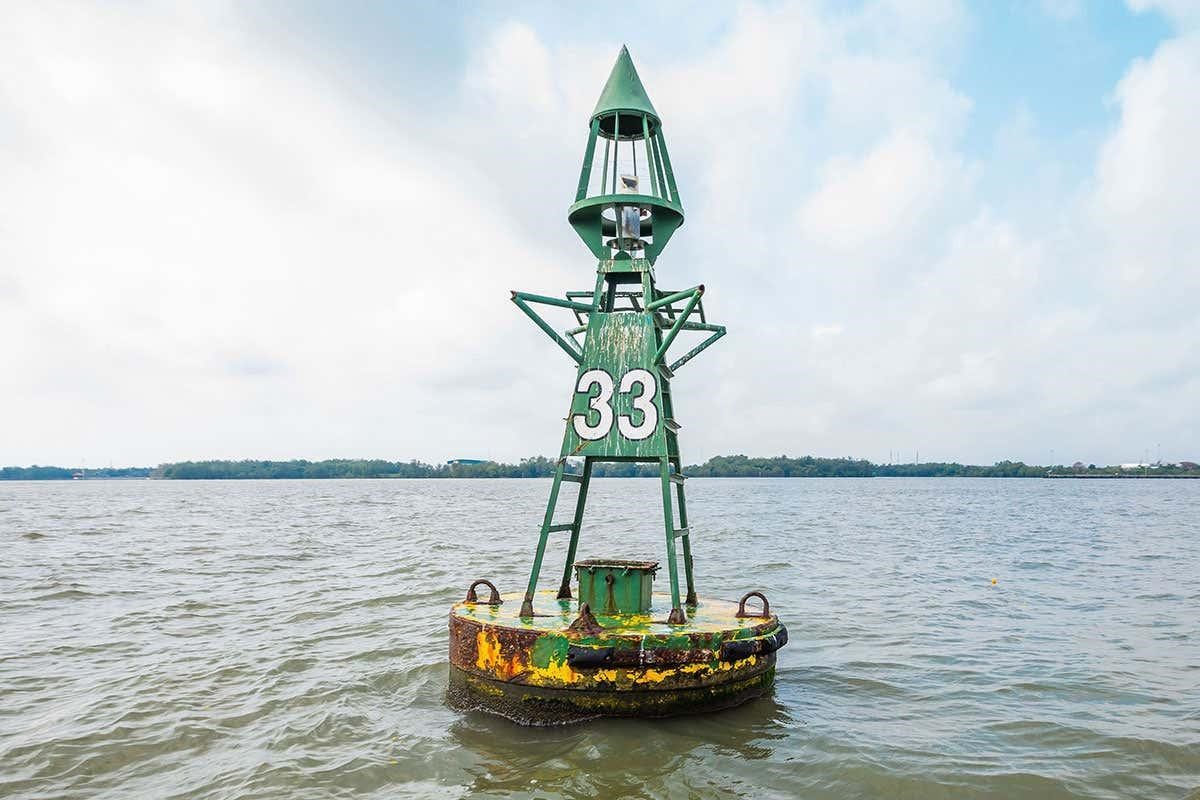
Mathematician Cracks Centuries-Old Problem About The Number 33

The number 33 has surprising depth

Add three cubed numbers, and what do you get? It is a question that has puzzled mathematicians for centuries.

In 1825, a mathematician known as S. Ryley proved that any fraction could be represented as the sum of three cubes of fractions. In the 1950s, mathematician Louis Mordell asked whether the same could be done for integers, or whole numbers. In other words, are there integers k, x, y and z such that k = x3 + y3 + z3 for each possible value of k?

We still don’t know. “It’s long been clear that there are maths problems that are easy to state, but fiendishly hard to solve,” says Andrew Booker at the University of Bristol, UK – Fermat’s last theorem is a famous example.

Booker has now made another dent in the cube problem by finding a sum for the number 33, previously the lowest unsolved example. He used a computer algorithm to search for a solution:

33 = 8,866,128,975,287,5283 + (-8,778,405,442,862,239)3 + (-2,736,111,468,807,040)3

To cut down calculation time, the program eliminated certain combinations of numbers. “For instance, if x, y and z are all positive and large, then there’s no way that x3 + y3 + z3 is going to be a small number,” says Booker. Even so, it took 15 years of computer-processing time and three weeks of real time to come up with the result.

For some numbers, finding a solution to the equation k = x3 + y3 + z3 is simple, but others involve huge strings of digits. “It’s really easy to find solutions for 29, and we know a solution for 30, but that wasn’t found until 1999, and the numbers were in the millions,” says Booker.

Another example is for the number 3, which has two simple solutions: 13 + 13 + 13  and 43 + 43 + (-5) 3 . “But to this day, we still don’t know whether there are more,” he says.

There are certain numbers that we know definitely can’t be the sum of three cubes, including 4, 5, 13, 14 and infinitely many more.

The solution to 74 was only found in 2016, which leaves 42 as the only number less than 100 without a possible solution. There are still 12 unsolved numbers less than 1000.

For more such insights, log into www.international-maths-challenge.com.

*Credit for article given to Donna Lu*


Viewing Matrices & Probability as Graphs

Today I’d like to share an idea. It’s a very simple idea. It’s not fancy and it’s certainly not new. In fact, I’m sure many of you have thought about it already. But if you haven’t—and even if you have!—I hope you’ll take a few minutes to enjoy it with me. Here’s the idea:

So simple! But we can get a lot of mileage out of it.

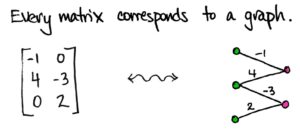
To start, I’ll be a little more precise: every matrix corresponds to a weighted bipartite graph. By “graph” I mean a collection of vertices (dots) and edges; by “bipartite” I mean that the dots come in two different types/colors; by “weighted” I mean each edge is labeled with a number.

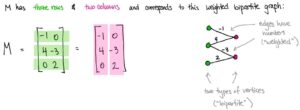
The graph above corresponds to a 3×23×2 matrix MM. You’ll notice I’ve drawn three greengreen dots—one for each row of MM—and two pinkpink dots—one for each column of MM. I’ve also drawn an edge between a green dot and a pink dot if the corresponding entry in MM is non-zero.

For example, there’s an edge between the second green dot and the first pink dot because M21=4M21=4, the entry in the second row, first column of MM, is not zero. Moreover, I’ve labeled that edge by that non-zero number. On the other hand, there is no edge between the first green dot and the second pink dot because M12M12, the entry in the first row, second column of the matrix, is zero.

Allow me to describe the general set-up a little more explicitly.

Any matrix MM is an array of n×mn×m numbers. That’s old news, of course. But such an array can also be viewed as a function M:X×Y→RM:X×Y→R where X={x1,…,xn}X={x1,…,xn} is a set of nn elements and Y={y1,…,ym}Y={y1,…,ym} is a set of mm elements. Indeed, if I want to describe the matrix MM to you, then I need to tell you what each of its ijijth entries are. In other words, for each pair of indices (i,j)(i,j), I need to give you a real number MijMij. But that’s precisely what a function does! A function M:X×Y→RM:X×Y→R associates for every pair (xi,yj)(xi,yj) (if you like, just drop the letters and think of this as (i,j)(i,j)) a real number M(xi,yj)M(xi,yj). So simply write MijMij for M(xi,yj)M(xi,yj).

Et voila. A matrix is a function.

For more such insights, log into www.international-maths-challenge.com.

*Credit for article given to Tai-Danae Bradley*


Physicists are Turning to Lewis Carroll For Help With Their Maths

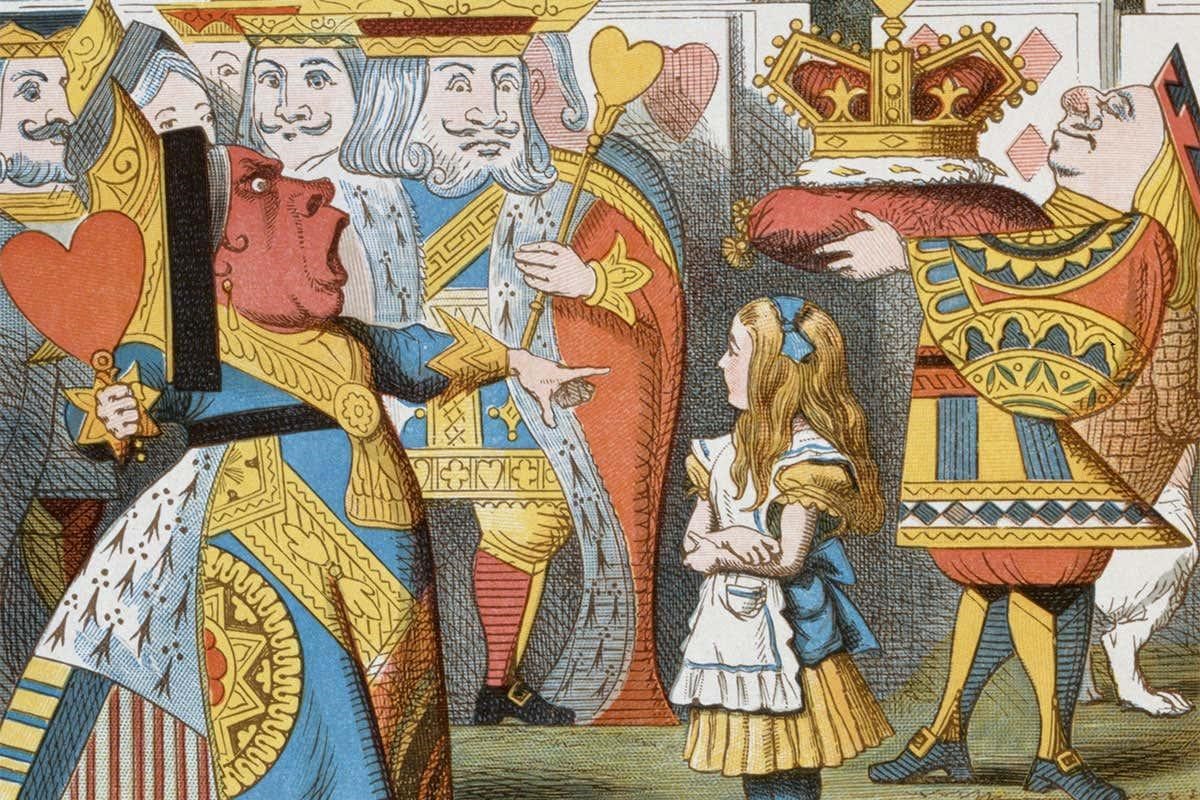
Lewis Caroll was the pen name for mathematician Charles Dodgson

Curiouser and curiouser! Particle physicists could have the author of Alice’s Adventures in Wonderland to thank for simplifying their calculations.

Lewis Carroll, the 19th century children’s author, was the pen name of mathematician Charles Lutwidge Dodgson. While his mathematical contributions mostly proved unremarkable, one particular innovation may have stood the test of time.

Marcel Golz at Humboldt University, Berlin has built on Dodgson’s work to help simplify the complex equations that arise when physicists try to calculate what happens when particles interact. The hope is that it could allow for speedier and more accurate computations, allowing experimentalists at places like the Large Hadron Collider in Geneva, Switzerland to better design their experiments.

Working out the probabilities of different particle interactions is commonly done using Feynman diagrams, named after the Nobel prize winning physicist Richard Feynman. These diagrams are a handy visual aid for encoding the complex processes at play, allowing them to be converted into mathematical notation.

One early way of representing these diagrams was known as the parametric representation, which has since lost favour among physicists owing to its apparent complexity. To mathematicians, however, patterns in the resulting equations suggest that it might be possible to dramatically simplify them in ways not possible for more popular representations. These simplifications could in turn enable new insights. “A lot of this part of physics is constrained by how much you can compute” says Karen Yeats, a mathematician at the university of Waterloo, Canada.

Golz’s work makes use of the Dodgson identity, a mathematical equivalence noted by Dodgson in an 1866 paper, to perform this exact sort of simplification. While much of the connecting mathematics was done by Francis Brown, one of Golz’s tutors at Oxford University, the intellectual lineage can be traced all the way back to Lewis Carroll. “It’s kind of a nice curiosity,” says Golz. “A nice conversation starter.”

In the past, parametric notation was only useful in calculating simplified forms of quantum theory. Thanks to work like Golz’s, these simplifications could be extended to particle behaviour of real interest to experimentalists. “I can say with confidence that these parametric techniques, applied to the right problems, are game-changing,” says Brown.

For more such insights, log into www.international-maths-challenge.com.

*Credit for article given to Gilead Amit*


Infinity War: The Ongoing Battle Over The World’s Hardest Maths Proof

Is there an error in there somewhere?

It’s the stuff of Hollywood. Somebody somewhere is surely selling the movie rights to what’s become the biggest spat in maths: a misunderstood genius, a 500-page proof almost nobody can understand and a supporting cast squabbling over what it all means. At stake: nothing less than the future of pure mathematics.

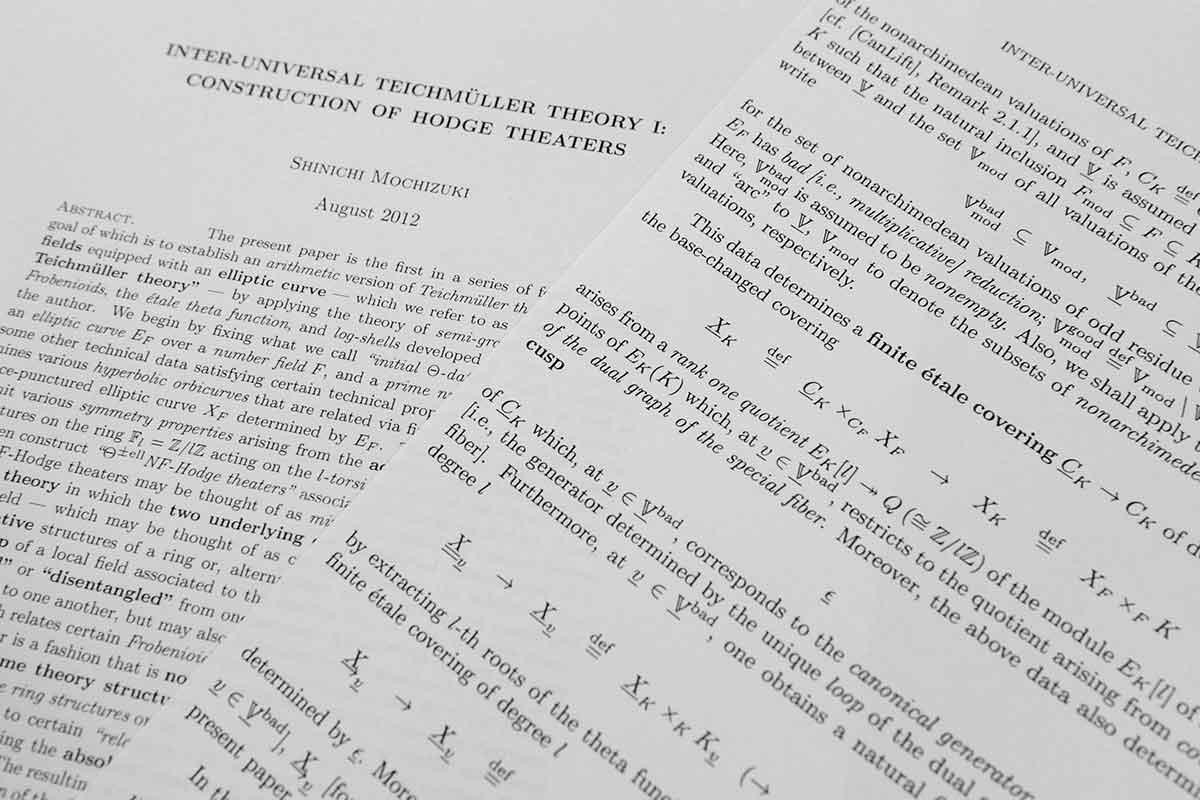
In 2012, Shinichi Mochizuki at Kyoto University in Japan produced a proof of a long-standing problem called the ABC conjecture. Six years later the jury is still out on whether it’s correct. But in a new twist, Peter Scholze at the University of Bonn – who was awarded the Fields Medal, the highest honour in maths, in August – and Jakob Stix at Goethe University Frankfurt – who is an expert in the type of maths used by Mochizuki – claim to have found an error at the heart of Mochizuki’s proof.

Roll credits? Not so fast. The pairs’ reputation means that their claim is a serious blow for Mochizuki. And a handful of other mathematicians claim to have lost the thread of the proof at the same point Scholze and Stix say there is an error. But there is still room for dispute.

a + b = c?

The ABC conjecture was first proposed in the 1980s and concerns a fundamental property of numbers, based around the simple equation a + b = c. For a long time, mathematicians believed that the conjecture was true but nobody had ever been able to prove it.

To tackle the problem, Mochizuki had to invent a fiendish type of maths called Inter-universal Teichmüller (IUT) theory. In an effort to understand IUT better, Scholze and Stix spent a week with Mochizuki in Tokyo in March. By the end of the week, they claim to have found an error.

The alleged flaw comes in Conjecture 3.12, which many see as the crux of the proof. This section involves measuring an equivalence between different mathematical objects. In effect, Scholze and Stix claim that Mochizuki changes the length of the measuring stick in the middle of the process.

No proof

“We came to the conclusion that there is no proof,” they write in their report, which was posted online on 20 September.

But Ivan Fesenko at the University of Nottingham, UK, who says he is one of only 15 people around the world who actually understand Mochizuki’s theory, thinks Scholze and Stix are jumping the gun. “They spent much less time than all of us who have been studying this for many years,” says Fesenko.

Mochizuki has tried to help others understand his work, taking part in seminars and answering questions. Mochizuki was even the one who posted Scholze and Stix’s critical report. “We have this paradoxical situation in which the victim has published the report of the villain,” says Fesenko with a laugh. “This is an unprecedented event in mathematics.”

So is the proof wrong or just badly explained? Fesenko thinks that the six-year dispute exposes something rotten at the heart of pure mathematics. These days mathematicians work in very narrow niches, he says. “People just do not understand what the mathematician in the next office to you is doing.”

This means that mathematicians will increasingly have to accept others’ proofs without actually understanding them – something Fesenko describes as a fundamental problem for the future development of mathematics.

This suggests the story of Mochizuki’s proof may forever lack a satisfactory ending – becoming a war between mathematicians that is doomed to spiral into infinity. “My honest answer is that we will never have consensus about it,” says Fesenko.

For more such insights, log into www.international-maths-challenge.com.

*Credit for article given to Douglas Heaven*


Theorem of Everything: The Secret That Links Numbers and Shapes

For millennia mathematicians have struggled to unify arithmetic and geometry. Now one young genius could have brought them in sight of the ultimate prize.

IF JOEY was Chloe’s age when he was twice as old as Zoe was, how many times older will Zoe be when Chloe is twice as old as Joey is now?

Or try this one for size. Two farmers inherit a square field containing a crop planted in a circle. Without knowing the exact size of the field or crop, or the crop’s position within the field, how can they draw a single line to divide both the crop and field equally?

You’ve either fallen into a cold sweat or you’re sharpening your pencil (if you can’t wait for the answer, you can check the bottom of this page). Either way, although both problems count as “maths” – or “math” if you insist – they are clearly very different. One is arithmetic, which deals with the properties of whole numbers: 1, 2, 3 and so on as far as you can count. It cares about how many separate things there are, but not what they look like or how they behave. The other is geometry, a discipline built on ideas of continuity: of lines, shapes and other objects that can be measured, and the spatial relationships between them.

Mathematicians have long sought to build bridges between these two ancient subjects, and construct something like a “grand unified theory” of their discipline. Just recently, one brilliant young researcher might have brought them decisively closer. His radical new geometrical insights might not only unite mathematics, but also help solve one of the deepest number problems of them all: the riddle of the primes. With the biggest prizes in mathematics, the Fields medals, to be awarded this August, he is beginning to look like a shoo-in.

The ancient Greek philosopher and mathematician Aristotle once wrote, “We cannot… prove geometrical truths by arithmetic.” He left little doubt he believed geometry couldn’t help with numbers, either. It was hardly a controversial thought for the time. The geometrical proofs of Aristotle’s near-contemporary Euclid, often called the father of geometry, relied not on numbers, but logical axioms extended into proofs by drawing lines and shapes. Numbers existed on an entirely different, more abstract plane, inaccessible to geometers’ tools.

And so it largely remained until, in the 1600s, the Frenchman René Descartes used the techniques of algebra – of equation-solving and the manipulation of abstract symbols – to put Euclid’s geometry on a completely new footing. By introducing the notion that geometrical points, lines and shapes could all be described by numerical coordinates on an underlying grid, he allowed geometers to make use of arithmetic’s toolkit, and solve problems numerically.

This was a moonshot that let us, eventually, do things like send rockets into space or pinpoint positions to needle-sharp accuracy on Earth. But to a pure mathematician it is only a halfway house. A circle, for instance, can be perfectly encapsulated by an algebraic equation. But a circle drawn on graph paper, produced by plotting out the equation’s solutions, would only ever capture a fragment of that truth. Change the system of numbers you use, for example – as a pure mathematician might do – and the equation remains valid, while the drawing may no longer be helpful.

Wind forward to 1940 and another Frenchman was deeply exercised by the divide between geometry and numbers. André Weil was being held as a conscientious objector in a prison just outside Rouen, having refused to enlist in the months preceding the German occupation of France – a lucky break, as it turned out. In a letter to his wife, he wrote: “If it’s only in prison that I work so well, will I have to arrange to spend two or three months locked up every year?”

Weil hoped to find a Rosetta stone between algebra and geometry, a reference work that would allow truths in one field to be translated into the other. While behind bars, he found a fragment.

It had to do with the Riemann hypothesis, a notorious problem concerning how those most fascinating numbers, the primes, are distributed (see below). There had already been hints that the hypothesis might have geometrical parallels. Back in the 1930s, a variant had been proved for objects known as elliptic curves. Instead of trying to work out how prime numbers are distributed, says mathematician Ana Caraiani at Imperial College London, “you can relate it to asking how many points a curve has”.

Weil proved that this Riemann-hypothesis equivalent applied for a range of more complicated curves too. The wall that had stood between the two disciplines since Ancient Greek times finally seemed to be crumbling. “Weil’s proof marks the beginning of the science with the most un-Aristotelian name of arithmetic geometry,” says Michael Harris of Columbia University in New York.

The Riemann Hypothesis: The million-dollar question

The prime numbers are the atoms of the number system, integers indivisible into smaller whole numbers other than one. There are an infinite number of them and there is no discernible pattern to their appearance along the number line. But their frequency can be measured – and the Riemann hypothesis, formulated by Bernhard Riemann in 1859, predicts that this frequency follows a simple rule set out by a mathematical expression now known as the Riemann zeta function.

Since then, the validity of Riemann’s hypothesis has been demonstrated for the first 10 trillion primes, but an absolute proof has yet to emerge. As a mark of the problem’s importance, it was included in the list of seven Millennium Problems set by the Clay Mathematics Institute in New Hampshire in 2000. Any mathematician who can tame it stands to win $1 million.

In the post-war years, in the more comfortable setting of the University of Chicago, Weil tried to apply his insight to the broader riddle of the primes, without success. The torch was taken up by Alexander Grothendieck, a mathematician ranked as one of the greatest of the 20th century. In the 1960s, he redefined arithmetic geometry.

Among other innovations, Grothendieck gave the set of whole numbers what he called a “spectrum”, for short Spec(Z). The points of this undrawable geometrical entity were intimately connected to the prime numbers. If you could ever work out its overall shape, you might gain insights into the prime numbers’ distribution. You would have built a bridge between arithmetic and geometry that ran straight through the Riemann hypothesis.

The shape Grothendieck was seeking for Spec(Z) was entirely different from any geometrical form we might be familiar with: Euclid’s circles and triangles, or Descartes’s parabolas and ellipses drawn on graph paper. In a Euclidean or Cartesian plane, a point is just a dot on a flat surface, says Harris, “but a Grothendieck point is more like a way of thinking about the plane”. It encompasses all the potential uses to which a plane could be put, such as the possibility of drawing a triangle or an ellipse on its surface, or even wrapping it map-like around a sphere.

If that leaves you lost, you are in good company. Even Grothendieck didn’t manage to work out the geometry of Spec(Z), let alone solve the Riemann hypothesis. That’s where Peter Scholze enters the story.

“Even the majority of mathematicians find most of the work unintelligible”

Born in Dresden in what was then East Germany in 1987, Scholze is currently, at the age of 30, a professor at the University of Bonn. He laid the first bricks for his bridge linking arithmetic and geometry in his PhD dissertation, published in 2012 when he was 24. In it, he introduced an extension of Grothendieck-style geometry, which he termed perfectoid geometry. His construction is built on a system of numbers known as the p-adics that are intimately connected with the prime numbers (see “The p-adics: A different way of doing numbers”). The key point is that in Scholze’s perfectoid geometry, a prime number, represented by its associated p-adics, can be made to behave like a variable in an equation, allowing geometrical methods to be applied in an arithmetical setting.

It’s not easy to explain much more. Scholze’s innovation represents “one of the most difficult notions ever introduced in arithmetic geometry, which has a long tradition of difficult notions”, says Harris. Even the majority of working mathematicians find most of it unintelligible, he adds.

Be that as it may, in the past few years, Scholze and a few initiates have used the approach to solve or clarify many problems in arithmetic geometry, to great acclaim. “He’s really unique as a mathematician,” says Caraiani, who has been collaborating with him. “It’s very exciting to be a mathematician working in the same field.”

This August, the world’s mathematicians are set to gather in Rio de Janeiro, Brazil, for their latest international congress, a jamboree held every four years. A centrepiece of the event is the awarding of the Fields medals. Up to four of these awards are given each time to mathematicians under the age of 40, and this time round there is one name everyone expects to be on the list. “I suspect the only way he can escape getting a Fields medal this year is if the committee decides he’s young enough to wait another four years,” says Marcus du Sautoy at the University of Oxford.


Peter Scholze, 30, looks like a shoo-in for mathematics’s highest accolade this summer

With so many grand vistas opening up, the question of Spec(Z) and the Riemann hypothesis almost becomes a sideshow. But Scholze’s new methods have allowed him to study the geometry, in the sense Grothendieck pioneered, that you would see if you examined the curve Spec(Z) under a microscope around the point corresponding to a prime number p. That is still a long way from understanding the curve as a whole, or proving the Riemann hypothesis, but his work has given mathematicians hope that this distant goal might yet be reached. “Even this is a huge breakthrough,” says Caraiani.

Scholze’s perfectoid spaces have enabled bridges to be built in entirely different directions, too. A half-century ago, in 1967, the then 30-year-old Princeton mathematician Robert Langlands wrote a tentative letter to Weil outlining a grand new idea. “If you are willing to read it as pure speculation I would appreciate that,” he wrote. “If not – I am sure you have a waste basket handy.”

In his letter, Langlands suggested that two entirely distinct branches of mathematics, number theory and harmonic analysis, might be related. It contained the seeds of what became known as the Langlands program, a vastly influential series of conjectures some mathematicians have taken to calling a grand unified theory capable of linking the three core mathematical disciplines: arithmetic, geometry and analysis, a broad field that we encounter in school in the form of calculus. Hundreds of mathematicians around the world, including Scholze, are committed to its completion.

The full slate of Langlands conjectures is no more likely than the original Riemann hypothesis to be proved soon. But spectacular discoveries could lie in store: Fermat’s last theorem, which took 350 years to prove before the British mathematician Andrew Wiles finally did so in 1994, represents just one particular consequence of its conjectures. Recently, the French mathematician Laurent Fargues proposed a way to build on Scholze’s work to understand aspects of the Langlands program concerned with p-adics. It is rumoured that a partial solution could appear in time for the Rio meeting.

In March, Langlands won the other great mathematical award, the Abel prize, for his lifetime’s work. “It took a long time for the importance of Langlands’s ideas to be recognised,” says Caraiani, “and they were overdue for a major award.” Scholze seems unlikely to have to wait so long.

The p-adics: A different way of doing numbers

Key to the latest work in unifying arithmetic and geometry are p-adic numbers.

These are an alternative way of representing numbers in terms of any given prime number p. To make a p-adic number from any positive integer, for example, you write that number in base p, and reverse it. So to write 20 in 2-adic form, say, you take its binary, or base-2, representation – 10100 – and write it backwards, 00101. Similarly 20’s 3-adic equivalent is 202, and as a 4-adic it is written 011.

The rules for manipulating p-adics are a little different, too. Most notably, numbers become closer as their difference grows more divisible by whatever p is. In the 5-adic numbers, for example, the equivalents of 11 and 36 are very close because their difference is divisible by 5, whereas the equivalents of 10 and 11 are further apart.

For decades after their invention in the 1890s, the p-adics were just a pretty mathematical toy: fun to play with, but of no practical use. But in 1920, the German mathematician Helmut Hasse came across the concept in a pamphlet in a second-hand bookshop, and became fascinated. He realised that the p-adics provided a way of harnessing the unfactorisability of the primes – the fact they can’t be divided by other numbers – that turned into a shortcut to solving complicated proofs.

Since then, p-adics have played a pivotal part in the branch of maths called number theory. When Andrew Wiles proved Fermat’s infamous last theorem (that the equation xn + yn = zn has no solutions when x, y and z are positive integers and n is an integer greater than 2) in the early 1990s, practically every step in the proof involved p-adic numbers.

  • Answers: Zoe will be three times as old as she is now. The farmers should draw a line across the field that connects the centre points of the field and the crop.

This article appeared in print under the headline “The shape of numbers”

For more such insights, log into www.international-maths-challenge.com.

*Credit for article given to Gilead Amit*


Commutative Diagrams Explained

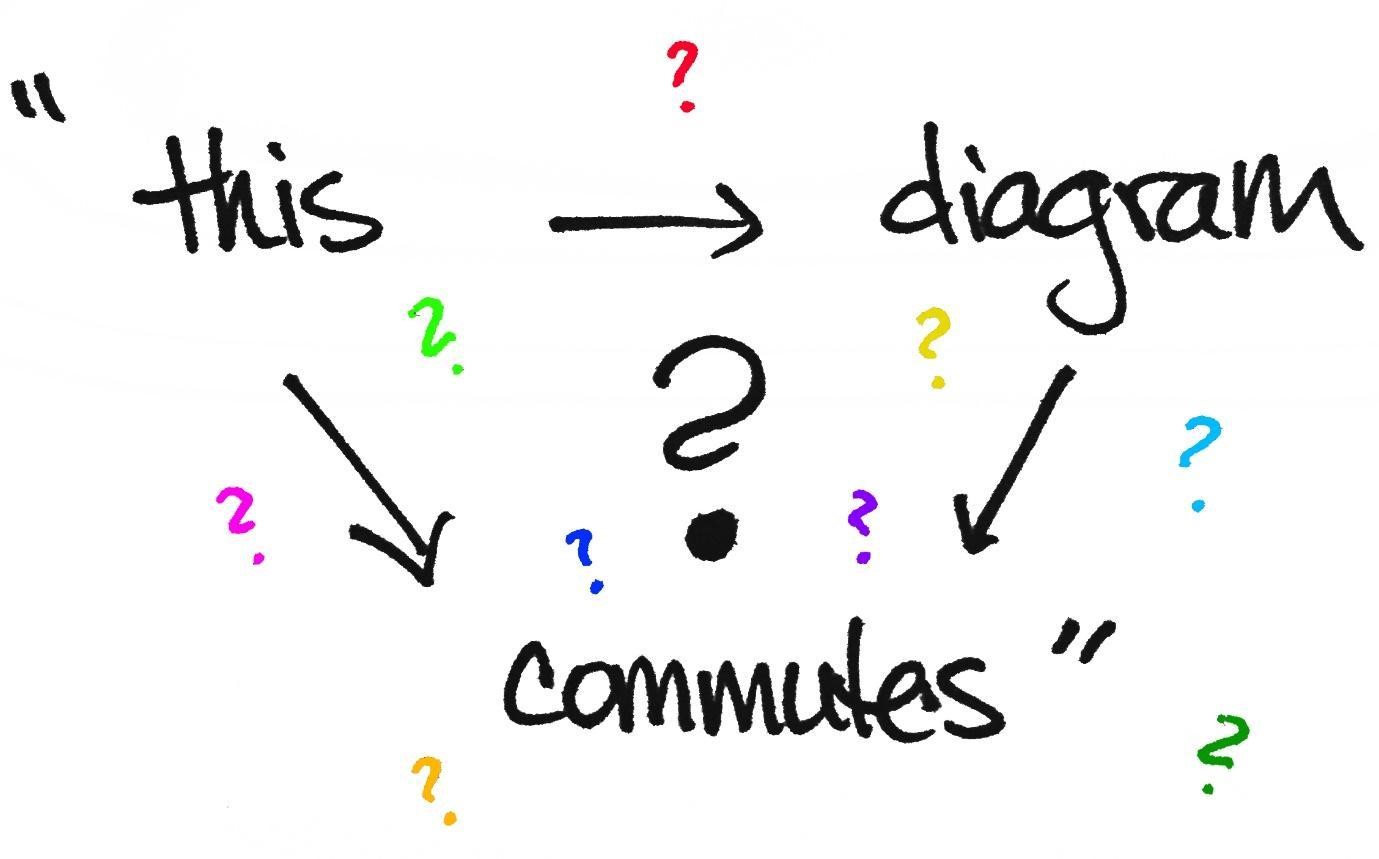
Have you ever come across the words “commutative diagram” before? Perhaps you’ve read or heard someone utter a sentence that went something like

“For every [bla bla] there existsa [yadda yadda] such that the following diagram commutes.”

and perhaps it left you wondering what it all meant. I was certainly mystified when I first came across a commutative diagram. And it didn’t take long to realize that the phrase “the following diagram commutes” was (and is) quite ubiquitous. It appears in theorems, propositions, lemmas and corollaries almost everywhere!

So what’s the big deal with diagrams? And what does commute mean anyway?? It turns out the answer is quite simple.

Do you know what a composition of two functions is?

Then you know what a commutative diagram is!

A commutative diagram is simply the picture behind function composition.

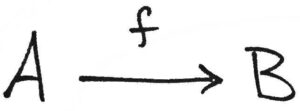
Truly, it is that simple. To see this, suppose AA and BB are sets and ff is a function from AA to BB. Since ff maps (i.e. assigns) elements in AA to elements in BB, it is often helpful to denote that process by an arrow.

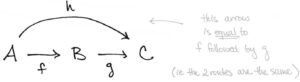
And there you go. That’s an example of a diagram. But suppose we have another function gg from sets BB to CC, and suppose ff and gg are composable. Let’s denote their composition by h=g∘fh=g∘f. Then both gg and hh can be depicted as arrows, too.

But what is the arrow A→CA→C really? I mean, really? Really it’s just the arrows ff and gg lined up side-by-side.

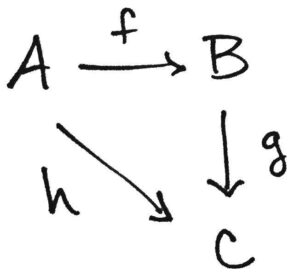
But maybe we think that drawing hh’s arrow curved upwards like that takes up too much space, so let’s bend the diagram a bit and redraw it like this:

This little triangle is the paradigm example of a commutative diagram. It’s a diagram because it’s a schematic picture of arrows that represent functions. And it commutes because the diagonal function IS EQUAL TO the composition of the vertical and horizontal functions, i.e. h(a)=g(f(a))h(a)=g(f(a)) for every a∈Aa∈A. So a diagram “commutes” if all paths that share a common starting and ending point are the same. In other words, your diagram commutes if it doesn’t matter how you commute from one location to another in the diagram.

But be careful.

Not every diagram is a commutative diagram.

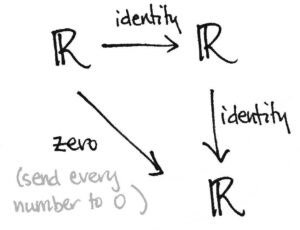
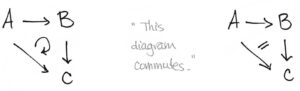
The picture on the right is a bona fide diagram of real-valued functions, but it is defintitely not commutative. If we trace the number 11 around the diagram, it maps to 00 along the diagonal arrow, but it maps to 11 itself if we take the horizontal-then-vertical route. And 0≠10≠1. So to indicate if/when a given diagram is commutative, we have to say it explicitly. Or sometimes folks will use the symbols shown below to indicate commutativity:

‍

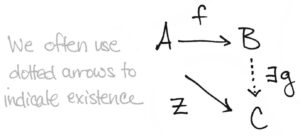
I think now is a good time to decode another phrase that often accompanies the commutative-diagram parlance. Returning to our f,g,hf,g,h example, we assumed that f,gf,g and h=g∘fh=g∘f already existed. But suppose we only knew about the existence of f:A→Bf:A→B and some other map, say, z:A→Cz:A→C. Then we might like to know, “Does there exist a map g:B→Cg:B→C such that z=g∘fz=g∘f? Perhaps the answer is no. Or perhaps the answer is yes, but only under certain hypotheses.* Well, if such a gg does exists, then we’ll say “…there exists a map gg such that the following diagram commutes:

but folks might also say

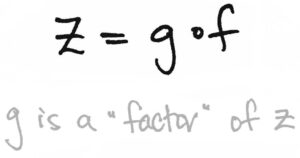
“…there exists a map gg such that zz factors through gg”

The word “factors” means just what you think it means. The diagram commutes if and only if z=g∘fz=g∘f, and that notation suggests that we may think of gg as a factor of zz, analogous to how 22 is a factor of 66 since 6=2⋅36=2⋅3.

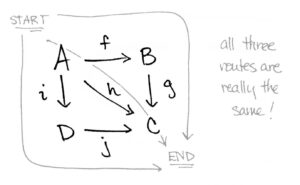
By the way, we’ve only chatted about sets and functions so far, but diagrams make sense in any context in which you have mathematical objects and arrows. So we can talk about diagrams of groups and group homomorphisms, or vector spaces and linear transformations, or topological spaces and continuous maps, or smooth manifolds and smooth maps, or functors and natural transformations and so on. Diagrams make sense in any category. And as you can imagine, there are more complicated diagrams than triangular ones. For instance, suppose we have two more maps i:A→Di:A→D and j:D→Cj:D→C such that hh is equal to not only g∘fg∘f but also j∘ij∘i. Then we can express the equality g∘f=h=j∘ig∘f=h=j∘i by a square:

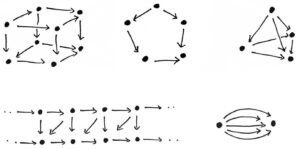
Again, commutativity simply tells us that the three ways of getting from AA to CC are all equivalent. And diagrams can get really crazy and involve other shapes too. They can even be three-dimensional! Here are some possibilities where I’ve used bullets in lieu of letters for the source and target of the arrows.

No matter the shape, the idea is the same: Any map can be thought of as a path or a process from AA to BB, from start to finish. And we use diagrams to capitalize on that by literally writing down “AA” and “BB” (or “∙∙” and “∙∙”) and by literally drawing a path—in the form of an arrow—between them.


For more such insights, log into www.international-maths-challenge.com.

*Credit for article given to Tai-Danae Bradley*


Some Notes on Taking Notes

I am often asked the question, “How do you do it?!” Now while I don’t think my note-taking strategy is particularly special, I am happy to share! I’ll preface the information by stating what you probably already know: I LOVE to write.* I am a very visual learner and often need to go through the physical act of writing things down in order for information to “stick.” So while some people think aloud (or quietly),

I think on paper.

My study habits, then, are built on this fact. Of course not everyone learns in this way, so this post is not intended to be a how-to guide. It’s just a here’s-what-I-do guide.

With that said, below is a step-by-step process I tried to follow during my final years of undergrad and first two years of grad school.**

‍Step 1

Read the appropriate chapter/section in the book before class

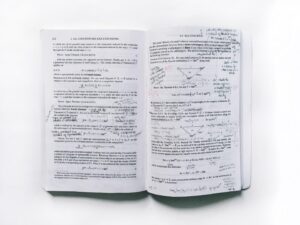
I am an “active reader,” so my books have tons of scribbles, underlines, questions, and “aha” moments written on the pages. I like to write while I read because it gives me time to pause and think about the material. For me, reading a mathematical text is not like reading a novel. It often takes me a long time just to understand a single paragraph! Or a single sentence. I also like to mark things that I don’t understand so I’ll know what to look for in the upcoming lecture.

STEP 2

Attend lecture and take notes

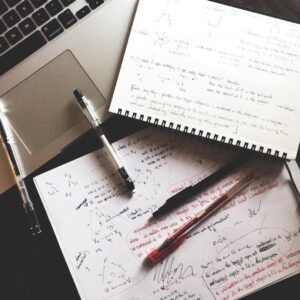
This step is pretty self-explanatory, but I will mention this: I write down much more than what is written on the chalkboard (or whiteboard). In fact, a good portion of my in-class notes consists of what the professor has said but hasn’t written.

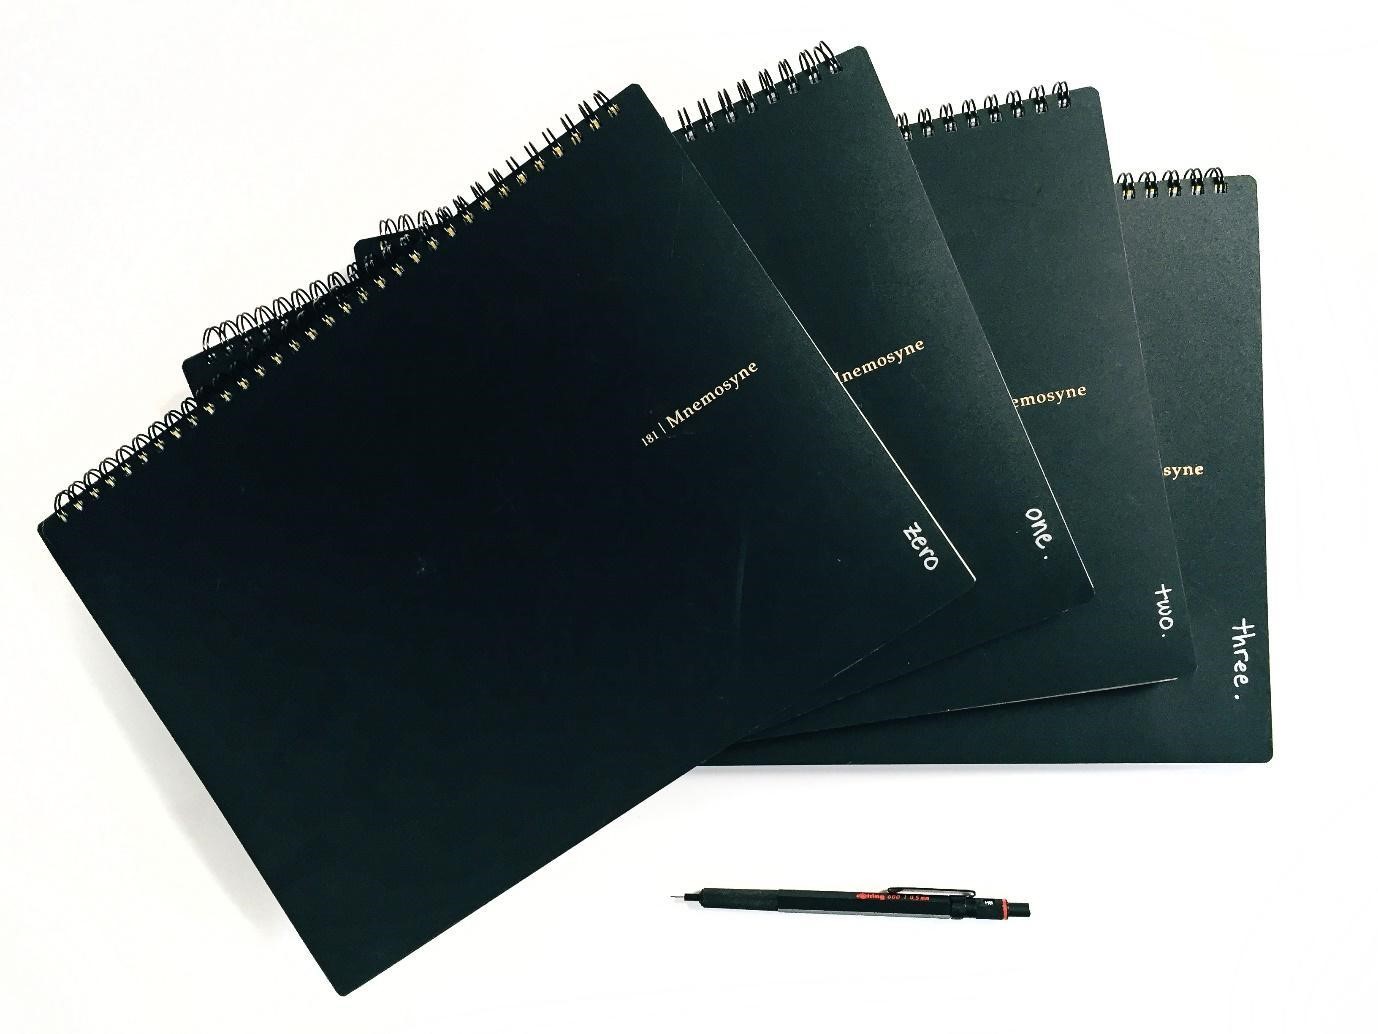
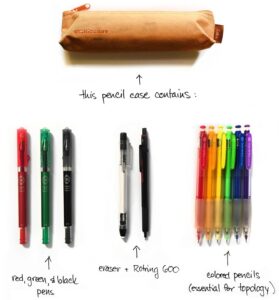
‍My arsenal

‍STEP 3

Rewrite lecture notes at home

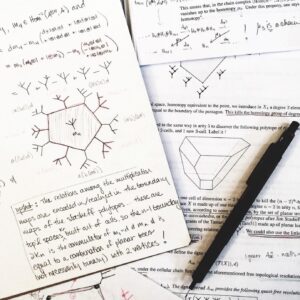
My in-class notes are often an incomprehensible mess of frantically-scribbled hieroglyphs. So when I go home, I like to rewrite everything in a more organized fashion. This gives the information time to simmer and marinate in my brain. I’m able to ponder each statement at my own pace, fill in any gaps, and/or work through any exercises the professor might have suggested. I’ll also refer back to the textbook as needed.

Sometimes while rewriting these notes, I’ll copy things word-for-word (either from the lecture, the textbook, or both), especially if the material is very new or very dense. Although this can be redundant, it helps me slow down and lets me think about what the ideas really mean. Other times I’ll just rewrite things in my own words in a way that makes sense to me.

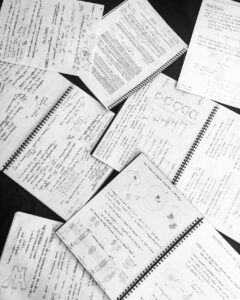
A semester’s worth of notes!


As for the content itself, my notes usually follow a “definition then theorem then proof” outline, simply because that’s how material is often presented in the lecture. But sometimes it’s hard to see the forest for the trees (i.e. it’s easy to get lost in the details), so I’ll occasionally write “PAUSE!” or “KEY IDEA!” in the middle of the page. I’ll then take the time to write a mini exposition that summarizes the main idea of the previous pages. I’ve found this to be especially helpful when looking back at my notes after several months (or years) have gone by. I may not have time to read all the details/calculations, so it’s nice to glance at a summary for a quick refresher.

And every now and then, I’ll rewrite my rewritten notes in the form of a SaiBlog post! Many of my earlier posts here at Math3ma were “aha” moments that are now engrained in my brain because I took the time to SaiBlog about them.

STEP 4

Do homework problems

Once upon a time, I used to think the following:

How can I do problems if I haven’t spent a bajillion hours learning the theory first?

But now I believe there’s something to be said for the converse: 

How can I understand the theory if I haven’t done a bajillion examples first?

In other words, taking good notes and understanding theory is one thing, but putting that theory into practice is a completely different beast. As a wise person once said, “The only way to learn math is to DO math.” So although I’ve listed “do homework problems” as the last step, I think it’s really first in terms of priority.

Typically, then, I’ll make a short to-do list (which includes homework assignments along with other study-related duties) each morning. And I’ll give myself a time limit for each task. For example, something like “geometry HW, 3 hours” might appear on my list, whereas “do geometry today” will not. Setting a time gives me a goal to reach for which helps me stay focused. And I may be tricking my brain here, but a specific, three-hour assignment sounds much less daunting than an unspecified, all-day task. (Of course, my lists always contain multiple items that take several hours each, but as the old adage goes, “How do you eat an elephant? One bite at a time.”)

By the way, in my first two years of grad school I often worked with my classmates on homework problems. I didn’t do this in college, but in grad school I’ve found it tricky to digest all the material alone – there’s just too much of it! So typically I’d first attempt exercises on my own, then meet up with a classmate or two to discuss our ideas and solutions and perhaps attend office hours with any questions.

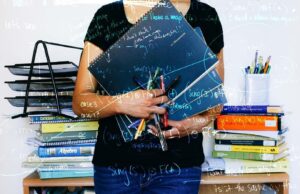
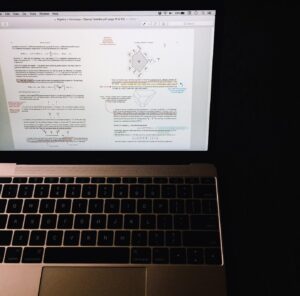
As far as storage goes, I have a huge binder that contains all of my rewritten notes*** from my first and second year classes. (I use sheet protectors to keep them organized according to subject.) On the other hard, I use a paper tray like this one to store my lecture notes while the semester is in progress. Once classes are over, I’ll scan and save them to an external hard drive. I’ve also scanned and saved all my homework assignments.

Well, I think that’s about it! As I mentioned earlier, these steps were only my ideal plan. I often couldn’t apply them to every class — there’s just not enough time! — so I’d only do it for my more difficult courses. And even then, there might not be enough time for steps 1 and 3, and I’d have to start working on homework right after a lecture.

But as my advisor recently told me,”It’s okay to not know everything.” Indeed, I think the main thing is to just do something. Anything. As much as you can. And as time goes on, you realize you really are learning something, even if it doesn’t feel like it at the time.

Alright, friends, I think that’s all I have to share. I hope it was somewhat informative. If you have any questions, don’t hesitate to leave it in a comment below!

For more such insights, log into www.international-maths-challenge.com.

*Credit for article given to Tai-Danae Bradley*