Venn: The man behind the famous diagrams, and why his work still matters today

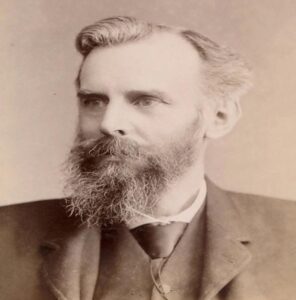
April 2023 marks the 100th anniversary of the death of mathematician and philosopher John Venn. You may well be familiar with Venn diagrams—the ubiquitous pictures of typically two or three intersecting circles, illustrating the relationships between two or three collections of things.

For example, during the pandemic, Venn diagrams helped to illustrate symptoms of COVID-19 that are distinct from seasonal allergies. They are also often taught to school children and are typically part of the early curriculum for logic and databases in higher education.

Venn was born in Hull, UK, in 1834. His early life in Hull was influenced by his father, an Anglican priest—it was expected John would follow in his footstep. He did initially begin a career in the Anglican church, but later moved into academia at the University of Cambridge.

One of Venn’s major achievements was to find a way to visualize a mathematical area called set theory. Set theory is an area of mathematics which can help to formally describe properties of collections of objects.

For example, we could have a set of cars, C. Within this set, there could be subsets such as the set of electric cars, E, the set of petrol based cars, say P, and the set of diesel powered cars, D. Given these, we can operate on them, for example, to apply car charges to the sets P and D, and a discount to the set E.

These sorts of operations form the basis of databases, as well as being used in many fundamental areas of science. Other major works of Venn’s include probability theory and symbolic logic. Venn had initially used diagrams developed by the Swiss mathematician Leonard Euler to show some relationships between sets, which he then developed into his famous Venn diagrams.

Venn used the diagrams to prove a form of logical statement known as a categorical syllogism. This can be used to model reasoning. Here’s an example: “All computers need power. All AI systems are computers.” We can chain these together to the conclusion that “all AI systems need power.”

Today, we are familiar with such reasoning to illustrate how different collections relate to each other. For example, the SmartArt tool in Microsoft products lets you create a Venn diagram to illustrate the relationships between different sets. In our earlier car example, we could have a diagram showing electric cars, E, and petrol powered cars, P. The set of hybrid cars that have a petrol engine would be in the intersection of P and E.

Logic and computing

The visualization of sets (and databases) is helpful, but the importance of Venn’s work then—and now—is the way they allowed proof of George Boole’s ideas of logic as a formal science.

Venn used his diagrams to illustrate and explore such “symbolic logic”—defending and extending it. Symbolic logic underpins modern computing, and Boolean logic is a key part of the design of modern computer systems—making his work relevant today.

Venn’s work was also crucial to the work of philosopher Bertrand Russell, showing that there are problems that are unsolvable. We can express such problems with sets, in which each is an unsolvable problem. One such unsolvable problem can be expressed with the “Barber paradox.” Suppose we had an article in Wikipedia containing all the articles that don’t contain themselves—a set. Is this new article itself in that set?

Luckily we can visualize that with a Venn diagram with two circles, where one circle is the set of entries that don’t include themselves, A, and the other circle is the set of entries that do include themselves, B.

We can then ask the question: where do we put the article that contains all the articles that don’t contain themselves? Have a think about it, then see where you would put it.

The problem is that it cannot be on the left, as it would contain itself, and would therefore be inconsistent. And it cannot be on the right, as then it would be missing, or incomplete. And it can’t be in both. It must be in one or the other. This paradox illustrates how unsolvable statements can arise—they are valid in terms of expressing them within the logical system, but ultimately unanswerable. We could possibly extend our system to solve this, but then we would end up with another unanswerable question.

Venn’s diagrams were crucial in understanding this. And this area of science is still important, for example when considering the limitations of machine learning and AI, where we may ask questions that cannot be answered.

Venn also had an interest in building mechanical machines—including a bowling machinewhich proved so effective it was able to bowl out some top Australian batsmen of the day.

Following his abstract work on logic, he developed the concept of a logical-diagram machine with a lot of processing power: though this brilliant idea from 1881 would take many decades to appear as modern computers.

We remember Venn here in Hull, with a bridge close to his birthplace decorated with Venn circle inspired artwork. At the University of Hull’s main administration building, there’s an intersection of management and academia which is called the Venn building.

For more such insights, log into our website https://international-maths-challenge.com

Credit of the article given to Neil Gordon, The Conversation


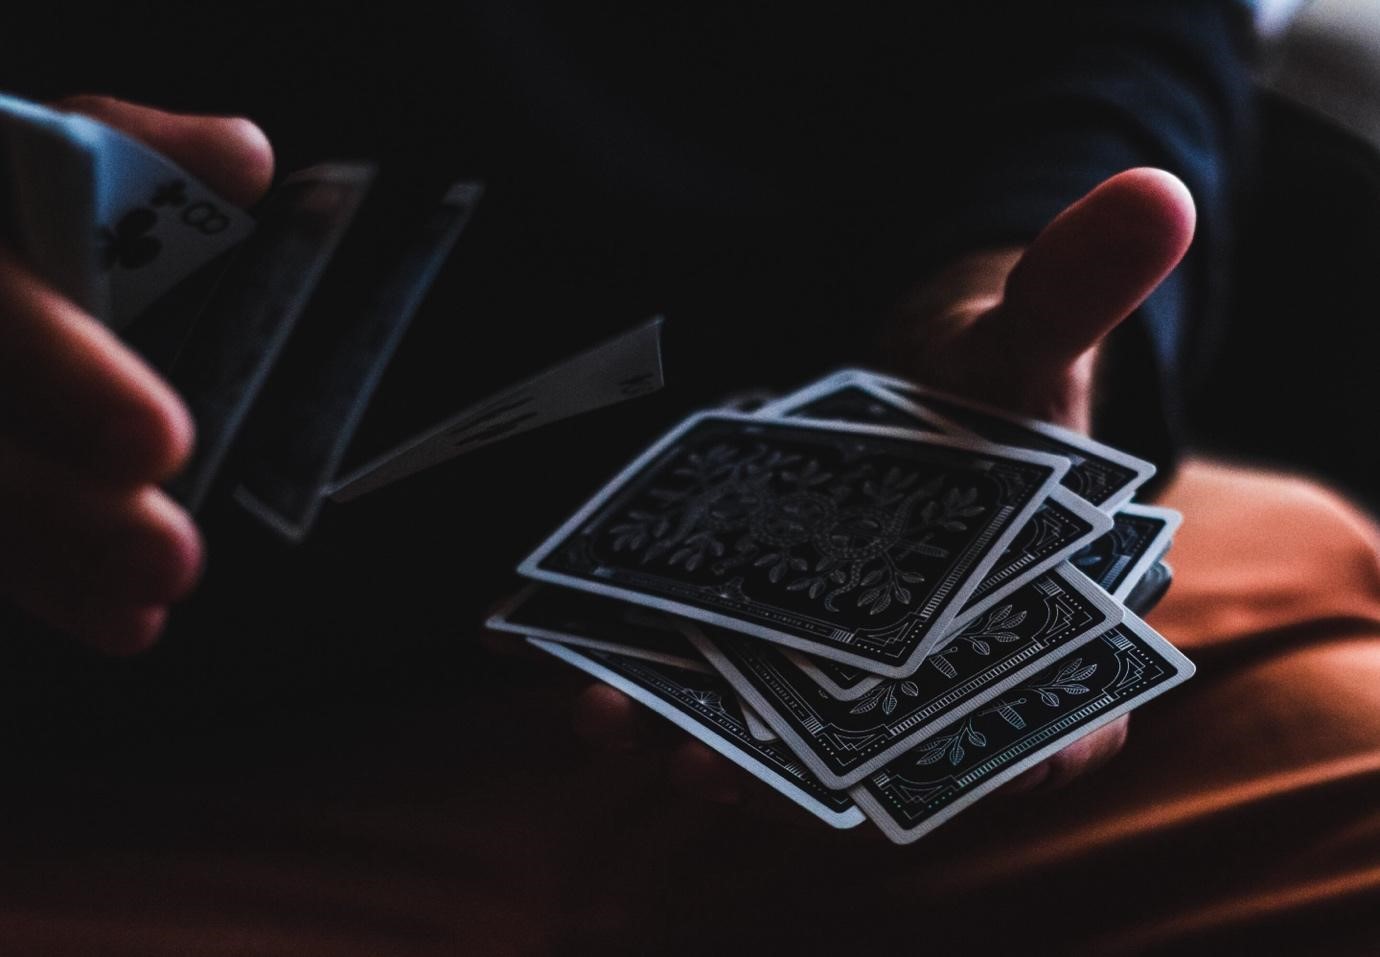
Expert reveals the fascinating link between math and card shuffling

Mathematics sometimes impacts our lives in seemingly unsuspecting ways, including card shuffling.

Math can answer the age-old question of how many times a deck of cards needs to be shuffled to ensure the cards are thoroughly mixed. It can even reveal the best method for dealing cards.

Jason Fulman, professor of mathematics at the USC Dornsife College of Letters, Arts and Sciences, studies card shuffling using math. He shares what is known on the topic in an upcoming book, “The Mathematics of Shuffling Cards” (American Mathematical Society), which he co-wrote with acclaimed mathematician Persi Diaconis. The book is due out in June.

Card shuffling is a numbers game

Among the many insights Fulman provides is that the number of shuffles required to thoroughly mix a deck of 52 cards depends on the shuffle type used.

The riffle shuffle—splitting the deck roughly in half then using the thumbs to quickly interleave the cards—is the most efficient. It requires just seven shuffles to mix a deck well.

Scattering the cards out flat on the table and randomly spreading them over each other, called “smooshing,” requires 30 to 60 seconds for thorough mixing.

The overhand method—taking sections of a stacked deck and moving them over to make a new stack—must be repeated a whopping 10,000 times to mix the cards well.

What the cards are being used for makes a difference, too. In blackjack, for example, card suits don’t matter, and certain cards are equivalent, so just four or five riffle shuffles are plenty for mixing.

Then there’s magic. Perfect shuffles can restore a deck to its original order, and specific sequences of shuffles can move a card to a desired position, enabling a magician to control the cards in a way that seems magical.

For mathematicians, fairness is a big deal

Fulman also explores card dealing, a key to ensuring fairness in card games.

Two commonly used methods of card dealing are the cyclic method and back-and-forth. In the cyclic method, cards are dealt in a repeating sequence such as one, two, three, four, one, two, three, four. Back-and-forth uses alternating directions such as one, two, three, four followed by four, three, two, one.

Back and forth dealing is faster and improves the cards’ randomness, thus requiring fewer shuffles for a well-mixed deck.

Card shuffling is not just fun and games

Card shuffling has practical applications beyond card games, magic tricks and gambling.

Analysing the mixing time of shuffling helps computer scientists determine the optimal distribution of files and folders in databases. And biologists have considered the mixing time of shuffles to study the order of genes, which can help them estimate the evolutionary distance between two organisms, Fulman says.

Studying “patience sorting,” dealing cards into piles, sheds light on passenger airline boarding, and researchers study card shuffling in hopes of understanding and improving traffic flow.

But mathematicians still puzzle over many questions about card shuffling, Fulman says.

For instance, they want to know the number of shuffles required to thoroughly mix a deck using the almost perfect shuffle technique employed by Las Vegas casino dealers, who perform “neater” riffle shuffles achieving near-perfect alternation from one hand to the other.

They also remain stumped by the optimal guessing strategy to maximize the expected number of correct guesses when turning up cards one at a time after a series of riffle shuffles. An answer to this question is also of interest to gamblers, who want to be able to guess as many correct cards as possible, and to casino executives, who want gamblers to be able to guess as few correct cards as possible.

But given enough time, the odds are that mathematicians like Fulman will sort out these and many other card-shuffling conundrums.

For more such insights, log into our website https://international-maths-challenge.com

Credit of the article given to Ileana Wachtel, University of Southern California


Punctuation in literature of major languages is intriguingly mathematical

A moment’s hesitation… Yes, a full stop here—but shouldn’t there be a comma there? Or would a hyphen be better? Punctuation can be a nuisance; it is often simply neglected. Wrong! The most recent statistical analyses paint a different picture: punctuation seems to “grow out” of the foundations shared by all the (examined) languages, and its features are far from trivial.

To many, punctuation appears as a necessary evil, to be happily ignored whenever possible. Recent analyses of literature written in the world’s current major languages require us to alter this opinion. In fact, the same statistical features of punctuation usage patterns have been observed in several hundred works written in seven, mainly Western, languages.

Punctuation, all ten representatives of which can be found in the introduction to this text, turns out to be a universal and indispensable complement to the mathematical perfection of every language studied. Such a remarkable conclusion about the role of mere commas, exclamation marks or full stops comes from an article by scientists from the Institute of Nuclear Physics of the Polish Academy of Sciences (IFJ PAN) in Cracow, published in the journal Chaos, Solitons & Fractals.

“The present analyses are an extension of our earlier results on the multifractal features of sentence length variation in works of world literature. After all, what is sentence length? It is nothing more than the distance to the next specific punctuation mark— the full stop. So now we have taken all punctuation marks under a statistical magnifying glass, and we have also looked at what happens to punctuation during translation,” says Prof. Stanislaw Drozdz (IFJ PAN, Cracow University of Technology).

Two sets of texts were studied. The main analyses concerning punctuation within each language were carried out on 240 highly popular literary works written in seven major Western languages: English (44), German (34), French (32), Italian (32), Spanish (32), Polish (34) and Russian (32). This particular selection of languages was based on a criterion: the researchers assumed that no fewer than 50 million people should speak the language in question, and that the works written in it should have been awarded no fewer than five Nobel Prizes for Literature.

In addition, for the statistical validity of the research results, each book had to contain at least 1,500 word sequences separated by punctuation marks. A separate collection was prepared to observe the stability of punctuation in translation. It contained 14 works, each of which was available in each of the languages studied (two of the 98 language versions, however, were omitted due to their unavailability).

In total, authors in both collections included such writers as Conrad, Dickens, Doyle, Hemingway, Kipling, Orwell, Salinger, Woolf, Grass, Kafka, Mann, Nietzsche, Goethe, La Fayette, Dumas, Hugo, Proust, Verne, Eco, Cervantes, Sienkiewicz or Reymont.

The attention of the Cracow researchers was primarily drawn to the statistical distribution of the distance between consecutive punctuation marks. It soon became evident that in all the languages studied, it was best described by one of the precisely defined variants of the Weibull distribution.

A curve of this type has a characteristic shape: it grows rapidly at first and then, after reaching a maximum value, descends somewhat more slowly to a certain critical value, below which it reaches zero with small and constantly decreasing dynamics. The Weibull distribution is usually used to describe survival phenomena (e.g. population as a function of age), but also various physical processes, such as increasing fatigue of materials.

“The concordance of the distribution of word sequence lengths between punctuation marks with the functional form of the Weibull distribution was better the more types of punctuation marks we included in the analyses; for all marks the concordance turned out to be almost complete. At the same time, some differences in the distributions are apparent between the different languages, but these merely amount to the selection of slightly different values for the distribution parameters, specific to the language in question. Punctuation thus seems to be an integral part of all the languages studied,” notes Prof. Drozdz.

After a moment he adds with some amusement: “…and since the Weibull distribution is concerned with phenomena such as survival, it can be said with not too much tongue-in-cheek that punctuation has in its nature a literally embedded struggle for survival.”

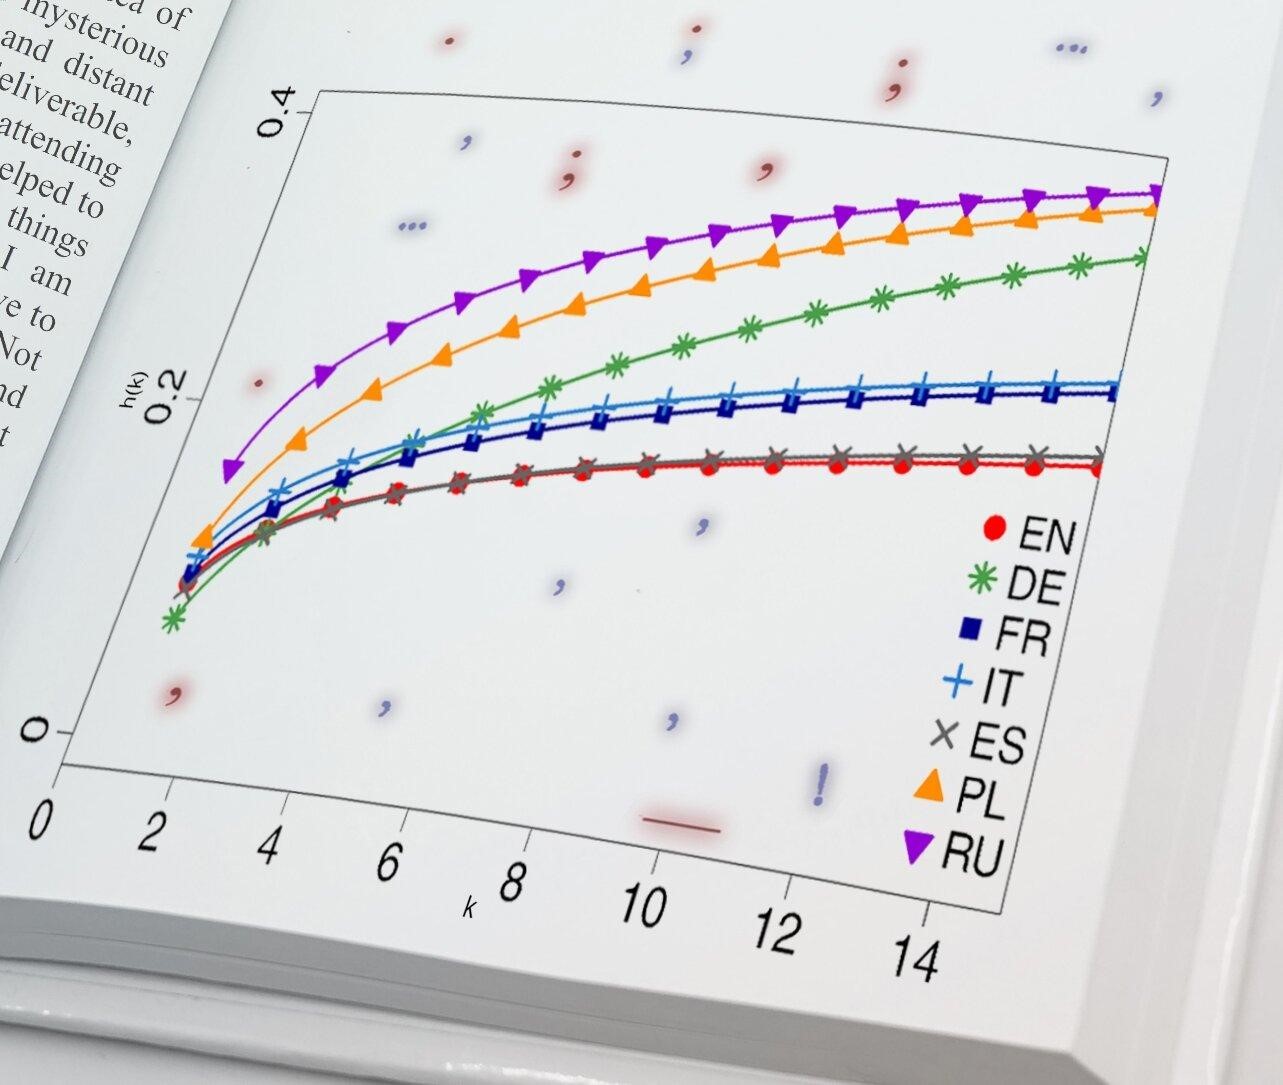
The next stage of the analyses consisted of determining the hazard function. In the case of punctuation, it describes how the conditional probability of success—i.e., the probability of the next punctuation mark—changes if no such mark has yet appeared in the analysed sequence.

The results here are clear: the language characterized by the lowest propensity to use punctuation is English, with Spanish not far behind; Slavic languages proved to be the most punctuation-dependent. The hazard function curves for punctuation marks in the six languages studied appeared to follow a similar pattern, they differed mainly in vertical shift.

German proved to be the exception. Its hazard function is the only one that intersects most of the curves constructed for the other languages. German punctuation thus seems to combine the punctuation features of many languages, making it a kind of Esperanto punctuation.

The above observation dovetails with the next analysis, which was to see whether the punctuation features of original literary works can be seen in their translations. As expected, the language most faithfully transforming punctuation from the original language to the target language turned out to be German.

In spoken communication, pauses can be justified by human physiology, such as the need to catch one’s breath or to take a moment to structure what is to be said next in one’s mind. And in written communication?

“Creating a sentence by adding one word after another while ensuring that the message is clear and unambiguous is a bit like tightening the string of a bow: it is easy at first, but becomes more demanding with each passing moment. If there are no ordering elements in the text (and this is the role of punctuation), the difficulty of interpretation increases as the string of words lengthens. A bow that is too tight can break, and a sentence that is too long can become unintelligible. Therefore, the author is faced with the necessity of ‘freeing the arrow’, i.e. closing a passage of text with some sort of punctuation mark. This observation applies to all the languages analysed, so we are dealing with what could be called a linguistic law,” states Dr. Tomasz Stanisz (IFJ PAN), first author of the article in question.

Finally, it is worth noting that the invention of punctuation is relatively recent—punctuation marks did not occur at all in old texts. The emergence of optimal punctuation patterns in modern written languages can therefore be interpreted as the result of their evolutionary advancement. However, the excessive need for punctuation is not necessarily a sign of such sophistication.

English and Spanish, contemporarily the most universal languages, appear, in the light of the above studies, to be less strict about the frequency of punctuation use. It is likely that these languages are so formalized in terms of sentence construction that there is less room for ambiguity that would need to be resolved with punctuation marks.

For more such insights, log into our website https://international-maths-challenge.com

Credit of the article given to The Henryk Niewodniczanski Institute of Nuclear Physics Polish Academy of Sciences

Declines in math readiness underscore the urgency of math awareness

When President Ronald Reagan proclaimed the first National Math Awareness Week in April 1986, one of the problems he cited was that too few students were devoted to the study of math.

“Despite the increasing importance of mathematics to the progress of our economy and society, enrollment in mathematics programs has been declining at all levels of the American educational system,” Reagan wrote in his proclamation.

Nearly 40 years later, the problem that Reagan lamented during the first National Math Awareness Week—which has since evolved to become “Mathematics and Statistics Awareness Month”—not only remains but has gotten worse.

Whereas 1.63%, or about 16,000, of the nearly 1 million bachelor’s degrees awarded in the U.S. in the 1985–1986 school year went to math majors, in 2020, just 1.4%, or about 27,000, of the 1.9 million bachelor’s degrees were awarded in the field of math—a small but significant decrease in the proportion.

Post-pandemic data suggests the number of students majoring in math in the U.S. is likely to decrease in the future.

A key factor is the dramatic decline in math learning that took place during the lockdown. For instance, whereas 34% of eighth graders were proficient in math in 2019, test data shows the percentage dropped to 26% after the pandemic.

These declines will undoubtedly affect how much math U.S. students can do at the college level. For instance, in 2022, only 31% of graduating high school seniors were ready for college-level math—down from 39% in 2019.

These declines will also affect how many U.S. students are able to take advantage of the growing number of high-paying math occupations, such as data scientists and actuaries. Employment in math occupations is projected to increase by 29% in the period from 2021 to 2031.

About 30,600 math jobs are expected to open up per year from growth and replacement needs. That exceeds the 27,000 or so math graduates being produced each year—and not all math degree holders go into math fields. Shortages will also arise in several other areas, since math is a gateway to many STEM fields.

For all of these reasons and more, as a mathematician who thinks deeply about the importance of math and what it means to our world—and even to our existence as human beings—I believe this year, and probably for the foreseeable future, educators, policymakers and employers need to take Mathematics and Statistics Awareness Month more seriously than ever before.

Struggles with mastery

Subpar math achievement has been endemic in the U.S. for a long time.

Data from the National Assessment of Educational Progress shows that no more than 26% of 12th graders have been rated proficient in math since 2005.

The pandemic disproportionately affected racially and economically disadvantaged groups. During the lockdown, these groups had less access to the internet and quiet studying spaces than their peers. So securing Wi-Fi and places to study are key parts of the battle to improve math learning.

Some people believe math teaching techniques need to be revamped, as they were through the Common Core, a new set of educational standards that stressed alternative ways to solve math problems. Others want a return to more traditional methods. Advocates also argue there is a need for colleges to produce better-prepared teachers.

Other observers believe the problem lies with the “fixed mindset” many students have—where failure leads to the conviction that they can’t do math—and say the solution is to foster a “growth” mindset—by which failure spurs students to try harder.

Although all these factors are relevant, none address what in my opinion is a root cause of math underachievement: our nation’s ambivalent relationship with mathematics.

Low visibility

Many observers worry about how U.S. children fare in international rankings, even though math anxiety makes many adults in the U.S. steer clear of the subject themselves.

Mathematics is not like art or music, which people regularly enjoy all over the country by visiting museums or attending concerts. It’s true that there is a National Museum of Mathematics in New York, and some science centers in the U.S. devote exhibit space to mathematics, but these can be geographically inaccessible for many.

A 2020 study on media portrayals of math found an overall “invisibility of mathematics” in popular culture. Other findings were that math is presented as being irrelevant to the real world and of little interest to most people, while mathematicians are stereotyped to be singular geniuses or socially inept nerds, and white and male.

Math is tough and typically takes much discipline and perseverance to succeed in. It also calls for a cumulative learning approach—you need to master lessons at each level because you’re going to need them later.

While research in neuroscience shows almost everyone’s brain is equipped to take up the challenge, many students balk at putting in the effort when they don’t score well on tests. The myth that math is just about procedures and memorization can make it easier for students to give up. So can negative opinions about math ability conveyed by peers and parents, such as declarations of not being “a math person.”

A positive experience

Here’s the good news. A 2017 Pew poll found that despite the bad rap the subject gets, 58% of U.S. adults enjoyed their school math classes. It’s members of this legion who would make excellent recruits to help promote April’s math awareness. The initial charge is simple: Think of something you liked about math—a topic, a puzzle, a fun fact—and go over it with someone. It could be a child, a student, or just one of the many adults who have left school with a negative view of math.

Can something that sounds so simplistic make a difference? Based on my years of experience as a mathematician, I believe it can—if nothing else, for the person you talk to. The goal is to stimulate curiosity and convey that mathematics is much more about exhilarating ideas that inform our universe than it is about the school homework-type calculations so many dread.

Raising math awareness is a first step toward making sure people possess the basic math skills required not only for employment, but also to understand math-related issues—such as gerrymandering or climate change—well enough to be an informed and participating citizen. However, it’s not something that can be done in one month.

Given the decline in both math scores and the percentage of students studying math, it may take many years before America realizes the stronger relationship with math that President Reagan’s proclamation called for during the first National Math Awareness Week in 1986.

For more such insights, log into our website https://international-maths-challenge.com

Credit of the article given to Manil Suri, The Conversation


From whiteboard work to random groups, these simple fixes could get students thinking more in maths lessons

Australian students’ performance and engagement in mathematics is an ongoing issue.

International studies show Australian students’ mean performance in maths has steadily declined since 2003. The latest Program for International Student Assessment (PISA) in 2018 showed only 10% of Australian teenagers scored in the top two levels, compared to 44% in China and 37% in Singapore.

Despite attempts to reform how we teach maths, it is unlikely students’ performance will improve if they are not engaging with their lessons.

What teachers, parents, and policymakers may not be aware of is research shows students are using “non-thinking behaviours” to avoid engaging with maths.

That is, when your child says they didn’t do anything in maths today, our research shows they’re probably right.

What are non-thinking behaviours?

There are four main non-thinking behaviours. These are:

  • slacking: where there is no attempt at a task. The student may talk or do nothing
  • stalling: where there is no real attempt at a task. This may involve legitimate off-task behaviours, such as sharpening a pencil
  • faking: where a student pretends to do a task, but achieves nothing. This may involve legitimate on-task behaviours such as drawing pictures or writing numbers
  • mimicking: this includes attempts to complete a task and can often involve completing it. It involves referring to others or previous examples.

Peter Liljedahl studied Canadian maths lessons in all years of school, over 15 years. This research found up to 80% of students exhibit non-thinking behaviours for 100% of the time in a typical hour-long lesson.

The most common behaviour was mimicking (53%), reflecting a trend of the teacher doing all the thinking, rather than the students.

It also found when students were given “now you try one” tasks (a teacher demonstrates something, then asks students to try it), the majority of students engaged in non-thinking behaviours.

Australian students are ‘non-thinking’ too

Tracey Muir conducted a smaller-scale study in 2021 with a Year ¾ class.

Some 63% of students were observed engaged in non-thinking behaviours, with slacking and stalling (54%) being the most common. These behaviours included rubbing out, sharpening pencils, and playing with counters, and were especially prevalent in unsupervised small groups.

One explanation for students slacking and stalling is teachers are doing most of the talking and directing, and not providing enough opportunities for students to think.

How can we build “thinking” maths classrooms and reduce the prevalence of non-thinking behaviours?

Here are two research-based ideas.

Form random groups

Often students are placed in groups to work through new skills or lessons. Sometimes these are arranged by the teacher or by the students themselves.

Students know why they have been placed in groups with certain individuals (even if this is not explicitly stated). Here they tend to “live down” to expectations.

If they are with their friends they also tend to distract each other.

Our studies found random groupings improved students’ willingness to collaborate, reduced social stress often caused by self-selecting groups, and increased enthusiasm for mathematics learning.

As one student told us:

“I’m starting to like maths now, and working with random people is better for me so I don’t get off track.”

Get kids to stand up

Classroom learning is often done at desks or sitting on the floor. This encourages passive behaviour and we know from physiology that standing is better than sitting. But we found groups of about three students standing together and working on a whiteboard can promote thinking behaviours. Just the physical act of standing can eliminate slacking, stalling, and faking behaviours. As one student said, “Standing helps me concentrate more because if I’m sitting down I’m just fiddling with stuff, but if I’m standing up, the only thing you can do is write and do maths. ”

The additional strategy of only allowing the student with the pen to record others’ thinking and not their own, has shown to be especially beneficial. As one teacher told us: “The people that don’t have the pen have to do the thinking […] so it’s a real group effort and they don’t have the ability to slack off as much.”

Simple changes can work

While our studies were conducted in maths classrooms, our strategies would be transferable to other discipline areas.

So, while parents and educators may feel concerned about Australia’s declining mathsresults, by introducing simple changes to the classroom, we can ensure students are not only learning and thinking deeply about mathematics, but hopefully, enjoying it, too.

For more such insights, log into our website https://international-maths-challenge.com

Credit of the article given to Tracey Muir and Peter Liljedahl, The Conversation


Statistical Ways of Seeing Things

Have you ever struggled with teaching statistics? Do you and your students share a sense of apprehension when data lessons appear in the scheme of work? You’re not alone. Anecdotally, many teachers tell me that statistics is one of the topics they like teaching the least, and I am no exception to this myself. In my mathematics degree, I took the minimum number of statistics-related courses allowed, following a very poor diet of data at school, and carried this negative association into my teaching. Looking back on my career in the classroom, I did not do a good job of teaching statistics, but having had the luxury of spending many years at Cambridge Mathematics immersed in research from excellent statistics teachers and education academics I now understand why!

So now, of course, the question has been posed. Why is statistics hard to teach well? In part, I believe that it stems from viewing statistics through a mathematical lens – understandably, given that we are delivering it alongside quadratic equations, Pythagoras’ theorem, fractions, decimals and percentages. But while statistical analysis would not exist without the mathematical concepts and techniques underpinning it, we have a tendency within curricula to make the mathematical techniques the whole point, and reduce the statistical analysis part to an afterthought or an added extra. Students find the more subjective analysis hard, so it is tempting to make sure everyone can manage the techniques and then focus on the interpretation as something only the most able have time to spend on (although, there is always the additional temptation to move on to other, more properly ‘maths-y’ topics as soon as possible).

This approach is at odds with how education researchers suggest students should encounter statistical ideas. In the early 1990s, George Cobbi and other researchers recommended that statistics should

  • emphasise statistical thinking,
  • include more real data,
  • encourage the exploration of genuine statistical problems, and
  • reduce emphasis on calculations and techniques.

Since then, much subsequent research has refined these recommendations to account for new technology tools and new ideas, but the core principles have remained the same. In much of my reading of education research, three ways of seeing or interacting with data keep appearing:

·        Data modelling – the idea that data can be used to create models of the world in order to pose and answer questions

·        Informal inference – the idea that data can be used to make predictions about something outside of the data itself with some attempt made to describe how likely the prediction is to be true

·        Exploratory data analysis – the idea that data can be explored, manipulated and represented to identify and make visible patterns and associations that can be interpreted

In the abstract, these ways of seeing, while distinct, have a degree of overlap, and all students may benefit from multiple experiences of all three approaches to data work from their very earliest encounters with data through to advanced-level study.

Imagine the following classroom activity that could be given to very young students (e.g., in primary school). A class of students is given a list of snacks and treats and the students are asked to rank them on a scale of one to five based on how much they like each item. How could this data be worked with through each of the three approaches?

Firstly, we will consider data modelling. Students could be asked to plan a class party with a limited budget. They can buy some but not all of the items listed and must decide what they should buy so that the maximum number of students get to have things they like. In this activity, students must create a model from the data that identifies those things they should buy more of, and those things they should buy least of, along with how many of each thing they should get – perhaps considering these quantities proportionally. This activity uses the data as a model but inevitably requires some assumptions and the creation of some principles. Is the goal to ensure everyone gets the thing they like most? Or is it to minimise the inclusion of the things students like least? What if everyone gets their favourite thing except one student who gets nothing they like?

Secondly, we will think about this as an activity in informal inference. Imagine a new student is joining the class and the class wants to make a welcome pack of a few treats for this student, but they don’t know which treats the student likes. Can they use the data to decide which five items an unknown student is most likely to choose? What if they know some small details about the student; would that additional information allow them to decide based on ‘similar’ students in the class? While the second part of this activity must be handled with a degree of sensitivity, it is an excellent primer for how purchasing algorithms, which are common in online shops, work.

Finally, we turn to exploratory data analysis. In this approach students are encouraged to look for patterns in the data, perhaps by creating representations. This approach may come from asking questions – e.g., do students who like one type of chocolate snacks rate the other chocolate snacks highly too? Is a certain brand of snack popular with everyone in the class? What is the least popular snack? Alternatively, the analysis may generate questions from patterns that are spotted – e.g. why do students seem to rate a certain snack highly? What are the common characteristics of the three most popular snacks?

Each of these approaches could be engaged in as separate and isolated activities, but there is also the scope to combine them and use the results of one approach to inform another. For example, exploratory data analysis may usefully contribute both to model building and inference making and support students’ justifications for their decisions in those activities. Similarly, data modelling activities can be extended into inferential tasks very easily, simply by shifting the use of the model from the population of the data (e.g., the students in the class it was collected from) to some secondary population (e.g., another class in the school, or as in the example, a new student joining the class).

Looking back on my time in the classroom, I wish that my understanding of these approaches and their importance for developing statistical reasoning skills in my students had been better. While not made explicit as important in many curricula, there are ample opportunities to embed these approaches and make them a fundamental part of the statistics teacher’s pedagogy.

Do you currently use any of these approaches in your lessons? Can you see where you might use them in the future? And how might you adapt activities to allow your students opportunities to engage in data modelling, informal inference and exploratory data analysis?

 For more insights like this, visit our website at www.international-maths-challenge.com.

Credit for the article given to Darren Macey


Mathematician Wins Abel Prize For Solving Equations With Geometry

Luis Caffarelli has been awarded the most prestigious prize in mathematics for his work on nonlinear partial differential equations, which have many applications in the real world.

Luis Caffarelli has won the 2023 Abel prize, unofficially called the Nobel prize for mathematics, for his work on a class of equations that describe many real-world physical systems, from melting ice to jet engines.

Caffarelli was having breakfast with his wife when he found out the news. “The breakfast was better all of a sudden,” he says. “My wife was happy, I was happy — it was an emotional moment.”

Based at the University of Texas at Austin, Caffarelli started work on partial differential equations (PDEs) in the late 1970s and has contributed to hundreds of papers since. He is known for making connections between seemingly distant mathematical concepts, such as how a theory describing the smallest possible areas that surfaces can occupy can be used to describe PDEs in extreme cases.

PDEs have been studied for hundreds of years and describe almost every sort of physical process, ranging from fluids to combustion engines to financial models. Caffarelli’s most important work concerned nonlinear PDEs, which describe complex relationships between several variables. These equations are more difficult to solve than other PDEs, and often produce solutions that don’t make sense in the physical world.

Caffarelli helped tackle these problems with regularity theory, which sets out how to deal with problematic solutions by borrowing ideas from geometry. His approach carefully elucidated the troublesome parts of the equations, solving a wide range of problems over his more than four-decade career.

“Forty years after these papers appeared, we have digested them and we know how to do some of these things more efficiently,” says Francesco Maggi at the University of Texas at Austin. “But when they appeared back in the day, in the 80s, these were alien mathematics.”

Many of the nonlinear PDEs that Caffarelli helped describe were so-called free boundary problems, which describe physical scenarios where two objects in contact share a changing surface, like ice melting into water or water seeping through a filter.

“He has used insights that combined ingenuity, and sometimes methods that are not ultra-complicated, but which are used in a manner that others could not see — and he has done that time and time again,” says Thomas Chen at the University of Texas at Austin.

These insights have also helped other researchers translate equations so that they can be solved on supercomputers. “He has been one of the most prominent people in bringing this theory to a point where it’s really useful for applications,” says Maggi.

For more such insights, log into www.international-maths-challenge.com.

*Credit for article given to Alex Wilkins*


Why Maths, Our Best Tool To Describe The Universe, May Be Fallible

Our laws of nature are written in the language of mathematics. But maths itself is only as dependable as the axioms it is built on, and we have to assume those axioms are true.

You might think that mathematics is the most trustworthy thing humans have ever come up with. It is the basis of scientific rigour and the bedrock of much of our other knowledge too. And you might be right. But be careful: maths isn’t all it seems. “The trustworthiness of mathematics is limited,” says Penelope Maddy, a philosopher of mathematics at the University of California, Irvine.

Maddy is no conspiracy theorist. All mathematicians know her statement to be true because their subject is built on “axioms” – and try as they might, they can never prove these axioms to be true.

An axiom is essentially an assumption based on observations of how things are. Scientists observe a phenomenon, formalise it and write down a law of nature. In a similar way, mathematicians use their observations to create an axiom. One example is the observation that there always seems to be a unique straight line that can be drawn between two points. Assume this to be universally true and you can build up the rules of Euclidean geometry. Another is that 1 + 2 is the same as 2 + 1, an assumption that allows us to do arithmetic. “The fact that maths is built on unprovable axioms is not that surprising,” says mathematician Vera Fischer at the University of Vienna in Austria.

These axioms might seem self-evident, but maths goes a lot further than arithmetic. Mathematicians aim to uncover things like the properties of numbers, the ways in which they are all related to one another and how they can be used to model the real world. These more complex tasks are still worked out through theorems and proofs built on axioms, but the relevant axioms might have to change. Lines between points have different properties on curved surfaces than flat ones, for example, which means the underlying axioms have to be different in different geometries. We always have to be careful that our axioms are reliable and reflect the world we are trying to model with our maths.

Set theory

The gold standard for mathematical reliability is set theory, which describes the properties of collections of things, including numbers themselves. Beginning in the early 1900s, mathematicians developed a set of underpinning axioms for set theory known as ZFC (for “Zermelo-Fraenkel”, from two of its initiators, Ernst Zermelo and Abraham Fraenkel, plus something called the “axiom of choice”).

ZFC is a powerful foundation. “If it could be guaranteed that ZFC is consistent, all uncertainty about mathematics could be dispelled,” says Maddy. But, brutally, that is impossible. “Alas, it soon became clear that the consistency of those axioms could be proved only by assuming even stronger axioms,” she says, “which obviously defeats the purpose.”

Maddy is untroubled by the limits: “Set theorists have been proving theorems from ZFC for 100 years with no hint of a contradiction.” It has been hugely productive, she says, allowing mathematicians to create no end of interesting results, and they have even been able to develop mathematically precise measures of just how much trust we can put in theories derived from ZFC.

In the end, then, mathematicians might be providing the bedrock on which much scientific knowledge is built, but they can’t offer cast-iron guarantees that it won’t ever shift or change. In general, they don’t worry about it: they shrug their shoulders and turn up to work like everybody else. “The aim of obtaining a perfect axiomatic system is exactly as feasible as the aim of obtaining a perfect understanding of our physical universe,” says Fischer.

At least mathematicians are fully aware of the futility of seeking perfection, thanks to the “incompleteness” theorems laid out by Kurt Gödel in the 1930s. These show that, in any domain of mathematics, a useful theory will generate statements about this domain that can’t be proved true or false. A limit to reliable knowledge is therefore inescapable. “This is a fact of life mathematicians have learned to live with,” says David Aspero at the University of East Anglia, UK.

All in all, maths is in pretty good shape despite this – and nobody is too bothered. “Go to any mathematics department and talk to anyone who’s not a logician, and they’ll say, ‘Oh, the axioms are just there’. That’s it. And that’s how it should be. It’s a very healthy approach,” says Fischer. In fact, the limits are in some ways what makes it fun, she says. “The possibility of development, of getting better, is exactly what makes mathematics an absolutely fascinating subject.”

HOW BIG IS INFINITY?

Infinity is infinitely big, right? Sadly, it isn’t that simple. We have long known that there are different sizes of infinity. In the 19th century, mathematician Georg Cantor showed that there are two types of infinity. The “natural numbers” (1, 2, 3 and so on forever) are a countable infinity. But between each natural number, there is a continuum of “real numbers” (such as 1.234567… with digits that go on forever). Real number infinities turn out not to be countable. And so, overall, Cantor concluded that there are two types of infinity, each of a different size.

In the everyday world, we never encounter anything infinite. We have to content ourselves with saying that the infinite “goes on forever” without truly grasping conceptually what that means. This matters, of course, because infinities crop up all the time in physics equations, most notably in those that describe the big bang and black holes. You might have expected mathematicians to have a better grasp of this concept, then – but it remains tricky.

This is especially true when you consider that Cantor suggested there might be another size of infinity nestled between the two he identified, an idea known as the continuum hypothesis. Traditionally, mathematicians thought that it would be impossible to decide whether this was true, but work on the foundations of mathematics has recently shown that there may be hope of finding out either way after all.

For more such insights, log into www.international-maths-challenge.com.

*Credit for article given to Michael Brooks*


The Mathematician Who Worked Out How To Time Travel

Mathematics suggested that time travel is physically possible – and Kurt Gödel proved it. Mathematician Karl Sigmund explains how the polymath did it.

The following is an extract from our Lost in Space-Time newsletter. Each month, we hand over the keyboard to a physicist or mathematician to tell you about fascinating ideas from their corner of the universe. You can sign up for Lost in Space-Time for free here.

There may be no better way to get truly lost in space-time than to travel to the past and fiddle around with causality. Polymath Kurt Gödel suggested that you could, for instance, land near your younger self and “do something” to that person. If your action was drastic enough, like murder (or is it suicide?), then you could neither have embarked on your time trip, nor perpetrated the dark deed. But then no one would have stopped you from going back in time and so you can commit your crime after all. You are lost in a loop. It’s no longer where you are, but whether you are.

Gödel was the first to prove that, according to general relativity, this sort of time travel can be done. While logically impossible, the equations say it is physically possible. How can that actually be the case?

Widely hailed as “the greatest logician since Aristotle”, Gödel is mainly known for his mathematical and philosophical work. By age 25, while at the University of Vienna, he developed his notorious incompleteness theorems. These basically say that there is no finite set of assumptions that can underpin all of mathematics. This was quickly perceived as a turning point in the subject.

In 1934, Gödel, now 28, was among the first to be invited to the newly founded Institute for Advanced Study in Princeton, New Jersey. During the following years, he commuted between Princeton and Vienna.

After a traumatic journey around a war-torn globe, Gödel settled in Princeton for good in 1940. This is when his friendship with Albert Einstein developed. Their daily walks became legendary. Einstein quipped: “I come to my office just for the privilege to escort Gödel back home.”  The two strollers seemed eerily out of their time. The atomic bomb was built without Einstein, and the computer without Gödel.

When Einstein’s 70th birthday approached, Gödel was asked to contribute to the impending Festschrift a philosophical chapter on German philosopher Immanuel Kant and relativity – a well-grazed field. To his mother, he wrote: “I was asked to write a paper for a volume on the philosophical meaning of Einstein and his theory; of course, I could not very well refuse.”

Gödel began to reflect on Kant’s view that time was not, as Newton would have it, an absolute, objective part of the world, but an a priori form of intuition constraining our cognition. As Kant said: “What we represent ourselves as changes would, in beings with other forms of cognition, give rise to a perception in which… change would not occur at all.” Such “beings” would experience the world as timeless.

In his special relativity, Einstein had famously shown that different observers can have different notions of “now”. Hence, no absolute time. (“Newton, forgive me!” sighed Einstein.) However, this theory does not include gravitation. Add mass, and a kind of absolute time seems to sneak back! At least, it does so in the standard model of cosmology. There, the overall flow of matter works as a universal clock. Space-time is sliced in an infinity of layers, each representing a “now”, one succeeding another. Is this a necessary feature of general relativity? Gödel had found a mathematical kernel in a philosophical problem. That was his trademark.

At this stage, according to cosmologist Wolfgang Rindler, serendipity stepped in: Gödel stumbled across a letter to the journal Nature by physicist George Gamow, entitled “Rotating universe?”. It points out that apparently most objects in the sky spin like tops. Stars do it, planets do it, even spiral galaxies do it. They rotate. But why?

Gamow suggested that the whole universe rotates, and that this rotation trickles down, so to speak, to smaller and smaller structures: from universe to galaxies, from galaxies to stars, from stars to planets. The idea was ingenious, but extremely vague. No equations, no measurements. However, the paper ended with a friendly nudge for someone to start calculating.

With typical thoroughness, Gödel took up the gauntlet. He had always been a hard worker, who used an alarm clock not for waking up but for going to bed. He confided to his mother that his cosmology absorbed him so much that even when he tried to listen to the radio or to movies, he could do so “only with half an ear”. Eventually, Gödel discovered exact solutions of Einstein’s equations, which described a rotating universe.

However, while Gamow had imagined that the centre of rotation of our world is somewhere far away, beyond the reach of the strongest telescopes, Gödel’s universe rotates in every point. This does not solve Gamow’s quest for the cause of galactic rotations, but yields another, amazing result. In contrast to all then-known cosmological models, Gödel’s findings showed that there is no “now” that’s valid everywhere. This was exactly what he had set out to achieve: vindicate Kant (and Einstein) by showing that there is no absolute time.

“Talked a lot with Gödel,” wrote his friend Oskar Morgenstern, the economist who, together with John von Neumann, had founded game theory. He knew Gödel from former Viennese days and reported all their meetings in his diary. “His cosmological work makes good progress. Now one can travel into the past, or reach arbitrarily distant places in arbitrarily short time. This will cause a nice stir.” Time travel had been invented.

In Gödel’s universe, you don’t have to flip the arrow of time to go back to the past. Your time runs as usual. No need to shift entropy in return gear. You just step into a rocket and take off, to fly in a very wide curve (very wide!) at a very high speed (but less than the speed of light). The rocket’s trajectory weaves between light cones, never leaving them but exploiting the fact that in a rotating universe, they are not arrayed in parallel. The trip would consume an awful amount of energy.

Gödel just managed to meet the editorial timeline. On his 70th birthday, Einstein got Gödel’s manuscript for a present (and a sweater knitted by Kurt’s wife Adele). He thanked him for the gifts and confessed that the spectre of time travel had worried him for decades. Now the spectre had materialised. Einstein declared Gödel’s paper “one of the most important since my own”, and stated his hope that time travel could be excluded by some as yet unknown physical law. Soon after, Gödel received the first Albert Einstein award. It went with a modest amount of money which Gödel, as it turned out, could use well.

Next, according to philosopher Palle Yourgrau, “something extraordinary happened: nothing”.

For several decades, the mind-bending discovery of Gödel, far from causing “a nice stir”, got very little attention. When Harry Woolf, the director of the Institute for Advanced Study, arranged the eulogies to be given at Gödel’s funeral in 1978, he listed the topics to be covered: set theory and logic, followed by relativity, which he noted was “not worth a talk”.

Only by and by did eminent cosmologists, such as Stephen Hawking, Kip Thorne or John Barrow, convey an area of respectability to the field. Today, it is mainstream. With time, it transpired that, years before Gödel’s breakthrough, several other cosmological models had exhibited both rotation and the possibility of time travel. However, this aspect had never been noticed, not even by the engineers of these universes.

Many physicists are happy to leave the paradoxical aspects of time travel to philosophers. They invoke a “chronology protection law” that would step in to prevent the worst. It sounds like whistling in the dark but helps to overcome the problem of haunting your own present as a revenant from the future.

And does our universe rotate? Gödel was equivocal on that issue. Sometimes he claimed that his model only served as a thought experiment, to display the illusionary character of time, which cannot depend on accidental features of the place we happen to inhabit. Cosmologist Freeman Dyson, however, reported that Gödel, near the end of his life, had shown dismay when told that evidence for a rotating universe is lacking.

For more such insights, log into www.international-maths-challenge.com.

*Credit for article given to Karl Sigmund*


To Make Maths Classes Sizzle, Inject Some Politics And Social Justice

Relating mathematics to questions that are relevant to many students can help address its image problem, argues Eugenia Cheng.

Mathematics has an image problem: far too many people are put off it and conclude that the subject just isn’t for them. There are many issues, including the curriculum, standardised tests and constraints placed on teachers. But one of the biggest problems is how maths is presented, as cold and dry.

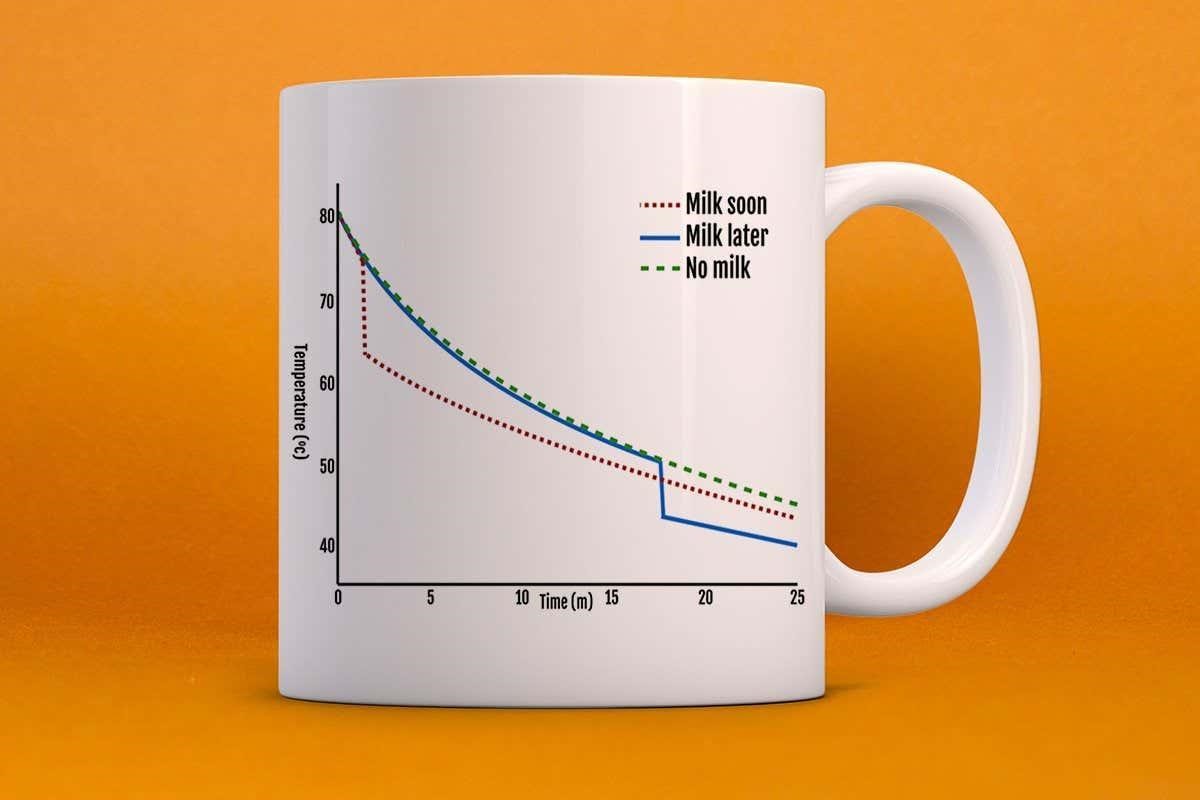
Attempts at “real-life” applications are often detached from our daily lives, such as arithmetic problems involving a ludicrous number of watermelons or using a differential equation to calculate how long a hypothetical cup of coffee will take to cool.

I have a different approach, which is to relate abstract maths to questions of politics and social justice. I have taught fairly maths-phobic art students in this way for the past seven years and have seen their attitudes transformed. They now believe maths is relevant to them and can genuinely help them in their everyday lives.

At a basic level, maths is founded on logic, so when I am teaching the principles of logic, I use examples from current events rather than the old-fashioned, detached type of problem. Instead of studying the logic of a statement like “all dogs have four legs”, I might discuss the (also erroneous) statement “all immigrants are illegal”.

But I do this with specific mathematical structures, too. For example, I teach a type of structure called an ordered set, which is a set of objects subject to an order relation such as “is less than”. We then study functions that map members of one ordered set to members of another, and ask which functions are “order-preserving”. A typical example might be the function that takes an ordinary number and maps it to the number obtained from multiplying by 2. We would then say that if x < y then also 2x < 2y, so the function is order-preserving. By contrast the function that squares numbers isn’t order-preserving because, for example, -2 < -1, but (-2)2 > (-1)2. If we work through those squaring operations, we get 4 and 1.

However, rather than sticking to this type of dry mathematical example, I introduce ones about issues like privilege and wealth. If we think of one ordered set with people ordered by privilege, we can make a function to another set where the people are now ordered by wealth instead. What does it mean for that to be order-preserving, and do we expect it to be so? Which is to say, if someone is more privileged than someone else, are they automatically more wealthy? We can also ask about hours worked and income: if someone works more hours, do they necessarily earn more? The answer there is clearly no, but then we go on to discuss whether we think this function should be order-preserving or not, and why.

My approach is contentious because, traditionally, maths is supposed to be neutral and apolitical. I have been criticised by people who think my approach will be off-putting to those who don’t care about social justice; however, the dry approach is off-putting to those who do care about social justice. In fact, I believe that all academic disciplines should address our most important issues in whatever way they can. Abstract maths is about making rigorous logical arguments, which is relevant to everything. I don’t demand that students agree with me about politics, but I do ask that they construct rigorous arguments to back up their thoughts and develop the crucial ability to analyse the logic of people they disagree with.

Maths isn’t just about numbers and equations, it is about studying different logical systems in which different arguments are valid. We can apply it to balls rolling down different hills, but we can also apply it to pressing social issues. I think we should do both, for the sake of society and to be more inclusive towards different types of student in maths education.

For more such insights, log into www.international-maths-challenge.com.

*Credit for article given to Eugenia Cheng*