Getting in sync can be exhilarating when you’re dancing in rhythm with other people or clapping along in an audience. Fireflies too know the joy of synchronization, timing their flashes together to create a larger display to attract mates.
Synchronization is important at a more basic level in our bodies, too. Our heart cells all beat together (at least when things are going well) and synchronized electrical waves can help coordinate brain regions—but too much synchronization of brain cells is what happens in an epileptic seizure.
Sync most often emerges spontaneously rather than through following the lead of some central timekeeper. How does this happen? What is it about a system that determines whether sync will emerge, and how strong it will be?
In new research published in Proceedings of the National Academy of Sciences, we show how the strength of synchronization in a network depends on the structure of the connections between its members—whether they be brain cells, fireflies, or groups of dancers.
The science of sync
Scientists originally became interested in sync to understand the inner workings of natural systems. We have also become interested in designing sync as a desired behaviour in human-made systems such as power grids (to keep them in phase).
Mathematicians can analyse sync by treating the individuals in the system as “coupled oscillators.” An oscillator is something that periodically repeats the same pattern of activity, like the sequence of steps in a repetitive dance, and coupled oscillators are ones that can influence each other’s behaviour.
It can be useful to measure whether a system of oscillators can synchronize their actions, and how strong that synchronization would be. Strength of synchronization means how well the sync can recover from disturbances.
Take a group dance, for example. A disturbance might be one person starting to get some steps wrong. The person might quickly recover by watching their friends, they might throw their friends off for a few steps before everyone recovers, or in the worst case it might just cause chaos.
Synced systems are strong but hard to unravel
Two factors make it difficult to determine how strong the synchronization in a set of coupled oscillators could be.
First, it’s rare for a single oscillator to be in charge and telling everyone else what to do. In our dance example, that means there’s neither music nor lead dancers to set the tempo.
And second, usually each oscillator is only connected to a few others in the system. So each dancer can only see and react to a few others, and everyone is taking their cues from a completely different set of dancers.
This is the case in the brain, for example, where there is a complex network structure of connections between different regions.
Real complex systems like this, where there is no central guiding signal and oscillators are connected in a complex network, are very robust to damage and adaptable to change, and can more easily scale to different sizes.
Stronger sync comes from more wandering walks
One drawback of such complicated systems is for scientists, as they are mathematically difficult to come to grips with. However, our new research has made a significant advance on this front.
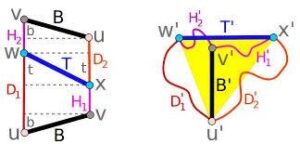
We have shown how the network structure connecting a set of oscillators controls how well they can synchronize. The quality of sync depends on “walks” on a network, which are sequences of hops between connected oscillators or nodes.
Our math examines what are called “paired walks.” If you start at one node and take two walks with randomly chosen next hops for a specific number of hops, the two walks might end up at the same node (these are convergent walks) or at different nodes (divergent walks).
We found that the more often paired walks on a network were convergent rather than divergent, the worse the synchronization on the network would be.
When more paired walks are convergent, disturbances tend to be reinforced.
In our dancing example, one person making the wrong steps might lead some neighbours astray, who may then lead some of their neighbours astray and so on.
These chains of potential disturbances are like walks on the network. When those disturbances propagate through multiple neighbours and then converge on one person, that person is going to be much more likely to copy the out-of-sync moves than if only one of their neighbours was offbeat.
Social networks, power grids and beyond
So networks with many convergent walks are prone to poorer synchronization. This is good news for the brain avoiding epilepsy, as its highly modular structure brings a high proportion of convergent walks.
We can see this reflected in the echo chamber phenomenon in social media. Tightly coupled subgroups reinforcing their own messages can synchronize themselves well, but may fall far out of step with the wider population.
Our results bring a new understanding to how synchronization functions in different natural network structures. It opens new opportunities in terms of designing network structures or interventions on networks, either to aid synchronization (in power grids, say) or to avoid synchronization (say in the brain).
More widely, it represents a major step forward in our understanding of how the structure of complex networks affects their behaviour and capabilities.
For more such insights, log into our website https://international-maths-challenge.com
Credit of the article given to Joseph Lizier, The Conversation