Scarlett Howard
Humans have always been fascinated with space. We frequently question whether we are alone in the universe. If not, what does intelligent life look like? And how would aliens communicate?
The possibility of extraterrestrial life is grounded in scientific evidence. But the distances involved in travel between the stars are vast. If we do contact aliens, it would likely be via long distance communication, with our nearest neighbouring star being 4.4 light years away. Even being optimistic, it would likely take more than ten years for any round-trip communication.
How could that work when we have no shared language? Well, consider how we can engage with creatures here on Earth with minds quite alien to our own: bees.
Despite the vast differences in human and bee brains, both of us can do mathematics. As we argue in a new paper published in the journal Leonardo, our thought experiment lends weight to the idea that mathematics may form the basis for a “universal language,” which might one day be used to communicate between the stars.
Mathematics as the language of science
The idea of mathematics as universal is not new. Writing in the 17th century, Galileo Galilei described the universe as a grand book “written in the language of mathematics”.
Science fiction, too, has long explored the idea of mathematics as a universal language. In the 1985 novel and 1997 film Contact, extraterrestrials reach out to humans using a repeating sequence of prime numbers sent via radio signal.
In The Three-Body Problem, a novel by Liu Cixin adapted into a Netflix series, communication between aliens and humans to solve a mathematical problem occurs through a video game.
Mathematics also features in a 1998 novella by Ted Chiang called Story of Your Life, which was adapted into the 2016 film Arrival. It describes aliens with a non-linear experience of time and a correspondingly different formulation of mathematics.
Real scientific efforts at universal communication have also involved mathematics and numbers. The covers of the Golden Records, which accompanied the Voyager 1 and 2 space probes launched in 1977, are etched with mathematical and physical quantities to “communicate a story of our world to extraterrestrials”.
The 1974 Arecibo radio message beamed out into space consisted of 1,679 zeros and ones, ordered to communicate the numbers one to ten and the atomic numbers of the elements that make up DNA. In 2022, researchers developed a binary language designed to introduce extraterrestrials to human mathematics, chemistry, and biology.
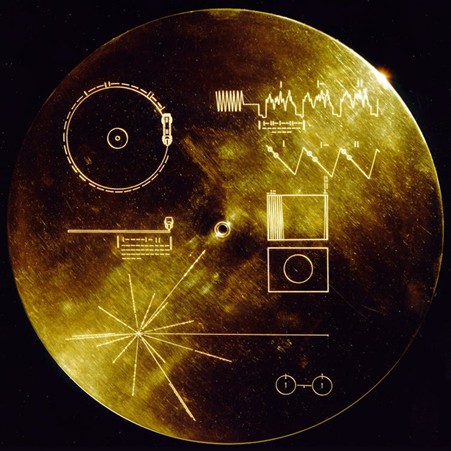
This gold-aluminum cover was designed to protect the Voyager 1 and 2 ‘Sounds of Earth’ gold-plated records from micrometeorite bombardment, but also served a second purpose in providing the finder with a key to playing the record using binary arithmetic and numbers, as well as schematics to explain the process. NASA/JPL
How do we test a universal language without aliens?
A creature with two antennae, six legs, and five eyes may sound like an alien, but it also describes a bee. (Science fiction has of course imagined “insectoid” aliens.)
The ancestors of bees and humans diverged over 600 million years ago, yet we both possess communication, sociality, and some mathematical ability. Since parting ways, both honeybees and humans have independently developed effective, but different, means of communication and cooperation within complex societies.
Humans have developed language. Honeybees evolved the waggle dance – which communicates the location of food sources including distance, direction, angle from the Sun, and quality of the resource.
Due to our vast evolutionary separation from bees, as well as the differences between our brain sizes and structures, bees could be considered an insectoid alien model that exists right here on Earth. At least for the purposes of our thought experiment.
Bees and mathematics
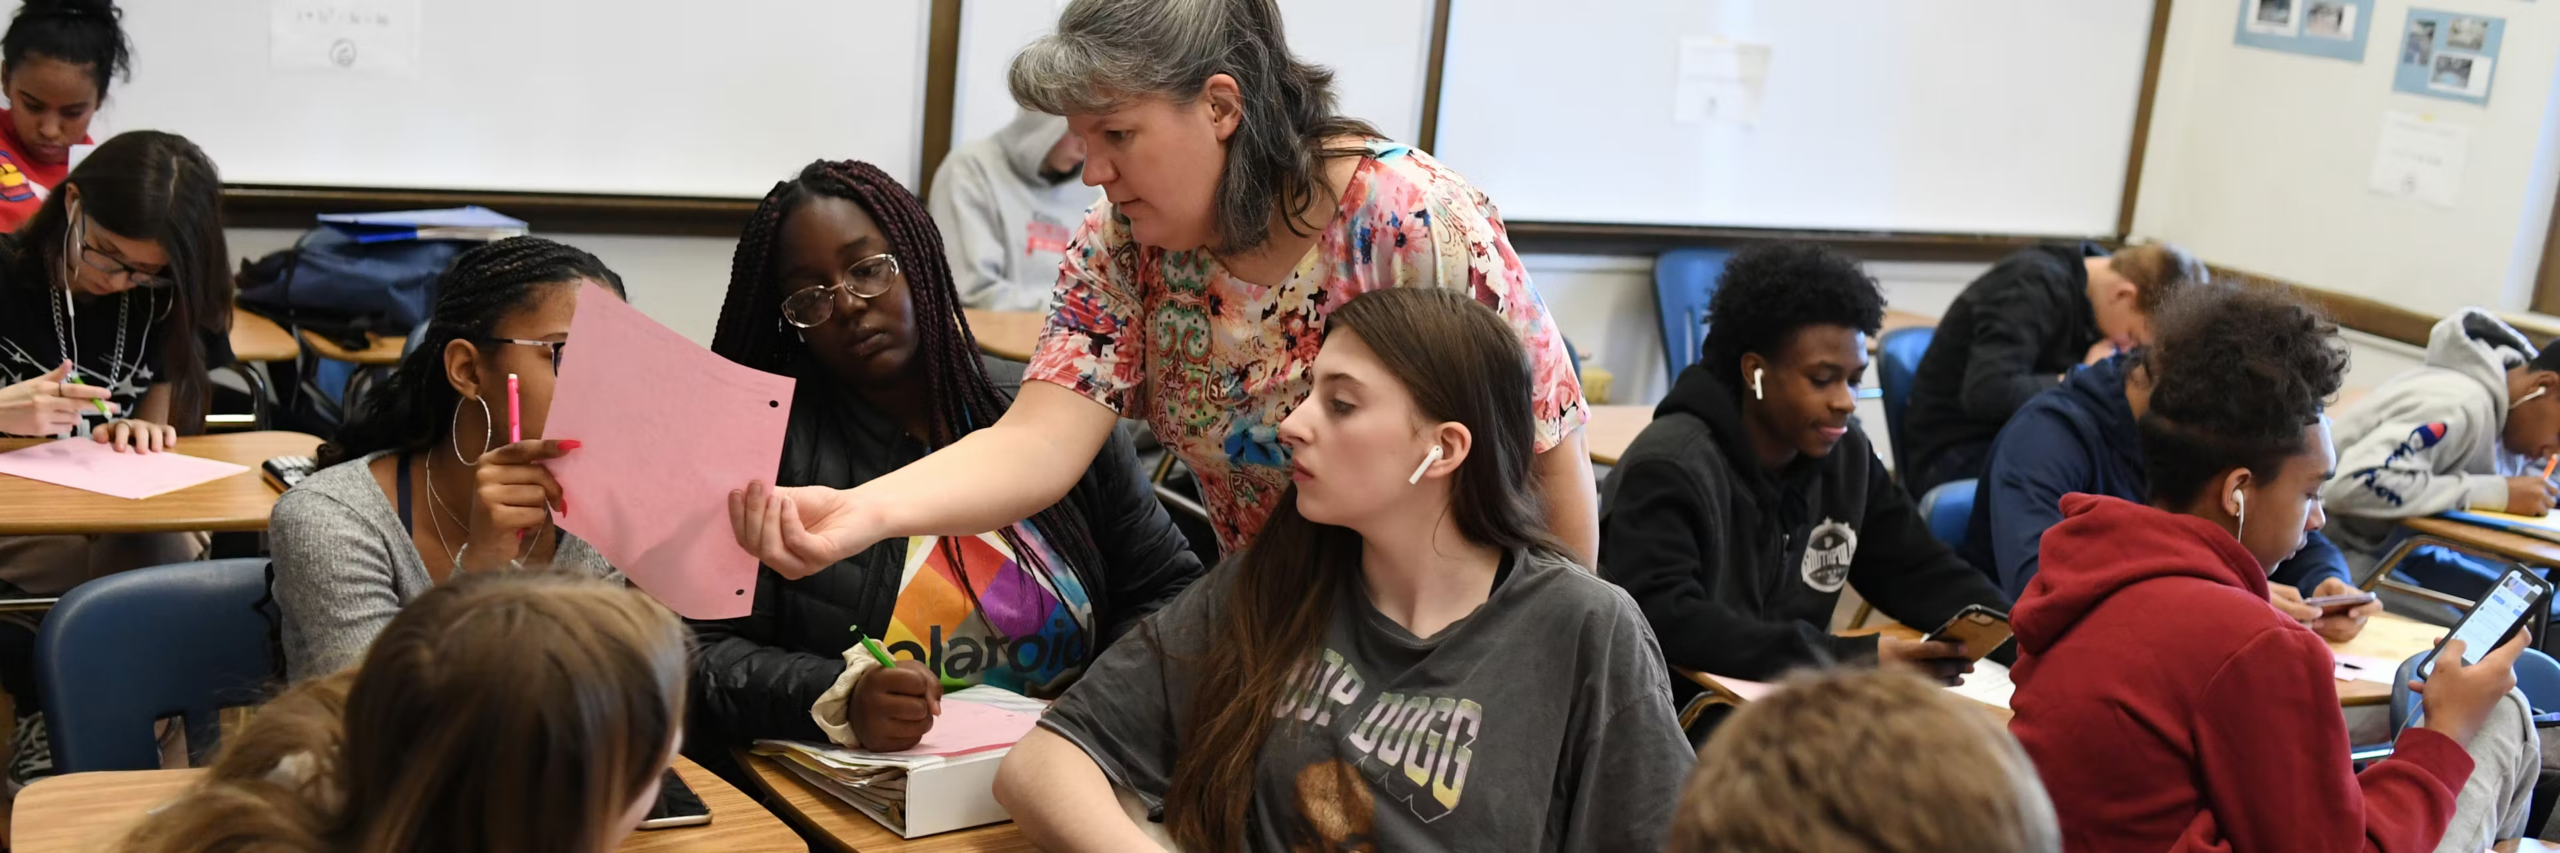
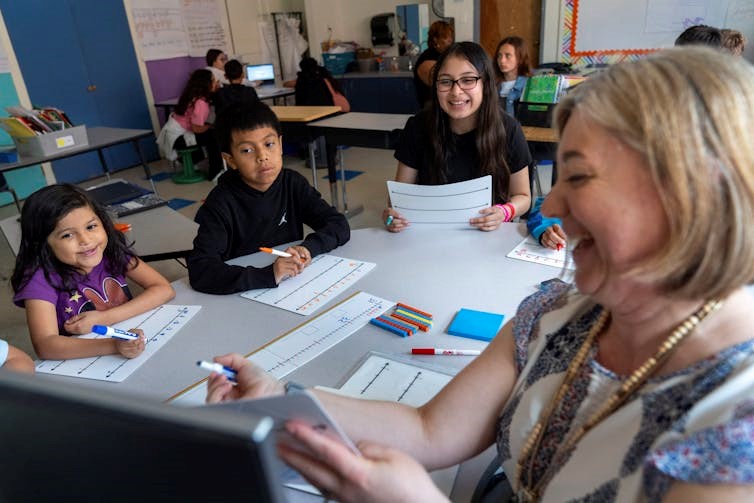
In a series of experiments between 2016 and 2024, we explored the ability of bees to learn mathematics. We worked with freely flying honeybees that chose to regularly visit and participate in our outdoor maths tests to receive sugar water.
During the tests, bees showed evidence of solving simple addition and subtraction, categorising quantities as odd or even, and ordering quantities of items, including an understanding of “zero”. Bees even demonstrated the ability to link symbols with numbers, in a simple version of how humans learn Arabic and Roman numerals.
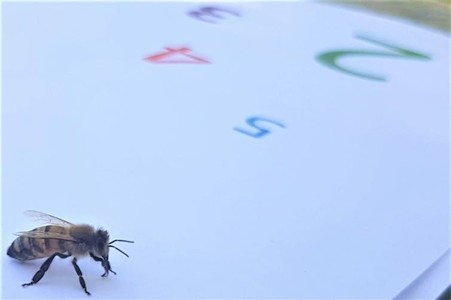
Bees have demonstrated the ability to learn simple arithmetic and can perform other numerical feats. Scarlett Howard
Despite the miniature brains of bees, they have demonstrated a rudimentary capacity to perform mathematics and learn to solve problems with quantities. Their mathematical ability involved learning to add and subtract one, which provides a launching pad to more abstract mathematics. The ability to add or subtract by one theoretically allows bees to represent all of the natural numbers.
If two species considered alien to each other – humans and honeybees – can perform mathematics, along with many other animals, then perhaps mathematics could form the basis of a universal language.
If there are extraterrestrial species, and they have sufficiently sophisticated brains, then our work suggests that they may have the capacity to do mathematics. A further question to be answered is whether different species will develop different approaches to mathematics, akin to dialects in language.
Such discoveries would also help to answer the question of whether mathematics is an entirely human construction, or if it is an a consequence of intelligence and thus, universal.
For more such insights, log into www.international-maths-challenge.com.
*Credit for article given to Scarlett Howard, Adrian Dyer & Andrew Greentree*