The Sofa Problem: 60 Years, 119 Pages, One Answer

How a Korean mathematician solved the problem of moving furniture around a corner — a question that stumped the world since 1966.

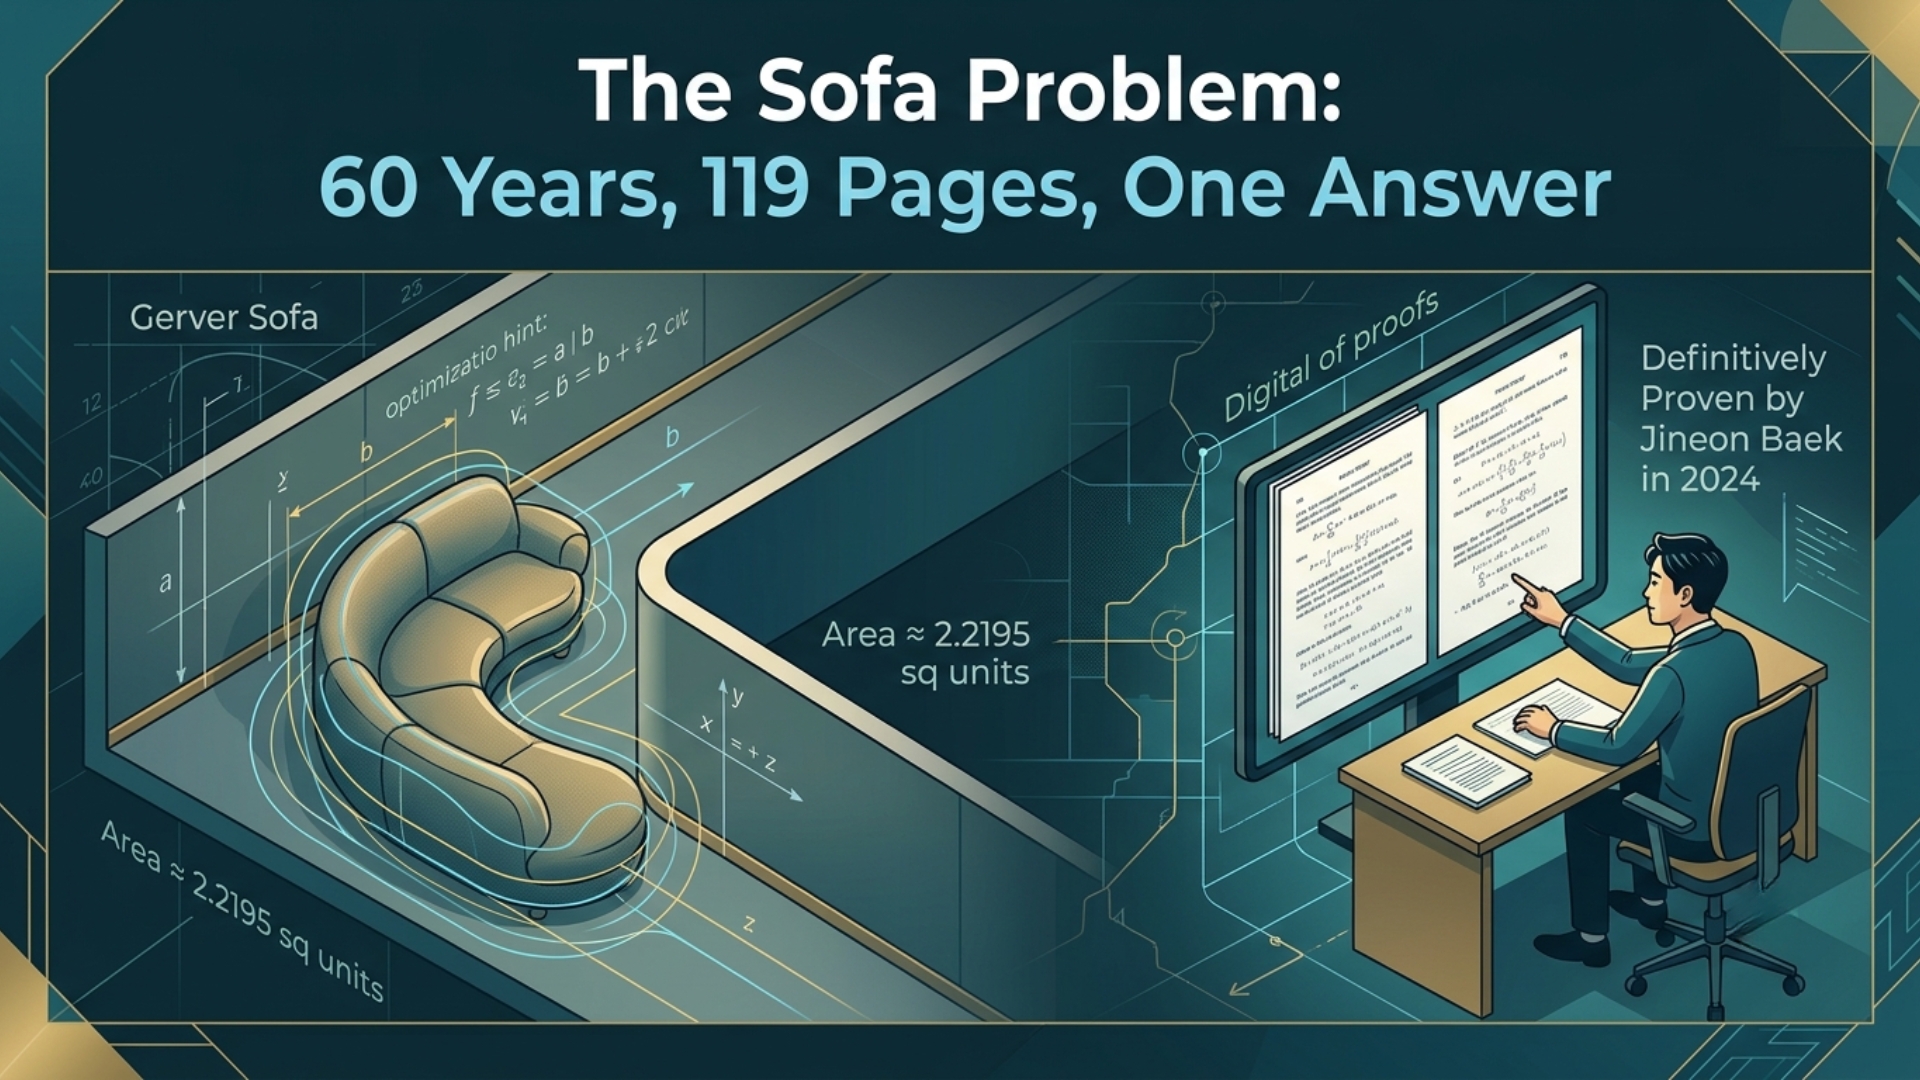
The optimal “Gerver sofa” shape, with area 2.2195 square units — proven definitively by Jineon Baek in 2024 (arXiv:2411.19826)

Anyone who has ever wrestled a sofa around a tight corner knows the frustration. Mathematicians, it turns out, have been equally frustrated by the theoretical version of this problem since 1966, when Canadian mathematician Leo Moser posed it formally: what is the largest two-dimensional shape that can be manoeuvred around a right-angled corner in a hallway of unit width?

The question is deceptively simple. A plain square can make it around the corner, as can a semicircle. But what is the absolute maximum area any shape could have while still fitting through? For nearly six decades, mathematicians circled this problem (sometimes literally), proposing shapes and proving partial results, but never settling on a definitive answer.

Gerver’s candidate — and the missing proof

In 1992, mathematician Joseph Gerver proposed a beautiful, 18-curve shape that looked somewhat like the handset of a landline telephone. It had an area of approximately 2.2195 square units — an improvement on all previous candidates. But Gerver could not prove that nothing larger was possible. His shape sat as the best known answer for more than three decades: a champion with no certificate of victory.

“You keep holding on to hope, then breaking it, and moving forward by picking up ideas from the ashes.” — Jineon Baek

Baek’s 119-page proof

In late November 2024, Jineon Baek — a postdoctoral researcher at Yonsei University in Seoul — posted a 119-page paper to the preprint server arXiv that claimed to settle the matter. After seven years of work, Baek proved that no shape with an area larger than Gerver’s sofa can exist. The maximum sofa constant is 2.2195 square units, and that is final.

What is especially striking about Baek’s proof is that it relies entirely on logical reasoning — no large-scale computer simulations, no numerical approximations. Scientific American called it “surprising” that the final solution avoids computers altogether. The proof has been submitted to the prestigious Annals of Mathematics and is under peer review; early responses from leading geometers have been optimistic.

The moving sofa problem has a cultural footprint as well. The US sitcom Friends features a famous scene in which characters struggle to manoeuvre a sofa up a staircase while Ross Geller shouts “Pivot!” Scientific American noted, tongue in cheek, that “explaining the pivot required a 119-page paper.”

Sources & Further Reading

Baek, J. (2024). Optimality of Gerver’s Sofa. arXiv:2411.19826. arxiv.org

Scientific American (2025). Mathematicians Solve Infamous Moving Sofa Problem. scientificamerican.com

Phys.org (2024). Mathematician solves the moving sofa problem. phys.org

Korea Herald (2026). Six-decade math puzzle solved by Korean mathematician. koreaherald.com

Quanta Magazine (2025). The Largest Sofa You Can Move Around a Corner. quantamagazine.org


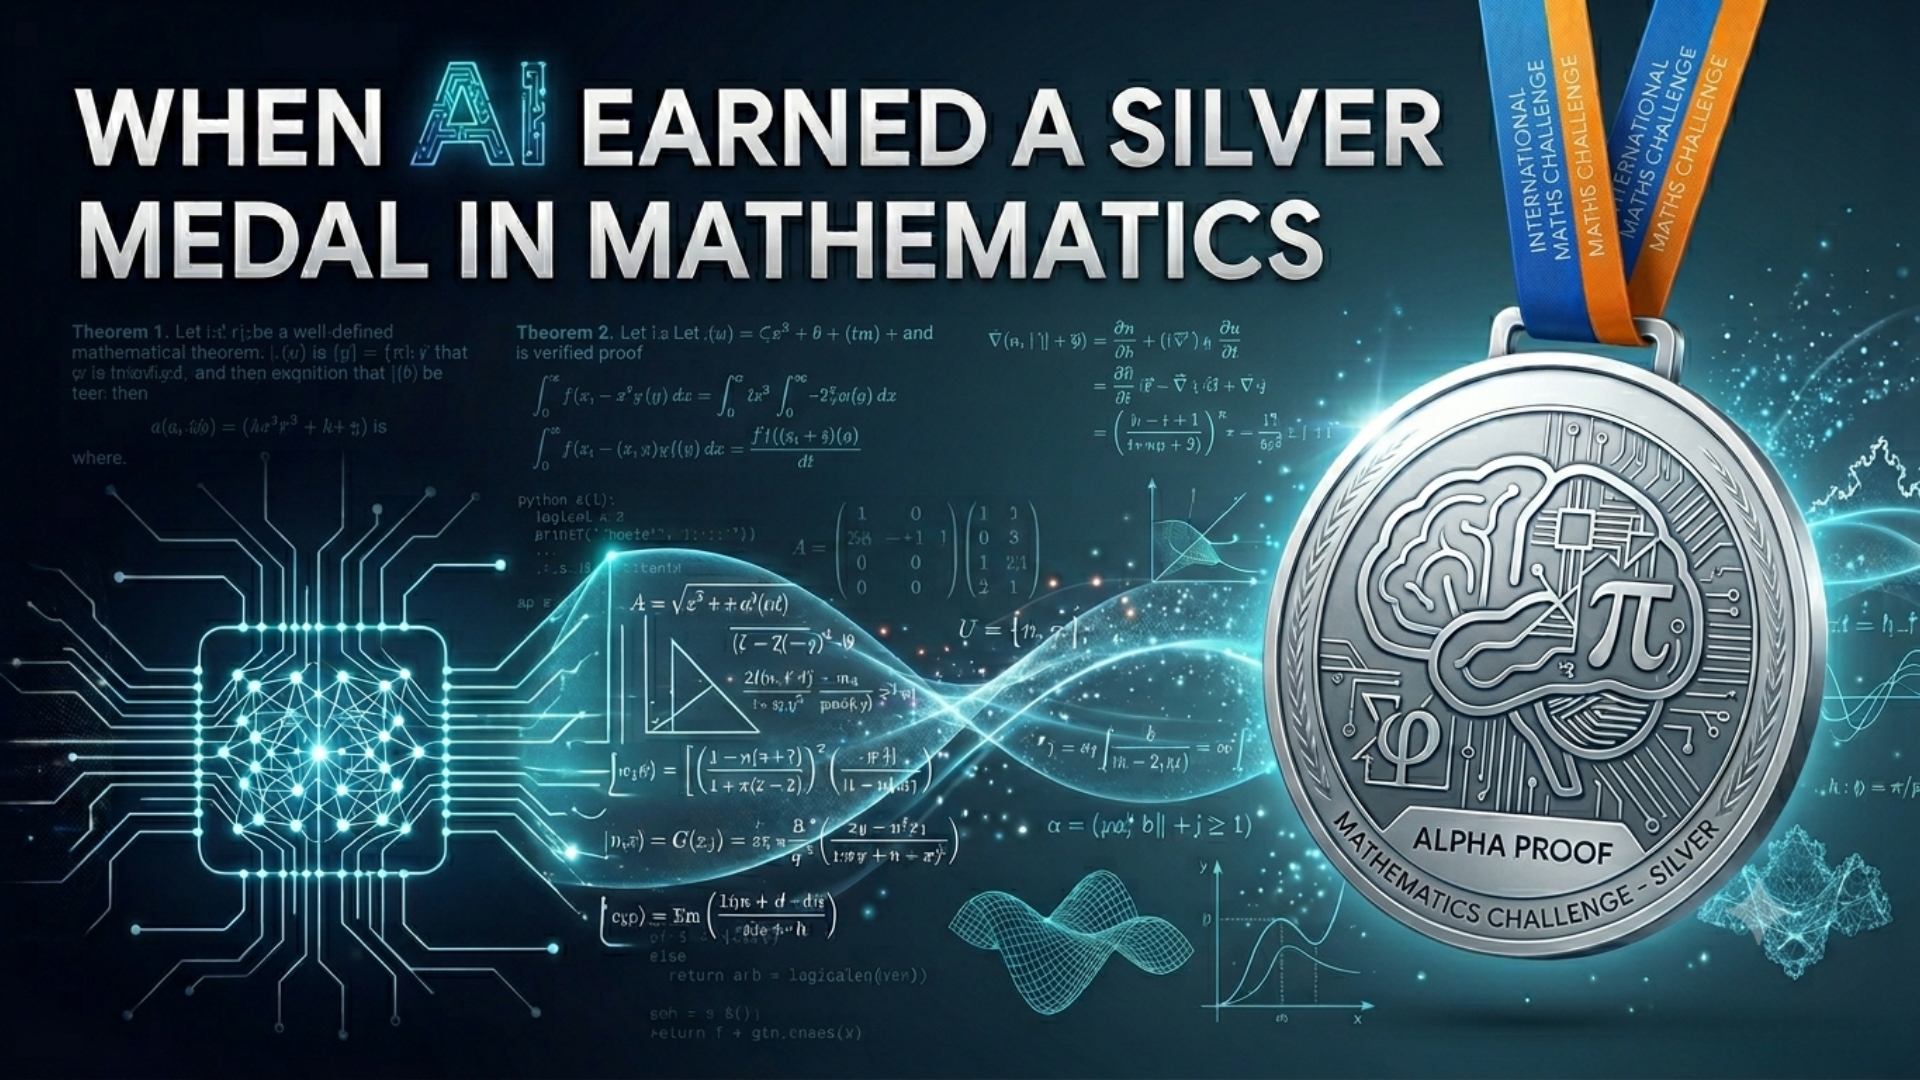
When AI Earned a Silver Medal in Mathematics

Google DeepMind’s AlphaProof reaches Olympiad level — and what it means for the future of mathematical proof.

AlphaProof’s performance at the 2024 International Mathematical Olympiad, Nature (2025)

Every summer, the most gifted young mathematicians in the world converge to compete in the International Mathematical Olympiad (IMO) — six problems, nine hours across two days, and a level of difficulty that humbles even exceptional minds. In 2024, an uninvited but remarkable competitor quietly entered the fray: Google DeepMind’s AlphaProof. It scored 28 out of a possible 42 points, placing it squarely in the silver-medal category and just one point short of gold.

What makes this achievement genuinely historic is not that a computer solved hard maths problems — machines have done arithmetic faster than humans for decades. What is new is that AlphaProof proved its answers with 100% verified correctness, step by logical step, using the formal proof assistant Lean. No guessing. No hallucinating a plausible-sounding answer. Every claim in every solution was machine-verified to be logically airtight.

How AlphaProof works

AlphaProof is a neuro-symbolic hybrid — it combines the intuitive pattern-matching of a large language model (based on Google’s Gemini architecture) with the rigorous verification engine of Lean, a formal mathematics software environment. The system was trained in three stages: first absorbing 300 billion tokens of mathematical text and code; then learning from 300,000 expert-written formal proofs; and finally, tackling 80 million formal mathematics problems through reinforcement learning — rewarded for every successful proof it constructed.

At the IMO, AlphaProof solved three non-geometry problems, including what IMO judges considered the hardest problem in the entire competition — a problem solved by only five human contestants. AlphaGeometry 2, a companion system, solved the geometry problem independently.

“AlphaProof is designed to prove mathematical statements — and it guarantees 100% correct solutions by verifying every logical step.” — Nature, 2025

Gold in 2025

The progression was swift. By 2025, an advanced version of Gemini equipped with “Deep Think” reasoning achieved the full gold-medal standard at IMO 2025 — solving all six problems within the time allowed. Unlike the 2024 effort, which required human experts to manually translate problems into formal language, the 2025 system could read and interpret problems in natural language directly. What previously demanded two to three days of computation was achieved within the competition’s standard timeframe.

This is not merely a parlour trick. Mathematicians across fields are beginning to ask: if AI can verify proofs and explore mathematical territories at machine speed, could it help crack problems that have resisted human effort for centuries — the Riemann Hypothesis, the Birch and Swinnerton-Dyer conjecture, P versus NP? AlphaProof does not answer these questions, but it brings them closer to the horizon than at any point in history.

Sources & Further Reading

Hubert, T. et al. (2025). Olympiad-level formal mathematical reasoning with reinforcement learning. Nature. DOI: 10.1038/s41586-025-09833-y

Google DeepMind (2025). AI achieves silver-medal standard solving International Mathematical Olympiad problems. deepmind.google

Google DeepMind (2026). Advanced version of Gemini with Deep Think officially achieves gold-medal standard at the IMO. deepmind.google

Phys.org (2025). AI math genius delivers 100% accurate results. phys.org/news/2025-11-ai-math-genius-accurate-results.html


What is the chance of a message in a bottle being found?

Jenny Sturm/Shutterstock

Recently, a cheerful 100-year-old message in a bottle was found on the south-west coast of Australia. In it, a world war one soldier proclaimed to be “as happy as Larry”.

If you’re a betting person, you probably wouldn’t expect great odds of this happening. A bottle cast into the ocean could end up absolutely anywhere.

If it floats to a remote location, there is little chance of somebody stumbling upon it. And if it lands somewhere more favourable where people could potentially find it, there are other issues. The message itself will deteriorate over time as light degrades it. If the bottle fills with water, it will sink and almost certainly never be found.

So, what are the chances of a message in a bottle being found and it being over 100? And what are your chances of finding this bottle?

Despite these many possibilities during a bottle’s lifetime, the probability we are after is a straightforward calculation. Just count up the number of bottles with messages that have been found and are over 100 years old, and divide by the number of messages that have been sent this way (assuming we know how many are sent):

Probability calculation.

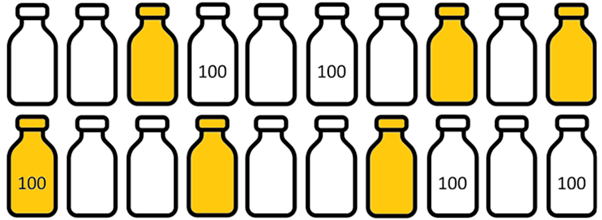
Our diagram below shows a hypothetical situation where 20 bottles are sent in total, of which six are found (indicated in gold) and one of these is over 100 years old (indicated by the “100” stamp). So, one in 20 bottles are found and over 100 years old. (Note: This is only a hypothetical calculation, not the real data.)

Hypothetical bottle data. Bottle image from https://www.flaticon.com/free-icons/bottle.

Instead of calculating the probability directly, another way to do it is by breaking the problem into two parts: (A) a bottle with a message is found, and (B) the found bottle is over 100. These two probabilities can be calculated separately and multiplied together to get what we want:

Multiplication rule of probability.

This is known as the “multiplication rule” of probability, and we confirm from our hypothetical numbers that (6/20)×(1/6) = 1/20, as before.

Both approaches to calculating this probability are simple. However, the direct calculation requires knowing the total number of bottles sent out, which is very difficult to know in the real world.

The multiplication rule has the advantage that it breaks the calculation into two parts. We can tackle each separately, then bring the two results together to get the probability we want. This is useful in the real-world situation where we can draw information from different sources.

First, we’ll deal with the probability that a bottle with a message is found, irrespective of its age.

Experts from the Federal Maritime and Hydrographic Agency of Germany suggest a one in ten chance that a message in a bottle will be found. This aligns broadly with various historical “drift bottle” experiments, where oceanographers released large numbers of bottles to understand ocean currents.

For example, studies from the 1960s and ’70s in the North Atlantic Ocean led to recovery rates of 14% from the Gulf of Mexico, 8% from the Caribbean Sea and 7% from the northern Brazilian coast. A more recent and more northerly study (between Canada and Greenland) from the 2000s led to a 5% recovery rate.

We would expect the results to vary naturally from different experiments in different parts of the world. But to keep things simple, we will stick with 1/10 as the probability that a bottle with a message is found.

Now for the second piece of the calculation: of the bottles that are found, what proportion are over 100 years old?

The table below summarises data from news articles collected on Wikipedia about very old bottles with messages that have been found. However, only data on bottles over 25 years old has been collected, presumably because older bottles are more newsworthy.

Data on the age distribution of bottles found, where the asterisk * indicates an estimated number.

So, we needed to estimate the number of 0- to 25-year-old bottles with messages ourselves – here’s how we did this.

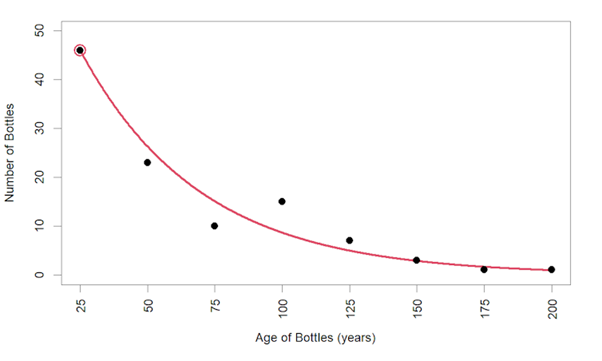
The table shows that fewer bottles with messages are found as they get older. Messages in bottles degrade over time, which means the bottles have an increased chance of breaking and sinking, or just getting covered in layers of sediment. Plotting this data in the graph below helped us see the trend in the ages of found bottles more clearly.

Trend in the ages of bottles found.

We drew a line to match this observed trend in the ages of found bottles. This red line in the graph corresponds to the equation:

This equation provides an estimate of how many bottles have been found for any specific age range (where 25 = 0-to-25, 50 = 25-to-50 and so on). We are interested in the the 0- to 25-year-old bottles, so the equation suggests 46 bottles have been found in this range.

Adding up this and all of the numbers in the table gives a total of 106 bottles found, of which 12 are over 100 years old, and 12/106 is about one in ten.

Recapping the above, we have that: (A) one in ten bottles with messages are found, of which (B) one in ten are over 100 years old. Bringing these results together using the multiplication rule, we estimate the chance of a message in a bottle being found and it being over 100 years old to be (1/10)×(1/10) = 1/100.

So, if there are 100,000 bottles with messages floating around the oceans waiting to be found, we’d expect 1,000 of these to be found and be 100 or more years old. Assuming anybody in the world is equally likely to find one of these, with 8 billion people currently, that’s about a one in 8 million chance of you finding one – pretty unlikely.

However, some people are more persistent at message-in-a-bottle hunting than others. Following the paths of ocean currents (known as gyres) could provide clues on where to look.

Specifically, peninsulas or islands intersecting with these gyres could be good spots. For this reason, it has been suggested the Caribbean islands are ideally placed for finding bottles as they lie on the path of the North Atlantic Gyre. Which seems like a great reason to travel to the Carribean!

But let’s also spare a thought for the poor soul stranded on their desert island, who surely won’t appreciate the low odds of their SOS being found.

For more such insights, log into www.international-maths-challenge.com.

*Credit for article given to Kevin Burke & David O’Sullivan*


Finding Square Roots Without Estimating

Typical algorithms for doing square roots by hand require estimation. I have taught a different algorithm that does not rely on estimation but instead uses subtraction of successive odd integers. First, I offer examples that illustrate two situations that may arise. Then I present a third situation (as well as how to deal with the square roots of non-perfect squares).
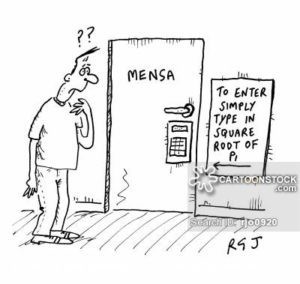
This approach is based on the fact that the nth perfect square is the sum of the first n odd integers. This fact can be used to subtract successive odd integers from a given number for which one wishes to find the square root. If the number isn’t a perfect square, this method can be extended by adding pairs of zeroes to the original number and continuing the process for each additional decimal place one wishes find.

FIRST RULE

It helps to look at a couple of examples to illustrate two “special cases” that arise with some numbers, requiring one or two additional “rules” or steps.

Using the example of 54,756:

Start by marking pairs of digits from the right-most digit: 5 | 47 | 56

Then subtract 1 from the leftmost digit or pair: 5 – 1 = 4.
Continue with the next odd integer: 4 – 3 = 1.

We can’t subtract 5 from 1, so we count how many odd integers we’ve subtracted thus far (2) and mark that above the 5.

Bring down the next pair of digits and append it to the 1 yielding 147.

To get the next odd integer to subtract, multiply the last odd integer subtracted by 10 and add 11 (this is Rule #1) to the product. Here, we have 10 x 3 + 11 = 41. Proceed as previously, subtracting 41 from 147 = 106.
Subtract the next odd integer, 43 from 106 = 63.
Subtract the next odd integer, 45 from 63 = 18.

Again, we can’t subtract 47 from 18; counting, we have done 3 subtractions and place 3 above the pair 47. Multiply 45 x 10 and add 11 = 461.

Bring down the next pair of digits, 56, and append them to the 18, yielding 1856.

Subtract 461 from 1856 = 1395.
Subtract the next odd integer, 463 from 1395 = 932.
Subtract the next odd integer, 465 from 932 = 467.
Subtract the next odd integer, 467 from 467 = 0.
Stop.

Counting how many subtractions, we see it is 4 and we write 4 above the 56.

Our answer is that 234 is the square root of 54,756. Alternately, instead of keeping a running total of the subtractions and placing the digits above successive pairs of digits from the left, take the last number subtracted, 467, add 1, and divide the result by 2 = 234, same as what we determined the other way.

SECOND RULE

A second example introduces another rule not previously required: find the square root of 4,121,062,016 using the subtraction of successive odd integers.

Begin as above by making pairs of digits from the right-most digit: 4 | 12 | 10 | 62 | 40 | 16

Subtract 1 from 4 = 3.

Subtract 3 from 3 = 0.
Write down 2 for the two subtractions above the 4.
Bring down the next pair of digits, 12.
Multiply 3 x 10 and add 11 = 41.
Note that 41 is too big to subtract from 12.
Write 0 above the 12, since we did 0 subtractions.

Bring down the next pair of digits, 10, and append to the 12 => 1210.

Insert a 0 to the left of the last digit in 41 => 401. (This is Rule #2)
Subtract 401 from 1210 = 809.
Subtract the next odd integer, 403, from 809 = 406.
Subtract the next odd integer, 405 from 406 = 1.

For the three subtractions, write 3 above the 10.

Bring down the next pair of integers, 62 and append to the 1 => 162
Multiply 405 by 10 and add 11 = 4061.
We need to apply Rule #2 again. Write 0 above the 62, bring down the next pair of digits, 40, and append to the 162 => 16240.
Insert 0 to the left of the last digit of 4061 => 40601.

Note that this is still too big to subtract from 16240.
Apply Rule #2 again (and it may have to be applied more than twice in particular cases).
Write 0 above the 40, bring down the 16 and append to the 16240 => 1624016.
Insert a 0 to the left of the last digit of 40601 => 406001.

Subtract 406001 from 1624016 = 1218015.
Subtract the next odd integer , 406003 from 1218015 = 812012.
Subtract the next odd integer, 406005 from 812012 = 406007.
Subtract the next odd integer, 406007 from 406007 = 0.
Write a 4 above the last pair of digits, 16.

The square root of 41210624016 = 203,004.

Again, alternately, the answer = (406007+1) / 2 = 203,004.

THIRD RULE

There is a group of numbers for which the process previously described won’t work. For example, try to use it to find the square root of 100.

Grouping as before: 1 | 00

Subtracting 1 from 1 = 0.

Write 1 above the 1, bring down the next pair of digits, 00, and append to the 0.

Multiply 1 x 10 and add 11 = 21.

Can’t subtract 21 from 0. Hmm. Although we know the answer is 10, to make things work, we can note the following, which is Rule #3:

If you want the square root of a whole number that ends in two or more zeros, write the number as a product of a number and an even power of ten.

So 100 = 1 x 10^2.

We get that the square root of 1 = 1, append one zero for every pair of zeroes in the original number, and Bob’s your uncle. (Or something like that).

For example, to find the square root of 3,610,000, remove two pairs of zeroes from the original number, then apply the original procedure:

Group: 3 | 61.

Subtract 1 from 3 = 2

Can’t subtract 3 from 2, so write 1 above the 3, bring down the next pair of digits and append them to the 2 => 261.

Multiply 1 x 10 and add 11 = 21.

Subtract 21 from 261 = 240.
Subtract 23 from 240 = 217
Subtract 25 from 217 = 192
Subtract 27 from 192 = 165
Subtract 29 from 165 = 136
Subtract 31 from 136 = 105
Subtract 33 from 105 = 72
Subtract 35 from 72 = 37
Subtract 37 from 37 = 0

So write a 9 above the 61. Append two zeroes to the 19, one for each pair removed.
Then the square root of 3,610,000 = 1900.

DEALING WITH NON-PERFECT SQUARES

Finally, this process works for whole numbers that aren’t perfect squares and for decimals. It just won’t terminate in those cases (except arbitrarily). For a decimal, also break the number into pairs of digits to the right of the decimal point.

For example, finding the square root of 3 to 3 decimal places.

Append pairs of zeroes for each decimal place you want in the answer, plus two more to be able to round to the given place.

So write 3 as 3 | 00 | 00 | 00 | 00

Subtract 1 from 3 = 2.

Write 1 above the 3. Bring down a pair of zeroes, append to the 2 => 200.

Multiply 1 x 10 and add 11 = 21.

Subtract 21 from 200 = 179
Subtract 23 from 179 = 156
Subtract 25 from 156 = 131
Subtract 27 from 131 = 104
Subtract 29 from 104 = 75
Subtract 31 from 75 = 44
Subtract 33 from 44 = 11.

Write 7 above the first pair of zeroes.

Bring down the next pair of zeroes and append to the 11 => 1100.

Multiply 33 x 10 and add 11 = 341.

Subtract 341 from 1100 = 759.
Subtract 343 from 759 = 416.
Subtract 345 from 416 = 71.

Write 3 above the second pair of zeroes.

Append the next pair of zeroes to the 71 => 7100.

Multiply 345 x 10 and add 11 = 3461.

Subtract 3461 from 7100 = 3639.
Subtract 3463 from 3639 = 176.

Write 2 above the third pair of zeroes.

Append the last pair of zeroes to the 176 => 17600

Multiply 3463 x 10 and add 11 = 346241.

We could continue, but it suffices to realize that the next digit will be 0 and so our answer is that the square root of 3 is 1.732 rounded to three decimal places.

For more such insights, log into www.international-maths-challenge.com.

*Credit for article given to Michael Goldenberg*


What is a Ruler and Compass Construction?

I’d never heard of this thing until grad school. And even then, I never asked what it was. Over the course of time I eventually figured it out, but never really got an opportunity to do much with it. Nor have I had a chance to teach it.

A teacher interview question from Oleg Gleizer’s book inspired me to think about, and learn, this nifty skill.

So what is it?

Here’s the definition (mostly from Wikipedia):

A ruler-and-compass construction is the construction of lengths, angles, and geometric figures using only a ruler and compass.

This means that you can take one of those “pointer and pencil circle making things” and anything really straight (the side of your new iPhone, the edge of a file folder, etc.) and make pretty much create anything in geometry.

Pretty cool, huh?

I gave it a shot!

I used Oleg’s teacher interview question:

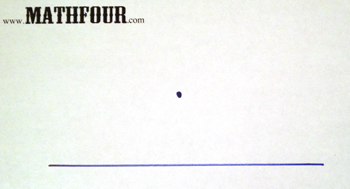
Given a straight line and a point away from it, how would you draw another straight line passing through the point and perpendicular to the original line, using a compass and straightedge as tools?

Can I do it? Of course!

Well… I thought about it and it seemed like I could. So I went out and got a compass, and used a fingernail file as a straight edge. Here’s how I did it:

Here’s the line and the point. Easy peasy.

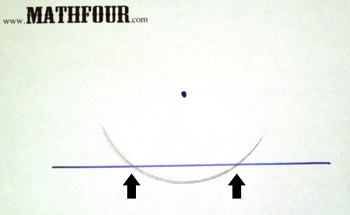
I made an arc from the point through the line, so I would have two spots on the line (where the circle piece went through):

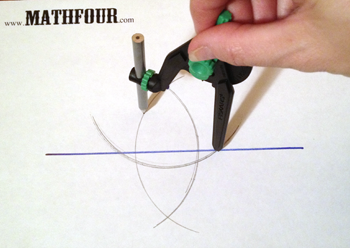
From those two places, I made two more arcs through the point above and long enough to run into each other below:

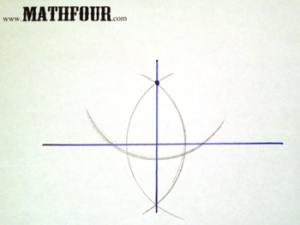
I connected the point with the intersection of the arcs at the bottom and VOILA: perpendicular line to the other line!

Join me in the journey!

This is the first in my ruler and compass journey. They’re kind of fun, and I want to do more. So I will house them here, for future reference.

Here are the first 10 on my list.

  1. Line perpendicular to given line through given point not on given line. (this one)
  2. Perpendicular bisector of given segment.
  3. Right angle at given point on given line.
  4. Square with given segment as side.
  5. Equilateral triangle with given segment as side.
  6. Hexagon with given segment as side.
  7. Copy a given angle to a given segment.
  8. Line parallel to given line through point not on given line.
  9. Dividing given segment into N equal parts.
  10. Bisecting a given angle.

Grab a straightedge and compass for each member of your family – let me know you’re on board in the comments.

For more such insights, log into www.international-maths-challenge.com.

*Credit for article given to Bon Crowder*


The mathematical crimes of the Young Sherlock Holmes series

Dan Smith

Warning this article contains spoilers about the new Amazon Prime series Young Sherlock.

I’ve read the whole Sherlock Holmes canon multiple times over. I love how Holmes uses analytical reasoning to unravel problems that look mysterious, but ultimately prove to have simple explanations. So I was excited when I saw Guy Ritchie’s Young Sherlock appear on Amazon Prime. My excitement was quickly tempered when I started watching, though.

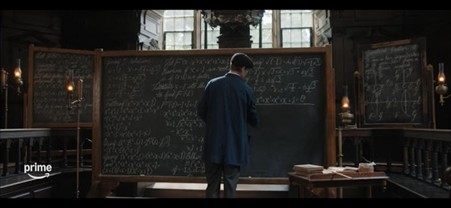
A key part of the plot relies on mathematics. Holmes first meets his sidekick Moriarty (yes, he is working together with his future adversary) at the blackboard after a maths lecture at Oxford. Despite some mistakes in the dialogue, the maths on the blackboard is interesting enough. It is finding the solutions to the equation x5 + x4 + x3 + x2 + x + 1 = 0.

In the maths many of us will have learned at school, we are taught that a positive times a positive makes a positive and that a negative times a negative also makes a positive. For example, 3 times 3 equals 9, but -3 times -3 also equals 9. Squaring a number (when you multiply a number by itself) should always give a positive result. The reverse operation – finding the number(s) you multiply together to give a positive number – is called taking the square root. The two square roots of 9 are 3 and -3, since when you square either of these numbers you get the answer 9.

If we want to take the square root of -1, say, then we need to venture into the realm of imaginary numbers. Imaginary numbers are the square roots of negative numbers. Mathematicians defined the imaginary number i to be the square root of -1 (technically -1 has two square roots i and -i). The square roots of other negative numbers are multiples of i. The square roots of -9, for example are 3i and -3i. Some of the solutions from the equation on the blackboard involve imaginary numbers (this will turn out to be an important plot point).

Mathematical blunders

It’s plausible that the equation on the blackboard might appear in an early first year undergraduate tutorial. Something approaching a passable solution is given, but in excruciating detail (the sort of detail you wouldn’t use at school, let alone in a maths degree at Oxford). And there are mistakes in the maths.

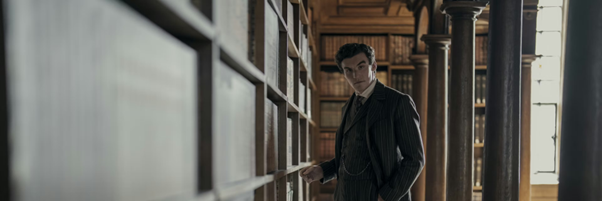
Young Sherlock Holmes contemplates the incorrect solutions on the blackboard. Amazon Prime screenshot

Towards the end of the lecture, the professor sets the students homework to find all the solutions to the equation, even though they are already written on the board (although incorrectly). Despite this, the end of the scene sees Sherlock spending some time trying to think of the solutions before Moriarty comes up and shows him two of the five solutions (as if they were the only ones). Moriarty too writes these down incorrectly, but in a different way to the incorrectness already on the board.

As Moriarty writes down the complex solution (complex means the answer contains both real and imaginary numbers) he says “These solutions, they’re not real. They’re imaginary.” which we can allow (although technically he means complex).

What we can’t forgive is Moriarty going on to say, “That means even if you can’t see the target, you can still shoot for it.” Which is nonsense, even as a metaphor. Complex numbers aren’t targets you can’t see, but well-defined, mainstream (even in the 1870s) mathematical quantities and there’s no sense in which you “aim at” a complex solution to an equation.

Death by numbers

In the last episode, Holmes and his team are battling to halt the distribution of a deadly chemical weapon known as the “creeping death”. They find a scrap of paper in a secret room which they say is the “equation for creating the creeping death.”

I was expecting to see some complex chemical reaction formulae sketched on the page, but when it’s held up to the camera, we see instead a mathematical equation: z3 + 4 z2 – 10 z + 12 = 0.

What does this have to do with the chemical process for creating the deadly nerve agent?

Nothing, it turns out. Or at least nothing I can imagine. In fact it’s a device to allow Holmes and Moriarty to hark back to that moment in the lecture theatre when they first met. What follows goes beyond artistic license into the realm of gibberish.

“If we have the positive equation”, they say, “then we can come up with the negative. And thus create a compound to neutralise the threat of creeping death.” Perhaps they meant “positive solution”, because equations themselves aren’t positive or negative. Either way, the idea that this simple mathematical equation or its solutions are the secret formula for making a weapon of mass destruction doesn’t make sense. There’s no context, no sense in which this equation could be the secret recipe for creating the nerve agent.

Moriarty points out that they have a problem. “This equation is not finished.” By this I think he means that the three solutions to the equation are not written out explicitly.

One solution, z = – 6 is given. And it’s correct. The rest of the scrap of paper contains a reformulation of the equation (a factorisation), which shows that the remaining solutions can be found by solving a quadratic equation: z2 – 2 z + 2 = 0.

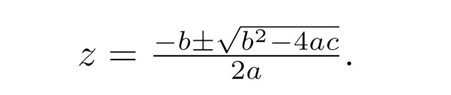
A quadratic equation is just an equation built around a squared term (in this case z2 ), which has two solutions. The formula for the solutions may be familiar to GCSE students (normally aged 15 to 17 years old). For a general quadratic equation: a z2 + b z + c = 0, the two solutions are given below.

Yet, we are supposed to believe that, despite having supposedly solved a far more complicated equation than this in the first episode, Moriarty can’t find the solution to this much simpler equation. So stumped is Moriarty – the future maths professor – that he spends precious time, as a bomb is about to detonate, searching for a piece of paper with this missing solution. He almost loses his life when he could have just used a GCSE-level formula.

The piece of paper he eventually finds contains an incorrect statement of the quadratic formula alongside some nonsensical text, although the solutions are at least correct: z = 1 + i and z = 1 – i (where i, remember, is the imaginary number).

I appreciate my dissection of the maths is high-grade nerdery. Most people will have watched the series without pausing it like I did to look at the maths and probably won’t have noticed. But, if maths is going to be a pivotal plot point in your blockbuster series, then you’ll probably want to make sure you get it right.

For more such insights, log into www.international-maths-challenge.com.

*Credit for article given to Kit Yates*


Teaching maths in the garden: a guide for parents

Keeping children engaged with maths over the summer doesn’t have to be complicated. Grow their maths skills alongside your very own garden with these tips.

As some children continue to learn from home, maintaining their mathematical skills can be a challenge. Parents and caregivers may feel nervous about teaching maths to their children, and even hold onto some maths anxiety themselves.

It’s okay to take a simple approach to maths teaching using objects and environments at home. Have you considered that gardening can be an easy and effective way to help your child connect with mathematical concepts in a concrete and lasting way?

Here are four ways you can support teaching maths in the garden.

1. Invite your child to help with garden planning

Maths is everywhere! And your garden is no exception. Creating gardening maths activities can be as simple as taking notice of what you’re already doing.

Ready to plan your garden? Start by breaking down the information you need. The planning stage of gardening is full of rich mathematical calculations like:

How much space do we have to plant?

How much soil will we need?

How much will it cost?

How far apart will we need to plant the different varieties of flowers or vegetables?

How many rows do we have space to plant? How many columns?

How much sunlight does this spot get? How much sun will our plants need?

To an expert gardener, these may seem like simple things you think about in passing. But they can easily become mathematical tasks you could get your child to help you with.

2. Ask your child to help you find the answers

You need information to get your garden going, and you have a helper ready to get it for you. Ask your child questions that will help you prepare for planting:

Can they measure the length and width of your garden?

Can they find the area?

If it’s a raised garden bed, can they find the height and the volume?

If they know the volume in cubic metres or centimetres, can they express it in litres?

If a standard bag of soil is 50 l and costs £12, can they tell you how many bags you’ll need to fill the garden bed?

Can they tell you how much the soil will cost overall?

Posing mathematical questions that are rooted in reality gives your child and opportunity to use their knowledge. When your child can see why they’re doing something, they develop a deeper conceptual understanding.

3. Challenge your child to find multiple solutions

If you think your child could go a bit further, ask them to plot out where to plant different varieties in your garden. Say you want to plant lettuce, beetroot and carrots — and they all need to be planted the following distances away from other plants:

Lettuce should be planted at least 30 cm away from other plants

Beetroot should be planted at least 10 cm away from other plants

Carrots should be planted at least 5 cm away from other plants

With available garden space in mind, you can ask guiding questions like:

How many configurations could you have?

Could you plant 5 lettuce, 10 beetroot and 20 carrots?

Or could you plant more lettuce and fewer beetroot and carrots?


Ask your child to map it out, and come up with a few different answers. Finding more than one way to solve a problem will boost your child’s reasoning skills, allow them to explore maths for themselves and encourage creativity!

4. Continue learning by encouraging maths journaling

Keeping a garden is a great opportunity for your child to reflect on what they learned in an ongoing maths journal. For example, when your child thinks back on what they did to measure and plan the garden, you could ask:

Why did we need that information?

What did it help us do next?

When planting, they can keep a record of what, where, when and how many seeds were planted. Have them make estimations like:

How many plants do you think will grow?

What do you think the yield will be?

When harvesting, encourage them to refer back to their planting journal and compare.

Can they compare their estimations to the actual yield?

Can they compare the actual yield to the data they recorded when planting?

Can they tell you what percentage of seeds grew into plants?

How could they use their findings in the future?

Reflecting on their learning and answering open questions will help your child master mathematical concepts in depth. Explaining their thinking, getting creative and making connections to what they learned and why, all help to solidify mathematical understanding.

In short, learning maths at home doesn’t need to be complicated. Teaching mathematics can also be a part of teaching your child life lessons and skills, like how to plant a garden.

Learning maths in real-life contexts helps children form a connection with new information, and better understand how to apply it. So they won’t just understand what to do, they’ll understand why they’re doing it.

For more such insights, log into www.international-maths-challenge.com.

*Credit for article given to Lisa Champagne*


Probability underlies much of the modern world – an engineering professor explains how it actually works

Probability can explain why a coin flip has a 50/50 chance of landing heads versus tails, but it also can be used for more powerful applications. Monty Rakusen/DigitalVision via Getty Images

Probability underpins AI, cryptography and statistics. However, as the philosopher Bertrand Russell said, “Probability is the most important concept in modern science, especially as nobody has the slightest notion what it means.”

I teach statistics to engineers, so I know that while probability is important, it is counterintuitive.

Probability is a branch of mathematics that describes randomness. When scientists describe randomness, they’re describing chance events – like a coin flip – not strange occurrences, like a person dressed as a zebra. While scientists do not have a way to predict strange occurrences, probability does predict long-run behavior – that is, the trends that emerge from many repeated events.

We may say ‘random’ to describe strange occurrences (person dressed as zebra), but probability describes chance events (a coin flip). Zebras in La Paz, Bolivia by EEJCC, Own Work CC A-SA 4.0; https://commons.wikimedia.org/wiki/File:Zebra_La_Paz.jpg _ , CC BY-SA

Modeling with probability

Since probability is about events, a scientist must choose which events to study. This choice defines the sample space. When flipping a coin, for example, you might define your event as the way it lands.

Coins almost always land on heads or tails. However, it’s possible – if very unlikely – for a coin to land on its side. So to create a sample space, you’d have two choices: heads and tails, or heads, tails and side. For now, ignore the side landings and use heads and tails as our sample space.

Next, you would assign probabilities to the events. Probability describes the rate of occurrence of an event and takes values between 0% and 100%. For example, a fair flip will tend to land 50% heads up and 50% tails up.

To assign probabilities, however, you need to think carefully about the scenario. What if the person flipping the coin is a cheater? There’s a sneaky technique to “wobble” the coin without flipping, controlling the outcome. Even if you can prevent cheating, real coin flips are slightly more probable to land on their starting face – so if you start the flip with the coin heads up, it’s very slightly more likely to land heads up.

In both the cheating and real flip cases, you need an appropriate sample space: starting face and other face. To have a fair flip in the real world, you’d need an additional step where you randomly – with equal probability – choose the starting face, then flip the coin.

The probabilities for different coin-flipping scenarios. Zachary del Rosario, CC BY-SA

These assumptions add up quickly. To have a fair flip, you had to ignore side landings, assume no one is cheating, and assume the starting face is evenly random. Together, these assumptions constitute a model for the coin flip with random outcomes. Probability tells us about the long-run behavior of a random model. In the case of the coin model, probability describes how many coins land on heads out of many flips.

But instead of using a random model, why not just solve the coin toss using physics? Actually, scientists have done just that, and the physics shows that slight changes in the speed of the flip determine whether it comes up heads or tails. This sensitivity makes a coin flip unpredictable, so a random model is a good one.

Frequency vs. probability

Probability differs from frequency, which is the rate of events in a sequence. For example, if you flip a coin eight times and get two heads, that’s a frequency of 25%. Even if the probability of flipping a coin and seeing heads is 50% over the long run, each short sequence of flips will come out different. Four heads and four tails is the most probable outcome from eight flips, but other events can – and will – happen.

Frequency and probability are the same in one special setting: when the number of data points goes to infinity. In this sense, probability tells us about long-run behavior.

Probabilities for all possible outcomes of eight ‘fair’ coin flips. Zachary del Rosario, CC BY-SA

Applications to AI, cryptography and statistics

Probability isn’t just useful for predicting coin flips. It underlies many modern technological systems.

For example, AI systems such as large language models, or LLMs, are based on next-word prediction. Essentially, they compute a probability for the words that follow your prompt. For example, with the prompt “New York” you might get “City” or “State” as the predicted next word, because in the training data those are the words that most frequently follow.

But since probability describes randomness, the outputs of a LLM are random. Just like a sequence of coin flips is not guaranteed to come out the same way every time, if you ask an LLM the same question again, you will tend to get a different response. Effectively, each next word is treated like a new coin flip.

Randomness is also key to cryptography: the science of securing information. Cryptographic communication uses a shared secret, such as a password, to secure information. However, surprising randomness isn’t good enough for security, which is why picking a surprising word is a bad choice of password. A shared secret is only secure if it’s hard to guess. Even if a word is surprising, real words are easier to guess than flipping a “coin” for each letter.

You can make a much stronger password by using probability to choose characters at random on your keyboard – or better yet, use a password manager.

Finally, randomness is key in statistics. Statisticians are responsible for designing and analyzing studies to make use of limited data. This practice is especially important when studying medical treatments, because every data point represents a person’s life.

The gold standard is a randomized controlled trial. Participants are assigned to receive the new treatment or the current standard of care based on a fair coin flip. It may seem strange to do this assignment randomly – using coin flips to make decisions about lives. However, the unpredictability serves an important role, as it ensures that nothing about the person affects their chance to get the treatment: not age, gender, race, income or any other factor. The unpredictability helps scientists ensure that only the treatment causes the observed result and not any other factor.

So what does probability mean? Like any kind of math, it’s only a model, meaning it can’t perfectly describe the world. In the examples discussed, probability is useful for describing long-term behaviors and using unpredictability to solve practical problems.

For more such insights, log into www.international-maths-challenge.com.

*Credit for article given to Zachary del Rosario*


Teaching mathematical statistics: one lecturer’s way of testing what students understand

Unsplash

It’s getting tougher to assess how much university students have learnt. In his work as a Mathematical Statistics lecturer, Michael von Maltitz has tried a new way of getting students to learn, and of assessing what they’ve absorbed and retained. Students have to show and discuss how they arrived at their understanding of the subject. They can’t just rely on cramming, because he interviews them as if they were applying for a job.

What prompted you to try something new?

“We understand, but how will it be asked in the test?” This is the question that was posed to me time and again in 2019 when I started lecturing a module in mathematical statistics at second-year university level.

I knew I had to make a change. I already understood that students were stressed, prone to memorising content and cramming before tests and examinations, and using short cuts to attain a good grade, rather than to learn anything.

What did you then do differently?

The module was unfamiliar to me so I decided to allow the students to approach the course content in the same way as I was: gathering information from different sources and combining and collating it digitally, reflecting on how it helped to meet certain objectives or learning outcomes.

These portfolios of learning evidence would contain course and outcome information, content knowledge (including theorems and proofs), examples with solutions, showpiece assignments, links to and discussions on online tutorials or videos, and paragraphs of self-reflection. Readers might see these portfolios as “study notes on steroids”.

Assessing the portfolio would be an exercise in evaluating the learning process, rather than a memorised product.

The process was challenging but offered a reward for me and my students – that of discovery. Students seemed to be genuinely learning.

Besides checking their portfolios, I needed a way to assess progress that didn’t fall into the old habits of memorisation and “teaching to the test”. I needed to ensure that a student had created their own portfolio and could defend the content in it. And I needed an assessment method that would not take more time and effort than coming up with a unique written test or examination, formulating a typeset memorandum, and marking more than 100 answer scripts, giving feedback that the students might never look at.

I decided to test this form of deep learning using a workplace method – the interview. In a 30-minute online interview with each student, I asked questions about their understanding of the module content, as well as questions concerning their own portfolios. Each student had to defend the information collected and reflected upon.

The interview worked perfectly when paired with the portfolio. I assessed a set of portfolios in an evening, gave typed feedback, and then interviewed those portfolios’ creators the next day. Feedback was immediate, and the interview assessment became a learning experience, for me and the student.

They were able to defend their portfolios if I made any errors on the portfolio assessment, and I could give the correct answer immediately to any interview question they were stumped by.

Afterwards, the recording of the interview could be given to the student, and if they felt I was being unfair at all, they could compare their interview with another student’s. In doing so, the students themselves could moderate my assessment practice.

What results did you observe?

After a year or two of teaching and assessing like this, I noticed my students seemed to understand more of the content. They retained more into their final year, they were fluent in “statistics” communication and they had better time management and self-reflection skills.

Students told me that they were asked the same questions in their first job interviews as I had asked in my modules, and that they felt much more at ease in those first few job interviews.

How did you confirm these results?

To formally test the developments I had noticed in my students, I conducted research on the class in 2022, which was published in conference proceedings and an article.

This study showed that students experienced significant learning in every facet of an educational framework known as Fink’s taxonomy:

  • foundational knowledge
  • application and communication
  • integration of content into other areas
  • self-reflection
  • interest
  • learning how to learn.

Thus, the method of learning and assessment could formally be called a success within Statistics.

Can this approach be used in other courses?

Yes. One might argue that if this method can be employed for a mathematical module, it can be utilised anywhere. Mathematical modules contain theorems, proofs, definitions, theoretical and practical problem solving – items that might seem difficult to assess through verbal communication. But it is the understanding of the ideas behind the theorems, the stories of and the tricks used within the proofs, the application of the theoretical problems, that are so important in an age where your favourite AI can provide content knowledge.

Mathematical proofs and worked calculations, both of which take time in practice, can be assessed by looking at a portfolio containing these items with the student’s annotations and reflections. The understandings of these concepts are assessed in the interview.

Likewise, in other subjects, a portfolio could be used for assessing knowledge-based content, while the interview could be used to gauge a student’s understanding of what was put into the portfolio, why they chose that content, why the content is important, and how that content is used in practice.

For more such insights, log into www.international-maths-challenge.com.

*Credit for article given to Michael Johan von Maltitz*


Why you can’t tie knots in four dimensions

John M Lund Photography Inc / Getty Images

We all know we live in three-dimensional space. But what does it mean when people talk about four dimensions?

Is it just a bigger kind of space? Is it “space-time”, the popular idea which emerged from Einstein’s theory of relativity?

If you have wondered what four dimensions really look like, you may have come across drawings of a “four-dimensional cube”. But our brains are wired to interpret drawings on flat paper as two- or at most three-dimensional, not four-dimensional.

The almost insurmountable difficulty of visualising the fourth dimension has inspired mathematicians, physicists, writers and even some artists for centuries. But even if we can’t quite imagine it, we can understand it.

What is dimension?

The dimension of a space captures the number of independent directions in it.

A line is one-dimensional. We can move along it forwards and backwards, but these are opposite, not independent, directions. You can also think of a string or piece of rope as practically one-dimensional, as the thickness is negligible compared with the length.

You can move forwards along a rope, or backwards – but not side to side. Zsuzsanna Dancso, CC BY

A surface, such as a soccer field or the skin of a balloon, is two-dimensional. There are independent directions forwards and sideways.

You can move diagonally on a surface, but this is not an independent direction because you can get to the same place by moving forwards, then sideways. The space we live in is three-dimensional: in addition to moving forwards and sideways, we can also jump up and down.

Four-dimensional space has yet another independent direction. This is why space-time is considered four-dimensional: you have the three dimensions of space, but moving forward or backward in time counts as a new direction.

One way to imagine four-dimensional space is as an immersive three-dimensional movie, where each “frame” is three-dimensional and you can also fast-forward and rewind in time.

Consider the cube

A powerful tool for understanding higher dimensions is through analogies in lower dimensions. An example of this technique is drawing cubes in more dimensions.

A “two-dimensional cube” is just a square. To draw a three-dimensional cube, we draw two squares, then connect them corner to corner to make a cube.

So, to draw a four-dimensional cube, start by drawing two three-dimensional cubes, then connect them corner to corner. You can even continue doing this to draw cubes in five or more dimensions. (You will need a large piece of paper and need to keep your lines neat!)

A two-dimensional, a three-dimensional and a four-dimensional cube. Zsuzsanna Dancso, CC BY

This experiment can help accurately determine how many corners and edges a higher-dimensional cube has. But for most of us, it will not help us “see” one. Our brains will only interpret the images as complex webs of lines in two or at most three dimensions.

Knots

We can tie knots in three dimensions because one-dimensional ropes “catch on each other”. This is why a long rope wound around itself, if done right, won’t come apart. We trust knots with our lives when we’re sailing or climbing.

Two ropes catch on each other if pulled in opposite directions. This is what makes knotting possible. Zsuzsanna Dancso, CC BY

But in four dimensions, knots would instantly come apart. We can understand why by using an example in fewer dimensions, like we did with cubes.

Imagine a colony of two-dimensional ants living on a flat surface divided by a line. The ants can’t cross the line: it’s an impassable barrier for them, and they don’t even know the other side of the line exists.

A colony of flat ants in a two-dimensional world don’t even know that a world on the other side of the line exists. Zsuzsanna Dancso, CC BY

But if one day an ant, and its world, becomes three-dimensional, that ant will step over the line with ease. To step over, it needs to move just a tiny bit in the new, vertical direction.

If one ant becomes three-dimensional, it can see across the line and step over it with ease. Zsuzsanna Dancso, CC BY

Now, instead of an ant and a line on a flat surface, imagine a horizontal and a vertical piece of rope in three dimensions. These will catch on each other if pulled in opposite directions.

But if the space became four-dimensional, it would be enough for the horizontal piece of rope to move just a little bit in the new, fourth direction, to avoid the other entirely.

Thinking of four dimensions as a movie, the pieces of rope live in a single, three-dimensional frame. If the horizontal piece of rope shifts just slightly into a future frame, in that frame there is no vertical piece, so it can easily move to the other side of the vertical piece before shifting back.

Imagine four-dimensional space as a movie of three-dimensional frames. The bottom left cube shows a horizontal piece of rope in front of a vertical piece, both in the ‘present’ frame. The horizontal piece can move into the future frame (second column), where it is able to slide towards the back (third column), then move back into the present frame, now behind the vertical piece. Zsuzsanna Dancso, CC BY

From our three-dimensional perspective, the ropes would appear to slide through each other like ghosts.

Knots in more dimensions

Is it impossible, then, to knot a rope in higher dimensions? Yes: any knot tied on a rope will come apart.

But not all is lost: in four-dimensional space you can knot two-dimensional surfaces, such as balloons, large picnic blankets or long tubes.

There is a mathematical formula that determines when knots can stay knotted: take the dimension of the object you want to knot, double it, and add one. According to the formula, this is the maximum dimension of a space where knotting is possible.

The formula implies, for example, that a rope (one-dimensional) can be knotted in at most three dimensions. A (two-dimensional) balloon surface can be knotted in at most five dimensions.

Studying knotted surfaces in four-dimensional space is a vibrant topic of research, which provides mathematical insight into the the still poorly understood mysteries into the intricacies of four-dimensional space.

For more such insights, log into www.international-maths-challenge.com.

*Credit for article given to Zsuzsanna Dancso*