Direct reciprocity facilitates cooperation in repeated social interactions. Traditional models suggest that individuals learn to adopt conditionally cooperative strategies if they have multiple encounters with their partner. However, most existing models make rather strong assumptions about how individuals decide to keep or change their strategies. They assume individuals make these decisions based on a strategy’s average performance. This in turn suggests that individuals would remember their exact payoffs against everyone else.
In a recent study, researchers from the Max Planck Institute for Evolutionary Biology, the School of Data Science and Society, and the Department of Mathematics at the University of North Carolina at Chapel Hill examine the effects of realistic memory constraints. They find that cooperation can evolve even with minimal memory capacities. The research is published in the journal Proceedings of the Royal Society B: Biological Sciences.
Direct reciprocity is based on repeated interactions between two individuals. This concept, often described as “you scratch my back, I’ll scratch yours,” has proven to be a pivotal mechanism in maintaining cooperation within groups or societies.
While models of direct reciprocity have deepened our understanding of cooperation, they frequently make strong assumptions about individuals’ memory and decision-making processes. For example, when strategies are updated through social learning, it is commonly assumed that individuals compare their average payoffs.
This would require them to compute (or remember) their payoffs against everyone else in the population. To understand how more realistic constraints influence direct reciprocity, the current study considers the evolution of conditional behaviours when individuals learn based on more recent experiences.
Two extreme scenarios
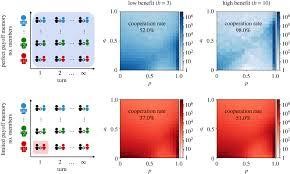
This study first compares the classical modeling approach with another extreme approach. In the classical approach, individuals update their strategies based on their expected payoffs, considering every single interaction with each member of the population (perfect memory). Conversely, the opposite extreme is considering only the very last interaction (limited memory).
Comparing these two scenarios shows that individuals with limited payoff memory tend to adopt less generous strategies. They are less forgiving when someone defects against them. Yet, moderate levels of cooperation can still evolve.
Intermediate cases
The study also considers intermediate cases, where individuals consider their last two or three or four recent experiences. The results show that cooperation rates quickly approach the levels observed under perfect payoff memory.
Overall, this study contributes to a wider literature that explores which kinds of cognitive capacities are required for reciprocal altruism to be feasible. While more memory is always favourable, reciprocal cooperation can already be sustained if individuals have a record of two or three past outcomes.
This work’s results have been derived entirely within a theoretical model. The authors feel that such studies are crucial for making model-informed deductions about reciprocity in natural systems.
For more such insights, log into our website https://international-maths-challenge.com
Credit of the article given to Michael Hesse, Max Planck Society