How can disaster response teams benefit from understanding how people most efficiently pick strawberries together, or how they choose the perfect ice cream shop with friends?
All these scenarios are based on the very fundamental question of how and when human groups manage to adapt collectively to different circumstances. Two recent studies on collective dynamics by the Cluster of Excellence Science of Intelligence (SCIoI) in Berlin, Germany, lay the groundwork to promote better coordinated operations while showcasing the potential of the Cluster’s analytic-synthetic loop approach: an interconnection of a human-focused (analytic) study with a novel computer simulation (synthetic).
By understanding how individual decisions impact group performance, we can possibly enhance emergency services and everyday teamwork, and further develop effective decentralized robotic systems that could benefit society in multiple ways (think robots that explore potentially dangerous places such as a crumbling building).
How groups of people move and make collective decisions (analytic side)
Through a naturalistic immersive-reality experiment, Science of Intelligence researchers have presented new findings on the dynamics of human collective behaviour. The study “Collective incentives reduce over-exploitation of social information in unconstrained human groups,” published in Nature Communications, explores how individual decisions shape collective outcomes in realistic group settings.
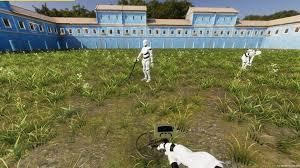
In the experiment, groups of participants freely moved through a 3D virtual environment similar to a video game, searching for hidden treasures. This resembled scenario of hunting and gathering, extinguishing wildfires, or searching for survivors together.
The researchers varied how resources were distributed and how participants were incentivized. Individuals often benefited from staying close to others and taking advantage of their discoveries. However, on the group level, this caused poor group performance.
“It’s a bit like copying homework: You are benefitting yourself but not contributing to group performance in the long run,” said Dominik Deffner. “But it also turned out that rewards on the group level, similar to bonuses for team achievements, reduced this copying behaviour and thereby improved group performance.”
To extract individual decisions from naturalistic societal interactions, the researchers developed a computational modelhelping them to understand key decision-making processes. This model inferred sequences of decisions from visual and movement data and showed that group rewards made people less likely to follow social information, encouraging them to become more selective over time.
The study also looked at how groups moved and acted over time and space, finding a balance between exploring new areas and using known resources at different times. These findings are important for improving group strategies in many areas, like solving problems in businesses or improving search and rescue operations.
How visual perception and embodiment shapes collective decisions (synthetic side)
In a complementary study, called “Visual social information use in collective foraging” and published in PLOS Computational Biology, researchers introduced a new computational model that explores how individual decisions shape collective behaviour.
The model applies to any realistic situation where groups of people, animals, or robots are searching for rewards together. This computational model addresses two main questions: how do individuals make decisions according to visible information around them? And how do they move in a physical space at the same time?
In this study, a simulated swarm of robots searches for resources in a virtual playground very similar to the one by Deffner described above. The resources are in patches and when depleted, they reappear in new spots. The virtual robots can choose between exploring the environment to find new resource patches, following other robots consuming resources, or staying and consuming resources until they’re gone.
The findings show how simple decisions, for example where to go next, can lead to complex group behaviour.
“The environment plays an important role in how groups work efficiently together” said David Mezey. “When resources are concentrated, working closely together and relying on shared information is the most efficient solution. However, when the resources are spread out it’s better for individuals or smaller subgroups to work independently. This explains some everyday group behaviours that many of us may be familiar with.
“Imagine a group of firefighters tasked with putting out a large fire in the forest. If the flames are concentrated in one well-defined area, the best strategy would be for all of them to work together in that specific location. But, if the fire has already spread across patches, it is more effective for the firefighters to split into smaller subgroups to find and tackle the distributed patches independently.”
The study also highlights how physical and visual limitations affect group performance. The authors included real-world limitations in their computer simulations, for example, individuals bumping into each other when too close, or blocking each other’s views.
They discovered that these limitations can fundamentally change collective behaviour and, interestingly, in some cases, even improve group performance. For example, virtual robots with restricted vision focus only on nearby individuals, improving their search strategy. Imagine strawberry picking with friends: even if a friend finds some fruits far away from you, you might want to stay in your area to avoid reaching an already empty patch.
These limitations had similar effects on virtual robots, and this study shows why it’s so important to think about such limitations when studying group behaviour.
Analysing, synthesizing and looping back again
We’ve understood certain animal collective behaviours especially in fish, birds and sheep through simple interaction rules often based on physical principles. However, to understand collective behaviour in humans, we need to understand all the individual decisions that people make and the cognitive processes that produce them.
In the two studies, the researchers link individual cognition to collective outcomes in realistic environments and thus explain complex group outcomes based on individual decisions. In other words, insights from the human-focused study (analytic side) are used to create computational models (synthetic side) that can be applied to better understand phenomena such as collective behaviour and social learning (loop).
This provides a fruitful path forward, hopefully making it possible to understand, predict, and guide collective outcomes in crucial areas.Together, these studies offer a comprehensive understanding of the mechanisms linking individual cognition to collective outcomes in collective foraging tasks, providing new perspectives on optimizing collective performance across various fields. The implications for decentralized robotic systems are particularly promising.
Understanding realistic constraints on group performance might reshape how we develop efficient swarm robotic applications in the future.
For more insights like this, visit our website at www.international-maths-challenge.com.
Credit of the article given to Maria Ott, Technische Universität Berlin – Science of Intelligence