Mathematicians are celebrating a 1000-page proof of the geometric Langlands conjecture, a problem so complicated that even other mathematicians struggle to understand it. Despite that, it is hoped the proof can provide key insights across maths and physics.
The Langlands programme aims to link different areas of mathematics
Mathematicians have proved a key building block of the Langlands programme, sometimes referred to as a “grand unified theory” of maths due to the deep links it proposes between seemingly distant disciplines within the field.
While the proof is the culmination of decades of work by dozens of mathematicians and is being hailed as a dazzling achievement, it is also so obscure and complex that it is “impossible to explain the significance of the result to non-mathematicians”, says Vladimir Drinfeld at the University of Chicago. “To tell the truth, explaining this to mathematicians is also very hard, almost impossible.”
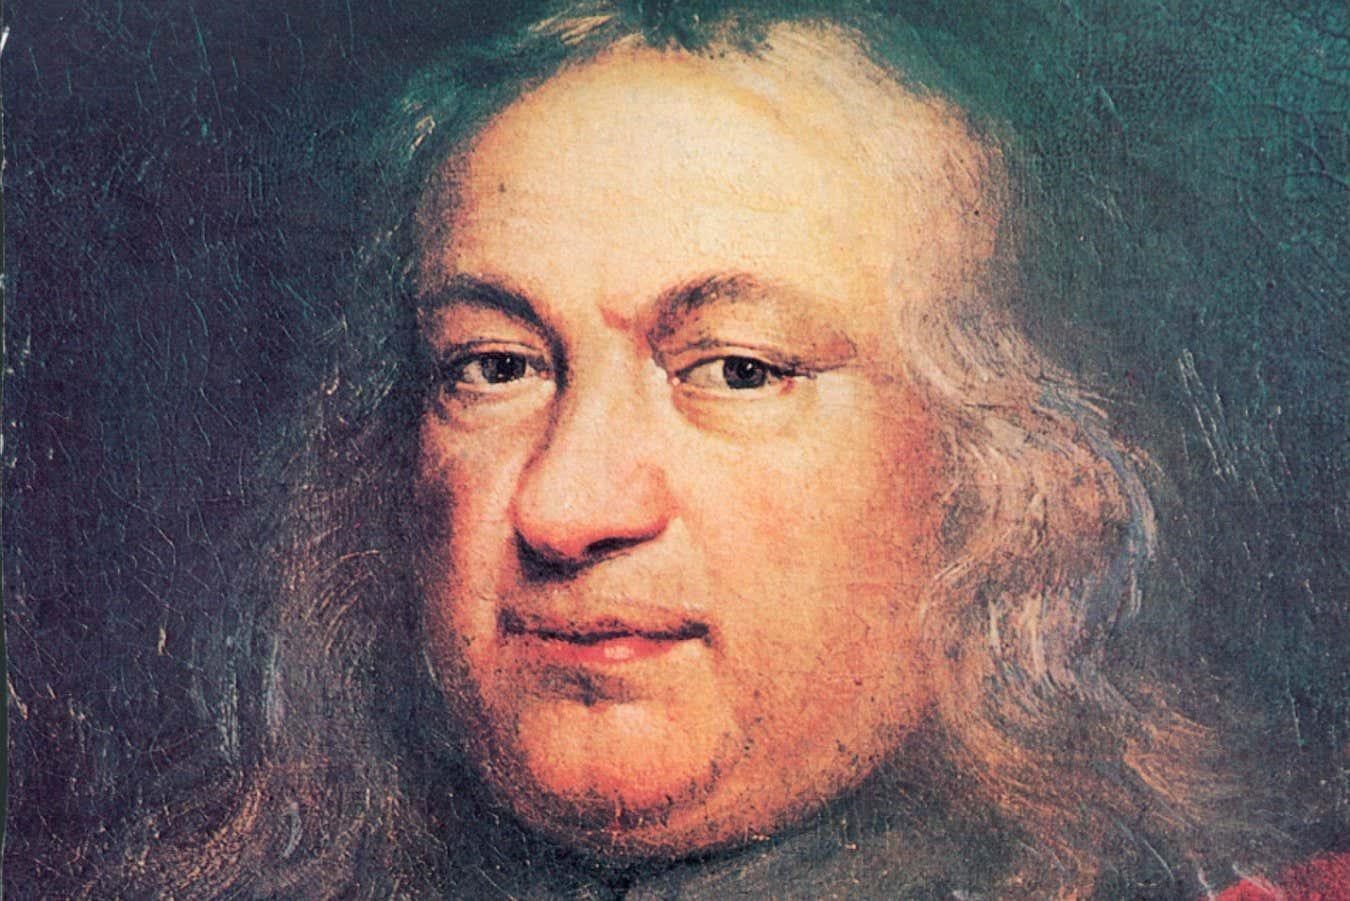
The programme has its origins in a 1967 letter from Robert Langlands to fellow mathematician Andre Weil that proposed the radical idea that two apparently distinct areas of mathematics, number theory and harmonic analysis, were in fact deeply linked. But Langlands couldn’t actually prove this, and was unsure whether he was right. “If you are willing to read it as pure speculation I would appreciate that,” wrote Langlands. “If not — I am sure you have a waste basket handy.”
This mysterious link promised answers to problems that mathematicians were struggling with, says Edward Frenkel at the University of California, Berkeley. “Langlands had an insight that difficult questions in number theory could be formulated as more tractable questions in harmonic analysis,” he says.
In other words, translating a problem from one area of maths to another, via Langlands’s proposed connections, could provide real breakthroughs. Such translation has a long history in maths – for example, Pythagoras’s theorem relating the three sides of a triangle can be proved using geometry, by looking at shapes, or with algebra, by manipulating equations.
As such, proving Langlands’s proposed connections has become the goal for multiple generations of researchers and led to countless discoveries, including the mathematical toolkit used by Andrew Wiles to prove the infamous Fermat’s last theorem. It has also inspired mathematicians to look elsewhere for analogous links that might help. “A lot of people would love to understand the original formulation of the Langlands programme, but it’s hard and we still don’t know how to do it,” says Frenkel.
One analogy that has yielded progress is reformulating Langlands’s idea into one written in the mathematics of geometry, called the geometric Langlands conjecture. However, even this reformulation has baffled mathematicians for decades and was itself considered fiendishly difficult to prove.
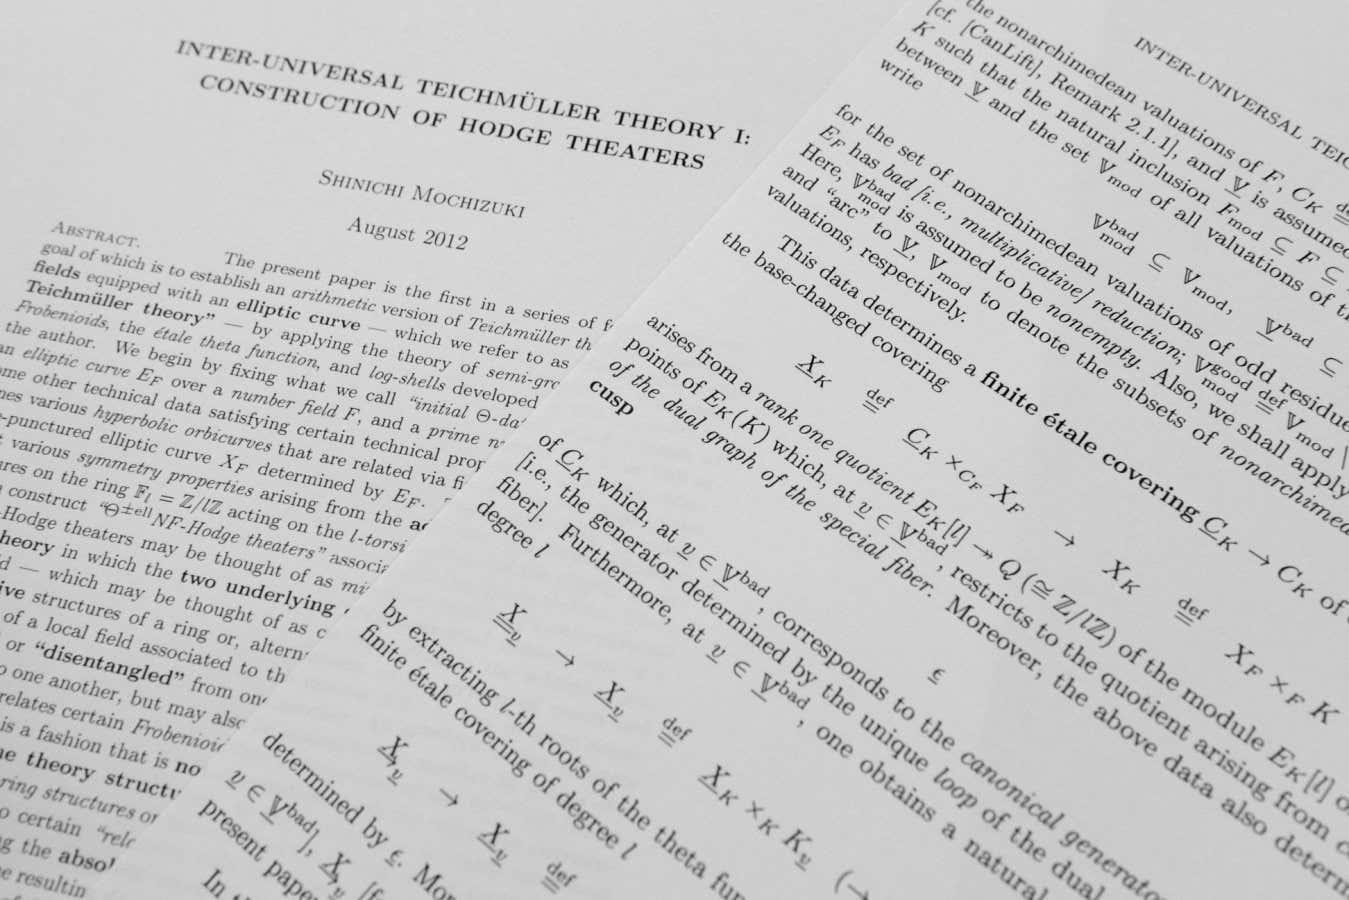
Now, Sam Raskin at Yale University and his colleagues claim to have proved the conjecture in a series of five papers that total more than 1000 pages. “It’s really a tremendous amount of work,” says Frenkel.
The conjecture concerns objects that are similar to those in one half of the original Langlands programme, harmonic analysis, which describes how complex structures can be mathematically broken down into their component parts, like picking individual instruments out of an orchestra. But instead of looking at these with harmonic analysis, it uses other mathematical ideas, such as sheaves and moduli stacks, that describe concepts relating to shapes like spheres and doughnuts.
While it wasn’t in the setting that Langlands originally envisioned, it is a sign that his original hunch was correct, says Raskin. “Something I find exciting about the work is it’s a kind of validation of the Langlands programme more broadly.”
“It’s the first time we have a really complete understanding of one corner of the Langlands programme, and that’s inspiring,” says David Ben-Zvi at the University of Texas, who wasn’t involved in the work. “That kind of gives you confidence that we understand what its main issues are. There are a lot of subtleties and bells and whistles and complications that appear, and this is the first place where they’ve all been kind of systematically resolved.”
Proving this conjecture will give confidence to other mathematicians hoping to make inroads on the original Langlands programme, says Ben-Zvi, but it might also attract the attention of theoretical physicists, he says. This is because in 2007, physicists Edward Witten and Anton Kapustin found that the geometric Langlands conjecture appeared to describe an apparent symmetry between certain physical forces or theories, called S-duality.
The most basic example of this in the real world is in electricity and magnetism, which are mirror images of one another and interchangeable in many scenarios, but S-duality was also used by Witten to famously unite five competing string theory models into a single theory called M-theory.
But before anything like that, there is much more work to be done, including helping other mathematicians to actually understand the proof. “Currently, there’s a very small group of people who can really understand all the details here. But that changes the game, that changes the whole expectation and changes what you think is possible,” says Ben-Zvi.
For more such insights, log into www.international-maths-challenge.com.
*Credit for article given to Alex Wilkins*