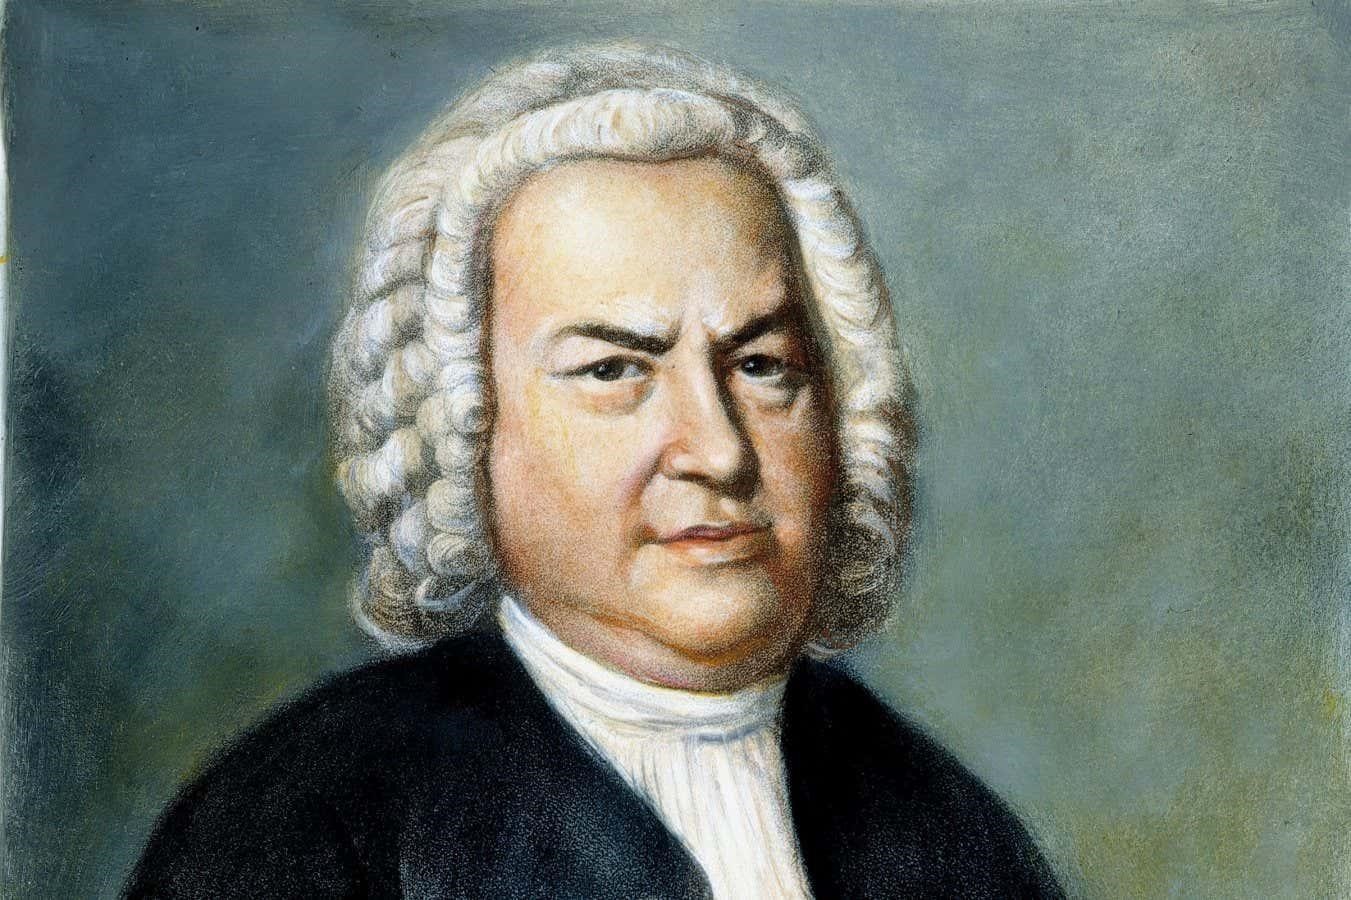
Converting hundreds of compositions by Johann Sebastian Bach into mathematical networks reveals that they store lots of information and convey it very effectively.
Johann Sebastian Bach is considered one of the great composers of Western classical music. Now, researchers are trying to figure out why – by analysing his music with information theory.
Suman Kulkarni at the University of Pennsylvania and her colleagues wanted to understand how the ability to recall or anticipate a piece of music relates to its structure. They chose to analyse Bach’s opus because he produced an enormous number of pieces with many different structures, including religious hymns called chorales and fast-paced, virtuosic toccatas.
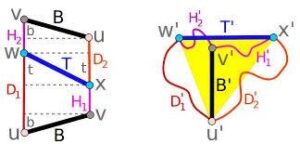
First, the researchers translated each composition into an information network by representing each note as a node and each transition between notes as an edge, connecting them. Using this network, they compared the quantity of information in each composition. Toccatas, which were meant to entertain and surprise, contained more information than chorales, which were composed for more meditative settings like churches.
Kulkarni and her colleagues also used information networks to compare Bach’s music with listeners’ perception of it. They started with an existing computer model based on experiments in which participants reacted to a sequence of images on a screen. The researchers then measured how surprising an element of the sequence was. They adapted information networks based on this model to the music, with the links between each node representing how probable a listener thought it would be for two connected notes to play successively – or how surprised they would be if that happened. Because humans do not learn information perfectly, networks showing people’s presumed note changes for a composition rarely line up exactly with the network based directly on that composition. Researchers can then quantify that mismatch.
In this case, the mismatch was low, suggesting Bach’s pieces convey information rather effectively. However, Kulkarni hopes to fine-tune the computer model of human perception to better match real brain scans of people listening to the music.
“There is a missing link in neuroscience between complicated structures like music and how our brains respond to it, beyond just knowing the frequencies [of sounds]. This work could provide some nice inroads into that,” says Randy McIntosh at Simon Fraser University in Canada. However, there are many more factors that affect how someone perceives music – for example, how long a person listens to a piece and whether or not they have musical training. These still need to be accounted for, he says.
Information theory also has yet to reveal whether Bach’s composition style was exceptional compared with other types of music. McIntosh says his past work found some general similarities between musicians as different from Bach as the rock guitarist Eddie Van Halen, but more detailed analyses are needed.
“I would love to perform the same analysis for different composers and non-Western music,” says Kulkarni.
For more such insights, log into www.international-maths-challenge.com.
*Credit for article given to Karmela Padavic-Callaghan*