Particles Move In Beautiful Patterns When They Have ‘Spatial Memory’

A mathematical model of a particle that remembers its past so that it never travels the same path twice produces stunningly complex patterns.

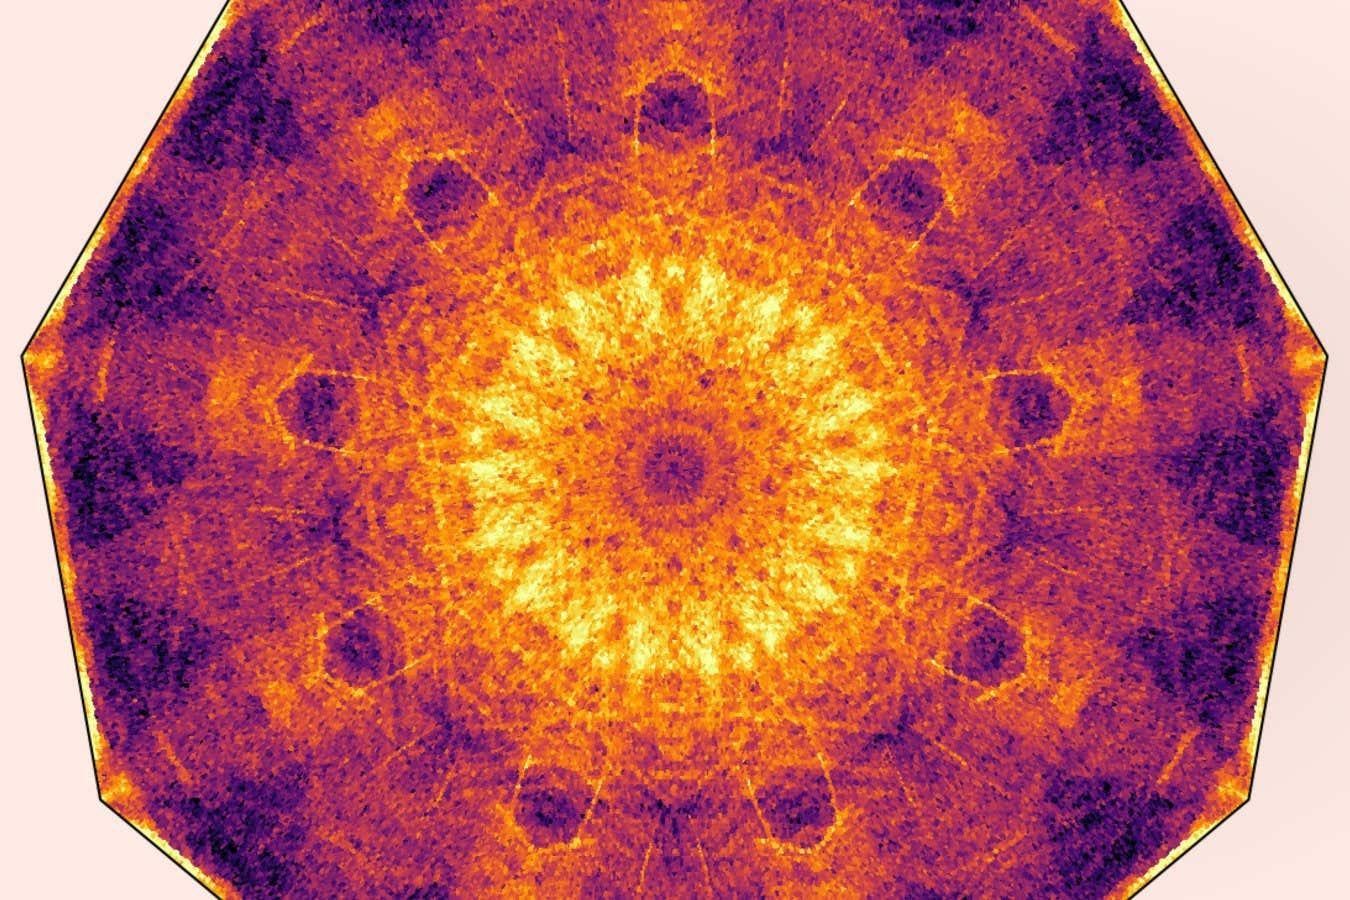
A beautiful and surprisingly complex pattern produced by ‘mathematical billiards’

Albers et al. PRL 2024

In a mathematical version of billiards, particles that avoid retracing their paths get trapped in intricate and hard-to-predict patterns – which might eventually help us understand the complex movement patterns of living organisms.

When searching for food, animals including ants and slime moulds leave chemical trails in their environment, which helps them avoid accidentally retracing their steps. This behaviour is not uncommon in biology, but when Maziyar Jalaal at the University of Amsterdam in the Netherlands and his colleagues modelled it as a simple mathematical problem, they uncovered an unexpected amount of complexity and chaos.

They used the framework of mathematical billiards, where an infinitely small particle bounces between the edges of a polygonal “table” without friction. Additionally, they gave the particle “spatial memory” – if it reached a point where it had already been before, it would reflect off it as if there was a wall there.

The researchers derived equations describing the motion of the particle and then used them to simulate this motion on a computer. They ran over 200 million simulations to see the path the particle would take inside different polygons – like a triangle and a hexagon – over time. Jalaal says that though the model was simple, idealised and deterministic, what they found was extremely intricate.

Within each polygon, the team identified regions where the particle was likely to become trapped after bouncing around for a long time due to its “remembering” its past trajectories, but zooming in on those regions revealed yet more patterns of motion.

“So, the patterns that you see if you keep zooming in, there is no end to them. And they don’t repeat, they’re not like fractals,” says Jalaal.

Katherine Newhall at the University of North Carolina at Chapel Hill says the study is an “interesting mental exercise” but would have to include more detail to accurately represent organisms and objects that have spatial memory in the real world. For instance, she says that a realistic particle would eventually travel in an imperfectly straight line or experience friction, which could radically change or even eradicate the patterns that the researchers found.

For more such insights, log into www.international-maths-challenge.com.

*Credit for article given to Karmela Padavic-Callaghan*


Mathematics: Why We Need More Qualified Teachers

There is a crisis in the education system, and it’s affecting the life chances of many young Australians. The number of secondary teaching graduates with adequate qualifications to teach mathematics is well below what it should be, and children’s education is suffering.

A report completed for the Australian Council of Deans of Science in 2006 documented the problem, but the situation has deteriorated since. The percentage of Year 12 students completing the more advanced mathematics courses continues to decline. This affects mathematics enrolments in the universities and a number no longer offer a major in mathematics, worsening an already inadequate supply of qualified teachers.

Changing qualifications

To exacerbate an already serious problem, the Australian Institute for Teaching and School Leadership (AITSL) currently proposes that graduate entry secondary programs must comprise at least two years of full-time equivalent professional studies in education.

There will be no DipEd pathway, which allows graduates to enter the profession within a year. Forcing them to spend more time in education will lead to increased debt. You couldn’t blame people for changing their mind about becoming a teacher.

I believe the changes in qualifications will lead to a disaster, denying even more young people access to a quality mathematics education that gives them real opportunities in the modern world.

An unequal opportunity

This is a social justice issue because access to a decent mathematics education in Australia is now largely determined by where you live and parental income.

In the past there have been concerns regarding the participation of girls in mathematics and the effect on their careers and life chances.

Australia now seems incapable of responding to a situation where only the privileged have access to well-qualified teachers of mathematics.

The Northern Territory is a prime example. The contraction of mathematics at Charles Darwin University means the NT is now totally dependent on the rest of Australia for its secondary mathematics teachers. And how can talented mathematics students in the NT be encouraged to pursue mathematical careers when it means moving away?

Elsewhere most of regional Australia is largely dependent on mathematics teachers who complete their mathematics in the capital or large regional cities.

Examine the policy

In what is supposed to be a research-driven policy environment, has anyone considered the consequences of the AITSL proposal? And whether this will actually give teachers the skills they need for the positions they subsequently occupy?

In my own case I came to Melbourne with a BSc (Hons) from the University of Adelaide. In the early 1970s I completed a DipEd at La Trobe. The only real cost was some childcare. If I remember correctly the government was so keen to get professional women into the workforce they even helped with the cost of books. Would I have committed to a two-year course? I’m not sure but I had no HECS debt and ongoing employment was just about guaranteed.

My first school had a very high percentage of students from a non-English speaking background. Many of the Year 7s had very poor achievement in mathematics and I turned my attention to finding out what could be done to help them reach a more appropriate standard.

In the course of this I met Associate Professor John Munro who stressed the importance of language in the learning of mathematics. To be a better mathematics teacher, I completed another degree in teaching English as a second language.

Later I coordinated a DipEd program. Many of our better students were of a mature age and struggling with money, family, jobs and a host of other things. They managed for a year. Requiring them to complete two would have seen many of them not enrol in the first place or drop out when it became too much.

Learn on the job

A two-year teaching qualification does not necessarily equip you for the teaching situation you find yourself in. If AITSL wants all teachers to have a second year, let that be achieved in work-related learning over, for example, 5-7 years.

Australia can’t afford to lose a single prospective teacher who is an articulate, well-qualified graduate in mathematics. If the one-year DipEd goes, many will be lost. They have too many options. The new graduates will think about other courses, the career change, mature-age graduates will decide it is all too hard.

For more such insights, log into www.international-maths-challenge.com.

*Credit for article given to Jan Thomas*


A Rethink Of Cause And Effect Could Help When Things Get Complicated

Some scientists insist that the cause of all things exists at the most fundamental level, even in systems as complex as brains and people. What if it isn’t so?

There are seconds left on the clock, and the score is 0-0. Suddenly, a midfielder seizes possession and makes a perfect defence-splitting pass, before the striker slots the ball into the bottom corner to win the game. The moment will be scrutinised ad nauseam in the post-match analysis. But can anyone really say why the winners won?

One thing is for sure, precious few would attribute the victory to quantum mechanics. But isn’t that, in the end, all there is? A physicist might claim that to explain what happens to a football when it is kicked, the interactions of quantum particles are all you need. But they would admit that, as with many things we seek to understand, there is too much going on at the particle-level description to extract real understanding.

Identifying what causes what in complex systems is the aim of much of science. Although we have made amazing progress by breaking things down into ever smaller components, this “reductionist” approach has limits. From the role of genetics in disease to how brains produce consciousness, we often struggle to explain large-scale phenomena from microscale behaviour.

Now, some researchers are suggesting we should zoom out and look at the bigger picture. Having created a new way to measure causation, they claim that in many cases the causes of things are found at the more coarse-grained levels of a system. If they are right, this new approach could reveal fresh insights about biological systems and new ways to intervene – to prevent disease, say. It could even shed light on the contentious issue of free will, namely whether it exists.

The problem with the reductionist approach is apparent in many fields of science, but let’s take applied genetics. Time and again, gene variants associated with a particular disease or trait are hunted down, only to find that knocking that gene out of action makes no apparent difference. The common explanation is that the causal pathway from gene to trait is tangled, meandering among a whole web of many gene interactions.

The alternative explanation is that the real cause of the disease emerges only at a higher level. This idea is called causal emergence. It defies the intuition behind reductionism, and the assumption that a cause can’t simply appear at one scale unless it is inherent in microcauses at finer scales.

Higher level

The reductionist approach of unpicking complex problems into their constituent parts has often been fantastically useful. We can understand a lot in biology from what enzymes and genes do, and the properties of materials can often be rationalised from how their constituent atoms and molecules behave. Such successes have left some researchers suspicious of causal emergence.

“Most people agree that there is causation at the macro level,” says neuroscientist Larissa Albantakis at the University of Wisconsin-Madison. “But they also insist that all the macroscale causation is fully reducible to the microscale causation.”

Neuroscientists Erik Hoel at Tufts University in Massachusetts and Renzo Comolatti at the University of Milan in Italy are seeking to work out if causal emergence really exists and if so, how we can identify it and use it. “We want to take causation from being a philosophical question to being an applied scientific one,” says Hoel.

The issue is particularly pertinent to neuroscientists. “The first thing you want to know is, what scales should I probe to get relevant information to understand behaviour?” says Hoel. “There’s not really a good scientific way of answering that.”

Mental phenomena are evidently produced by complex networks of neurons, but for some brain researchers, the answer is still to start at small scales: to try to understand brain function on the basis of how the neurons interact. The European Union-funded Human Brain Project set out to map every one of the brain’s 86 billion neurons, in order to simulate a brain on a computer. But will that be helpful?

Some think not: all the details will just obscure the big picture, they say. After all, you wouldn’t learn much about how an internal combustion engine works by making an atomic-scale computer simulation of one. But if you stick with a coarse-grained description, with pistons and crankshafts and so on, is that just a convenient way of parcelling up all the atomic-scale information into a package that is easier to understand?

The default assumption is that all the causal action still happens at the microscopic level, says Hoel, but we simply “lack the computing power to model all the microphysical details, and that’s why we fixate on particular scales”. “Causal emergence,” he says, “is an alternative to this null hypothesis.” It says that, for some complex systems, looking at a coarse-grained picture isn’t just tantamount to data compression that dispenses with some detail. Instead, it is proposing that there can be more causal clout at these higher levels than there is below. Hoel reckons he can prove it.

To do so, he first had to establish a method for identifying the cause of an effect. It isn’t enough to find a correlation between one state of affairs and another: correlation isn’t causation, as the saying goes. Just because the number of people eating ice creams correlates with the number who get sunburn, it doesn’t mean that one causes the other. Various measures of causation have been proposed to try to get to the root of such correlations and see if they can be considered causative.

In 2013, Hoel, working with Albantakis and fellow neuroscientist Giulio Tononi, also at the University of Wisconsin-Madison, introduced a new way to do this, using a measure called “effective information”. This is based on how tightly a scenario constrains the past causes that could have produced it (the cause coefficient) and the constraints on possible future effects (the effect coefficient). For example, how many other configurations of football players would have allowed that midfielder to release the striker into space, and how many other outcomes could have come from the position of the players as it was just before the goal was scored? If the system is really noisy and random, both coefficients are zero; if it works like deterministic clockwork, they are both 1.

Effective information thus serves as a proxy measure of causal power. By measuring and comparing it at different scales in simple model systems, including a neural-like system, Hoel and his colleagues demonstrated that there could be more causation coming from the macro than from the micro levels: in other words, causal emergence.

Quantifying causation

It is possible that this result might have been a quirk of the models they used, or of their definition of effective information as a measure of causation. But Hoel and Comolatti have now investigated more than a dozen different measures of causation, proposed by researchers in fields including philosophy, statistics, genetics and psychology to understand the roots of complex behaviour. In all cases, they saw some form of causal emergence. It would be an almighty coincidence, Hoel says, if all these different schemes just happened to show such behaviour by accident.

The analysis helped the duo to establish what counts as a cause. We might be more inclined to regard something as a genuine cause if its existence is sufficient to bring about the result in question. Does eating ice cream on its own guarantee a high chance of sunburn, for example? Obviously not. We can also assess causation on the basis of necessity: does increased sunburn only happen if more ice creams are consumed, and not otherwise? Again, evidently not: if the ice-cream seller takes a day off on a sunny day, sunburn can still happen. Causation can thus be quantified in terms of the probability that a set of affairs always and only leads to an effect.

Their work has its critics. Judea Pearl, a computer scientist at the University of California, Los Angeles, says that attempts to “measure causation in the language of probabilities” are outdated. His own models simply state causal structures between adjacent components and then use these to enumerate causal influences between more distantly connected components. But Hoel says that in his latest work with Comolatti, the measures of causation they consider include such “structural causal models” too.

Their conclusion that causal emergence really exists also finds support in recent work by physicists Marius Krumm and Markus Müller at the University of Vienna in Austria. They have argued that the behaviour of some complex systems can’t be predicted by anything other than a complete replay of what all of the components do at all levels; the microscale has no special status as the fundamental origin of what happens at the larger scales. The larger scales, they say, might then constitute the real “computational source” – what you might regard as the cause – of the overall behaviour.

In the case of neuroscience, Müller says, thoughts and memories and feelings are just as much “real” causal entities as are neurons and synapses – and perhaps more important ones, because they integrate more of what goes into producing actual behaviour. “It’s not the microphysics that should be considered the cause for an action, but its high-level structure.” says Müller. “In this sense we agree with the idea of causal emergence.”

Causal emergence seems to also feature in the molecular workings of cells and whole organisms, and Hoel and Comolatti have an idea why. Think about a pair of heart muscle cells. They may differ in some details of which genes are active and which proteins they are producing more of at any instant, yet both remain secure in their identity as heart muscle cells – and it would be a problem if they didn’t. This insensitivity to the fine details makes large-scale outcomes less fragile, says Hoel. They aren’t contingent on the random “noise” that is ubiquitous in these complex systems, where, for example, protein concentrations may fluctuate wildly.

As organisms got more complex, Darwinian natural selection would therefore have favoured more causal emergence – and this is exactly what Hoel and his Tufts colleague Michael Levin have found by analysing the protein interaction networks across the tree of life. Hoel and Comolatti think that by exploiting causal emergence, biological systems gain resilience not only against noise, but also against attacks. “If a biologist could figure out what to do with a [genetic or protein] wiring diagram, so could a virus,” says Hoel. Causal emergence makes the causes of behaviour cryptic, hiding it from pathogens that can only latch onto molecules.

Whatever the reasons behind it, recognising causal emergence in some biological systems could offer researchers more sophisticated ways to predict and control those systems. And that could in turn lead to new and more effective medical interventions. For example, while genetic screening studies have identified many associations between variations of different genes and specific diseases, such correlations have rarely translated into cures, suggesting these correlations may not be signposts to real causal factors. Instead of assuming that specific genes need to be targeted, a treatment might need to intervene at a higher level of organisation. As a case in point, one new strategy for tackling cancer doesn’t worry about which genetic mutation might have made a cell turn cancerous, but instead aims to reprogramme it at the level of the whole cell into a non-malignant state.

You decide?

Suppressing the influence of noise in biological systems may not be the only benefit causal emergence confers, says Kevin Mitchell, a neuroscientist at Trinity College Dublin, Ireland. “It’s also about creating new types of information,” he says. Attributing causation is, Mitchell says, also a matter of deciding which differences in outcome are meaningful and which aren’t. For example, asking what made you decide to read New Scientist is a different causal question to asking what made you decide to read a magazine.

Which brings us to free will. Are we really free to make decisions like that anyway, or are they preordained? One common argument against the existence of free will is that atoms interact according to rigid physical laws, so the overall behaviour they give rise to can be nothing but the deterministic outcome of all their interactions. Yes, quantum mechanics creates some randomness in those interactions, but if it is random, it can’t be involved in free will. With causal emergence, however, the true causes of behaviour stem from higher degrees of organisation, such as how neurons are wired, our brain states, past history and so on. That means we can meaningfully say that we – our brains, our minds – are the real cause of our behaviour.

That is certainly how neuroscientist Anil Seth at the University of Sussex, UK, sees things. “What one calls ‘real’ is of course always going to be contentious, but there is no objection in my mind to treating emergent levels of description as being real,” he says. We do this informally anyway: we speak of our thoughts, desires and goals. “The trick is to come up with sensible ways to identify and measure emergence,” says Seth. Like Hoel and Comolatti, he is pursuing ways of doing that.

Hoel says that the work demonstrating the existence of causal emergence “completely obviates” the idea that “all the causal responsibility drains down to the lower scale”. It shows that “physics is not the only science: there are real entities that do causal work at higher levels”, he says – including you.

Case closed? Not quite. While Mitchell agrees that causal emergence allows us to escape being ruled by the laws of quantum mechanics, he adds that what most people mean by free will requires an additional element: the capacity for conscious reflection and deliberate choice. It may be that we experience this sense of free will in proportion to the degree to which our higher-level brain states are genuine emergent causes of behaviour. Our perception of executing voluntary actions, says Seth, “may in turn relate to volition involving a certain amount of downward causality”.

In other words, you really are more than the sum of your atoms. If you think you made a choice to read this article, you probably did.

For more such insights, log into www.international-maths-challenge.com.

*Credit for article given to Philip Ball*


Superman Returns – But Who’s Looking After His Water?

Is it a plane? No, it’s Smoothed Particle Hydrodynamics.

Watching films such as Superman Returns or The Day after Tomorrow, you would have seen dramatic sequences of surging water and crumbling buildings.

While doing so, mathematics was probably the last thing you thought about; but without it, scenes of this nature would be virtually impossible.

Take the 2006 film Superman Returns. In one scene, a giant spherical object smashes into a water tank releasing a huge amount of water (see below).

Traditionally, the only possible way to create this kind of sequence would be to use small models – which produce unrealistic results. Or we could create a computer simulation.

Swapping droplets for particles

These days, one of the most popular methods for simulating water is to replace fluid with millions of individual particles within a computer simulation.

And the way these particles move is determined by an algorithm that my colleagues and I invented to simulate the formation of stars in our galaxy’s giant molecular clouds.

The method is known as Smoothed Particle Hydrodynamics (SPH) and the use of SPH in Superman Returns is the work of an American visual effects company called Tweak.

Superman Returns certainly isn’t the only film to feature SPH fluid simulations: think of Gollum falling into the lava of Mount Doom in Lord of the Rings: Return of the King; or the huge alligator splashing through a swamp in Primeval.

These particular scenes are the work of people at a Spanish visual effects company called NextLimit, who received an Oscar for their troubles.

How does SPH work?

Rather than trying to model a body of water as a whole, SPH replaces the fluid with a set of particles. A mathematical technique then uses the position and masses of these particles to determine the density of the fluid being modelled.

Using the density and pressure of the fluid, SPH makes it possible to map the force acting on each particle within the fluid. This technique provides results quite similar to the actual fluid being modelled. And the more particles used in the simulation, the more accurate the model becomes.

This SPH simulation uses 128,000 particles to model a fluid.

Beyond the basics

In Superman Returns, gravity also affects how the body of water behaves (the water spills out of the water tank) and SPH can easily be adapted to accomodate this.

In addition, fluids often need to flow around solid bodies such as rocks and buildings that might be carried, bobbing along, by the flow. The SPH method can be easily extended to handle this combination of solid bodies and fluids by adding sets of particles to the equation, to represent the solid bodies.

These adjustments and extensions to SPH can be made to produce very realistic-looking results.

In industry, SPH is used to describe the motion of offshore rigs in a storm, fluid flow in pumps, and injection moulding of liquid metals. In zoology, it’s being used to investigate the dynamics of fish.

SPH and the stars

As hinted at above, it’s not just water and its inhabitants that can be modelled using this technique.

SPH simulations of star formation by Matthew Bate, from the University of Exeter, and Daniel Price, of Monash, have been able to predict the masses of the stars, and the number of stable two- and three-star systems that form from a typical molecular cloud.

In the case of stable two-star systems (known as binaries) SPH can predict the shape of the orbits in good agreement with astronomical observations.

To get this level of accuracy, millions of particles are used in the SPH calculation, and the motion of these particles is calculated on a number of computer systems that work together in parallel.

SPH is also the method of choice for following the evolution of the universe after the Big Bang. This evolution involves dark matter and gas, and the simulations have one set of SPH particles for the dark matter and one set for the gas.

An advanced SPH code – known as Gadget – used for this purpose was developed by Volker Springel. The code enables astrophysicists to predict the way galaxies form and their distribution in the universe, including the effects of General Relativity.

But for non-astrophysicists, admittedly, the movies may be more of a draw.

So next time you’re watching a film and you see large swathes of water in unusual places or doing incredibly destructive things, think about maths for a moment: without it, such breathtaking scenes would be virtually impossible.


For more such insights, log into www.international-maths-challenge.com.

*Credit for article given to Joe Monaghan*


Millennium Prize: The Hodge Conjecture

If one grossly divides mathematics into two parts they would be: tools for measuring and tools for recognition.

To use an analogy, tools for measuring are the technologies for collecting data about an object, the process of “taking a blurry photograph”. Tools for recognition deal with the following: if you are given a pile of data or a blurry photograph, how can the object that it came from be recognised from the data?

The Hodge Conjecture – a major unsolved problem in algebraic geometry – deals with recognition.

William Vallance Douglas Hodge was a professor at Cambridge who, in the 1940s, worked on developing a refined version of cohomology – tools for measuring flow and flux across boundaries of surfaces (for example, fluid flow across membranes).

The classical versions of cohomology are used for the understanding of the flow and dispersion of electricity and magnetism (for example, Maxwell’s equations, which describe how electric charges and currents act as origins for electric and magnetic fields). These were refined by Hodge in what is now called the “Hodge decomposition of cohomology”.

Hodge recognised that the actual measurements of flow across regions always contribute to a particular part of the Hodge decomposition, known as the (p,p) part. He conjectured that any time the data displays a contribution to the (p,p) part of the Hodge decomposition, the measurements could have come from a realistic scenario of a system of flux and change across a region.

Or, to put this as an analogy, one could say Hodge found a criterion to test for fraudulent data.

If Hodge’s test comes back positive, you can be sure the data is fraudulent. The question in the Hodge conjecture is whether there is any fraudulent data which Hodge’s test will not detect. So far, Hodge’s test seems to work.

But we haven’t understood well enough why it works, and so the possibility is open that there could be a way to circumvent Hodge’s security scheme.

Hodge made his conjecture in 1950, and many of the leaders in the development of geometry have worked on this basic recognition problem. The problem itself has stimulated many other refined techniques for measuring flow, flux and dispersion.

Tate’s 1963 conjecture is another similar recognition question coming out of another measurement technique, the l-adic cohomology developed by Alexander Grothendieck.

The strongest evidence in favour of the Hodge conjecture is a 1995 result of Cattani, Deligne & Kaplan which studies how the Hodge decomposition behaves as a region mutates.

Classical cohomology measurements are not affected by small mutations, but the Hodge decomposition does register mutations. The study of the Hodge decomposition across mutations provides great insight into the patterns in data that must occur in true measurements.

In the 1960s, Grothendieck initiated a powerful theory generalising the usual concept of “region” to include “virtual regions” (the theory of motives on which one could measure “virtual temperatures” and “virtual magnetic fields”.

In a vague sense, the theory of motives is trying to attack the problem by trying to think like a hacker. The “Standard Conjectures” of Grothendieck are far-reaching generalisations of the Hodge conjecture, which try to explain which virtual regions are indistinguishable from realistic scenarios.

The question in the Hodge conjecture has stimulated the development of revolutionary tools and techniques for measurement and analysis of data across regions. These tools have been, and continue to be, fundamental for modern development.

Imagine trying to building a mobile phone without an understanding of how to measure, analyse and control electricity and magnetism. Alternatively, imagine trying to sustain an environment without a way to measure, analyse and detect the spread of toxins across regions and in waterways.

Of course, the tantalising intrigue around recognition and detection problems makes them thrilling. Great minds are drawn in and produce great advances in an effort to understand what makes it all work.

One might, very reasonably, claim that the longer the Hodge conjecture remains an unsolved problem the more good it will do for humanity, driving more and more refined techniques for measurement and analysis and stimulating the development of better and better methods for recognition of objects from the data.

The Clay Mathematics Institute was wise in pinpointing the Hodge conjecture as a problem that has the capacity to stimulate extensive development of new methods and technologies and including it as one of the Millennium problems.

For more such insights, log into www.international-maths-challenge.com.

*Credit for article given to Arun Ram*


Want To Win at Gambling? Use Your Head

When you know the numbers, things get a whole lot easier. Roberto Bouza

Gambling in Australia – Some say “punting is a mug’s game”. But is this always true, or can an astute gambler make long-term profits?

Certainly not from casino games. Casinos make profits by paying less than they should on winning bets. A roulette wheel has 37 numbers, so a gambler who bets a dollar has a 1/37 chance of winning and should receive back $37 on a winning number.

But the casino pays only $36.

On average, a gambler loses $1 for every $37 they bet: a loss of 2.7%.

This is the cost of playing the game and it’s the profit the casino makes often called the “house percentage”.

Houses of all sizes

For casino games such as roulette, Keno and poker machines, the house percentage can be calculated mathematically, and in spite of many proposed betting systems, is an immutable and unchangeable number. No strategy can be used by the punter to make the game profitable.

While gamblers may experience short-term lucky streaks, in the long run they will lose this predetermined percentage of their wagers. But a sensible casino gambler should at least be familiar with the house percentages:

Betting the win line at craps at 1.4%, or red or black at roulette at 2.7%, might be a better option than Keno or Lotto with a house percentage of over 40%.

Let’s be clear here: for every $100 bet through Tattslotto or Powerball, the “house” only pays out $60, keeping $40 for itself.

But sports betting is different.

In a horse race, the chance of winning (and hence the price for a winning bet) is determined subjectively, either by the bookmaker or by the weight of money invested by the public.

If 20% of the amount a bookmaker takes on a race is for the favourite, the public is effectively estimating that particular horse’s chance of winning at one in five. But the bookmaker might set the horse’s winning price at $4.50 (for every $1 bet, the punter gets $4.50 back), giving the bookie a house percentage of 10%.

But a trainer, or jockey with inside knowledge (or statistician with a mathematical model based on past data), may estimate this same horse’s chances at one in three. If the savvy punter is correct, then for every $3 bet they average $4.50 return.

A logical punter looks for value – bets that pay more than a fair price as determined by their true probability of winning. There are several reasons why sports betting lends itself to punters seeking value bets.

A sporting chance

In general, more outcomes in a game allow for a higher house percentage. With two even outcomes (betting on a head or tail with a single coin toss, say), a fair price would be $2.

The operator might be able to pay out as little $1.90, giving a house percentage of 5%, but anything less than this would probably see little interest from gamblers.

But a Keno game with 20 million outcomes might only pay $1 million for a winning $1 bet, rather than a fair $20,000,000. A payout of $1 million gives a staggering house percentage of 95%.

Traditionally, sports betting was restricted to horse, harness and dog racing – events with several outcomes that allowed house percentages of around 15%-20%.

With the extension into many other team and individual sports, betting on which of the two participants would win reduced a bookmaker’s take to as little as 3%-4%.

Competition reduces this further. Only the state-run totalisator (an automated system which like Tattslotto, determined the winning prices after the event, thus always ensuring the legislated house percentage), and a handful of on-course bookmakers were originally allowed to offer bets on horse racing, whereas countless internet operators now compete.

Betfair even allows punters to bet against each other, effectively creating millions of “bookmakers”.

Head or heart

Many sports punters bet with their hearts, not their heads. This reduces the prices of popular players or teams, thereby increasing the price of their opponents. The low margins and extensive competition even allow punters to sometimes find arbitrage opportunities (where betting on both sides with different bookmakers allows a profit whoever wins).

To overcome their heart, and lack of inside knowledge, many mathematicians create mathematical and statistical models based on past data and results to predict the chances of sports outcomes. They prove the veracity of their models by testing (either on past data or in real time) whether they would profit if the predictions were used for betting.

Academics call the ability to show a profit the “inefficiency of betting markets”, and there are many papers to suggest sports markets are inefficient. Of course the more successful have a vested interest in keeping their methods to themselves and may not publicise their results.

Astute punters can make sports betting profitable in the long term. But the profits made by the plethora of sports bookmakers indicate that most sports punters are not that astute.

For more such insights, log into www.international-maths-challenge.com.

*Credit for article given to Stephen Clarke*


Physicists are Turning to Lewis Carroll For Help With Their Maths

Lewis Caroll was the pen name for mathematician Charles Dodgson

Curiouser and curiouser! Particle physicists could have the author of Alice’s Adventures in Wonderland to thank for simplifying their calculations.

Lewis Carroll, the 19th century children’s author, was the pen name of mathematician Charles Lutwidge Dodgson. While his mathematical contributions mostly proved unremarkable, one particular innovation may have stood the test of time.

Marcel Golz at Humboldt University, Berlin has built on Dodgson’s work to help simplify the complex equations that arise when physicists try to calculate what happens when particles interact. The hope is that it could allow for speedier and more accurate computations, allowing experimentalists at places like the Large Hadron Collider in Geneva, Switzerland to better design their experiments.

Working out the probabilities of different particle interactions is commonly done using Feynman diagrams, named after the Nobel prize winning physicist Richard Feynman. These diagrams are a handy visual aid for encoding the complex processes at play, allowing them to be converted into mathematical notation.

One early way of representing these diagrams was known as the parametric representation, which has since lost favour among physicists owing to its apparent complexity. To mathematicians, however, patterns in the resulting equations suggest that it might be possible to dramatically simplify them in ways not possible for more popular representations. These simplifications could in turn enable new insights. “A lot of this part of physics is constrained by how much you can compute” says Karen Yeats, a mathematician at the university of Waterloo, Canada.

Golz’s work makes use of the Dodgson identity, a mathematical equivalence noted by Dodgson in an 1866 paper, to perform this exact sort of simplification. While much of the connecting mathematics was done by Francis Brown, one of Golz’s tutors at Oxford University, the intellectual lineage can be traced all the way back to Lewis Carroll. “It’s kind of a nice curiosity,” says Golz. “A nice conversation starter.”

In the past, parametric notation was only useful in calculating simplified forms of quantum theory. Thanks to work like Golz’s, these simplifications could be extended to particle behaviour of real interest to experimentalists. “I can say with confidence that these parametric techniques, applied to the right problems, are game-changing,” says Brown.

For more such insights, log into www.international-maths-challenge.com.

*Credit for article given to Gilead Amit*


Mathematicians Find 12,000 Solutions For Fiendish Three-Body Problem

Until recently, working out how three objects can stably orbit each other was nearly impossible, but now mathematicians have found a record number of solutions.

The motion of three objects is more complex than you might think

The question of how three objects can form a stable orbit around each other has troubled mathematicians for more than 300 years, but now researchers have found a record 12,000 orbital arrangements permitted by Isaac Newton’s laws of motion.

While mathematically describing the movement of two orbiting bodies and how each one’s gravity affects the other is relatively simple, the problem becomes vastly more complex once a third object is added. In 2017, researchers found 1223 new solutions to the three-body problem, doubling the number of possibilities then known. Now, Ivan Hristov at Sofia University in Bulgaria and his colleagues have unearthed more than 12,000 further orbits that work.

The team used a supercomputer to run an optimised version of the algorithm used in the 2017 work, discovering 12,392 new solutions. Hristov says that if he repeated the search with even more powerful hardware he could find “five times more”.

All the solutions found by the researchers start with all three bodies being stationary, before entering freefall as they are pulled towards each other by gravity. Their momentum then carries them past each other before they slow down, stop and are attracted together once more. The team found that, assuming there is no friction, this pattern would repeat infinitely.

Solutions to the three-body problem are of interest to astronomers, as they can describe how any three celestial objects – be they stars, planets or moons – can maintain a stable orbit. But it remains to be seen how stable the new solutions are when the tiny influences of additional, distant bodies and other real-world noise are taken into account.

“Their physical and astronomical relevance will be better known after the study of stability – it’s very important,” says Hristov. “But, nevertheless – stable or unstable – they are of great theoretical interest. They have a very beautiful spatial and temporal structure.”

Juhan Frank at Louisiana State University says that finding so many solutions in a precise set of conditions will be of interest to mathematicians, but of limited application in the real world.

“Most, if not all, require such precise initial conditions that they are probably never realised in nature,” says Frank. “After a complex and yet predictable orbital interaction, such three-body systems tend to break into a binary and an escaping third body, usually the least massive of the three.”

For more such insights, log into www.international-maths-challenge.com.

*Credit for article given to Matthew Sparkes *


Is the Universe a Game?

Generations of scientists have compared the universe to a giant, complex game, raising questions about who is doing the playing – and what it would mean to win.

If the universe is a game, then who’s playing it?

The following is an extract from our Lost in Space-Time newsletter. Each month, we hand over the keyboard to a physicist or mathematician to tell you about fascinating ideas from their corner of the universe. You can sign up for Lost in Space-Time for free here.

Is the universe a game? Famed physicist Richard Feynman certainly thought so: “‘The world’ is something like a great chess game being played by the gods, and we are observers of the game.” As we observe, it is our task as scientists to try to work out the rules of the game.

The 17th-century mathematician Gottfried Wilhelm Leibniz also looked on the universe as a game and even funded the foundation of an academy in Berlin dedicated to the study of games: “I strongly approve of the study of games of reason not for their own sake but because they help us to perfect the art of thinking.”

Our species loves playing games, not just as kids but into adulthood. It is believed to have been an important part of evolutionary development – so much so that the cultural theorist Johan Huizinga proposed we should be called Homo ludens, the playing species, rather than Homo sapiens. Some have suggested that once we realised that the universe is controlled by rules, we started developing games as a way to experiment with the consequences of these rules.

Take, for example, one of the very first board games that we created. The Royal Game of Ur dates back to around 2500 BC and was found in the Sumerian city of Ur, part of Mesopotamia. Tetrahedral-shaped dice are used to race five pieces belonging to each player down a shared sequence of 12 squares. One interpretation of the game is that the 12 squares represent the 12 constellations of the zodiac that form a fixed background to the night sky and the five pieces correspond to the five visible planets that the ancients observed moving through the night sky.

But does the universe itself qualify as a game? Defining what actually constitutes a game has been a subject of heated debate. Logician Ludwig Wittgenstein believed that words could not be pinned down by a dictionary definition and only gained their meaning through the way they were used, in a process he called the “language game”. An example of a word that he believed only got its meaning through use rather than definition was “game”. Every time you try to define the word “game”, you wind up including some things that aren’t games and excluding others you meant to include.

Other philosophers have been less defeatist and have tried to identify the qualities that define a game. Everyone, including Wittgenstein, agrees that one common facet of all games is that they are defined by rules. These rules control what you can or can’t do in the game. It is for this reason that as soon as we understood that the universe is controlled by rules that bound its evolution, the idea of the universe as a game took hold.

In his book Man, Play and Games, theorist Roger Caillois proposed five other key traits that define a game: uncertainty, unproductiveness, separateness, imagination and freedom. So how does the universe match up to these other characteristics?

The role of uncertainty is interesting. We enter a game because there is a chance either side will win – if we know in advance how the game will end, it loses all its power. That is why ensuring ongoing uncertainty for as long as possible is a key component in game design.

Polymath Pierre-Simon Laplace famously declared that Isaac Newton’s identification of the laws of motion had removed all uncertainty from the game of the universe: “We may regard the present state of the universe as the effect of its past and the cause of its future. An intellect which at a certain moment would know all forces that set nature in motion, and all positions of all items of which nature is composed, if this intellect were also vast enough to submit these data to analysis, it would embrace in a single formula the movements of the greatest bodies of the universe and those of the tiniest atom; for such an intellect nothing would be uncertain and the future just like the past could be present before its eyes.”

Solved games suffer the same fate. Connect 4 is a solved game in the sense that we now know an algorithm that will always guarantee the first player a win. With perfect play, there is no uncertainty. That is why games of pure strategy sometimes suffer – if one player is much better than their opponent then there is little uncertainty in the outcome. Donald Trump against Garry Kasparov in a game of chess will not be an interesting game.

The revelations of the 20th century, however, have reintroduced the idea of uncertainty back into the rules of the universe. Quantum physics asserts that the outcome of an experiment is not predetermined by its current state. The pieces in the game might head in multiple different directions according to the collapse of the wave function. Despite what Albert Einstein believed, it appears that God is playing a game with dice.

Even if the game were deterministic, the mathematics of chaos theory also implies that players and observers will not be able to know the present state of the game in complete detail and small differences in the current state can result in very different outcomes.

That a game should be unproductive is an interesting quality. If we play a game for money or to teach us something, Caillois believed that the game had become work: a game is “an occasion of pure waste: waste of time, energy, ingenuity, skill”. Unfortunately, unless you believe in some higher power, all evidence points to the ultimate purposelessness of the universe. The universe is not there for a reason. It just is.

The other three qualities that Caillois outlines perhaps apply less to the universe but describe a game as something distinct from the universe, though running parallel to it. A game is separate – it operates outside normal time and space. A game has its own demarcated space in which it is played within a set time limit. It has its own beginning and its own end. A game is a timeout from our universe. It is an escape to a parallel universe.

The fact that a game should have an end is also interesting. There is the concept of an infinite game that philosopher James P. Carse introduced in his book Finite and Infinite Games. You don’t aim to win an infinite game. Winning terminates the game and therefore makes it finite. Instead, the player of the infinite game is tasked with perpetuating the game – making sure it never finishes. Carse concludes his book with the rather cryptic statement, “There is but one infinite game.” One realises that he is referring to the fact that we are all players in the infinite game that is playing out around us, the infinite game that is the universe. Although current physics does posit a final move: the heat death of the universe means that this universe might have an endgame that we can do nothing to avoid.

Caillois’s quality of imagination refers to the idea that games are make-believe. A game consists of creating a second reality that runs in parallel with real life. It is a fictional universe that the players voluntarily summon up independent of the stern reality of the physical universe we are part of.

Finally, Caillois believes that a game demands freedom. Anyone who is forced to play a game is working rather than playing. A game, therefore, connects with another important aspect of human consciousness: our free will.

This raises a question: if the universe is a game, who is it that is playing and what will it mean to win? Are we just pawns in this game rather than players? Some have speculated that our universe is actually a huge simulation. Someone has programmed the rules, input some starting data and has let the simulation run. This is why John Conway’s Game of Life feels closest to the sort of game that the universe might be. In Conway’s game, pixels on an infinite grid are born, live and die according to their environment and the rules of the game. Conway’s success was in creating a set of rules that gave rise to such interesting complexity.

If the universe is a game, then it feels like we too lucked out to find ourselves part of a game that has the perfect balance of simplicity and complexity, chance and strategy, drama and jeopardy to make it interesting. Even when we discover the rules of the game, it promises to be a fascinating match right up to the moment it reaches its endgame.

For more such insights, log into www.international-maths-challenge.com.

*Credit for article given to Marcus Du Sautoy*


500-Year-Old Maths Problem Turns Out To Apply To Coffee And Clocks

A centuries-old maths problem asks what shape a circle traces out as it rolls along a line. The answer, dubbed a “cycloid”, turns out to have applications in a variety of scientific fields.

Light reflecting off the round rim creates a mathematically significant shape in this coffee cup

Sarah Hart

The artist Paul Klee famously described drawing as “taking a line for a walk” – but why stop there? Mathematicians have been wondering for five centuries what happens when you take circles and other curves for a walk. Let me tell you about this fascinating story…

A wheel rolling along a road will trace out a series of arches

Imagine a wheel rolling along a road – or, more mathematically, a circle rolling along a line. If you follow the path of a point on that circle, it traces out a series of arches. What exactly is their shape? The first person to give the question serious thought seems to have been Galileo Galilei, who gave the arch-like curve a name – the cycloid. He was fascinated by cycloids, and part of their intriguing mystery was that it seemed impossible to answer the most basic questions we ask about a curve – how long is it and what area does it contain? In this case, what’s the area between the straight line and the arch? Galileo even constructed a cycloid on a sheet of metal, so he could weigh it to get an estimate of the area, but he never managed to solve the problem mathematically.

Within a few years, it seemed like every mathematician in Europe was obsessed with the cycloid. Pierre de Fermat, René Descartes, Marin Mersenne, Isaac Newton and Gottfried Wilhelm Leibniz all studied it. It even brought Blaise Pascal back to mathematics, after he had sworn off it in favour of theology. One night, he had a terrible toothache and, to distract himself from the pain, decided to think about cycloids. It worked – the toothache miraculously disappeared, and naturally Pascal concluded that God must approve of him doing mathematics. He never gave it up again. The statue of Pascal in the Louvre Museum in Paris even shows him with a diagram of a cycloid. The curve became so well known, in fact, that it made its way into several classic works of literature – it gets name-checked in Gulliver’s TravelsTristram Shandy and Moby-Dick.

The question of the cycloid’s area was first solved in the mid-17th century by Gilles de Roberval, and the answer turned out to be delightfully simple – exactly three times the area of the rolling circle. The first person to determine the length of the cycloid was Christopher Wren, who was an extremely good mathematician, though I hear he also dabbled in architecture. It’s another beautifully simple formula: the length is exactly four times the diameter of the generating circle. The beguiling cycloid was so appealing to mathematicians that it was nicknamed “the Helen of Geometry”.

But its beauty wasn’t the only reason for the name. It was responsible for many bitter arguments. When mathematician Evangelista Torricelli independently found the area under the cycloid, Roberval accused him of stealing his work. “Team Roberval” even claimed that Torricelli had died of shame after being unmasked as a plagiarist (though the typhoid he had at the time may have been a contributing factor). Descartes dismissed Fermat’s work on the cycloid as “ridiculous gibberish”. And in response to a challenge from Johann Bernoulli, Isaac Newton grumpily complained about being “teased by foreigners about mathematics”.

An amazing property of the cycloid was discovered by Christiaan Huygens, who designed the first pendulum clock. Pendulums are good for timekeeping because the period of their motion – the time taken for one full swing of the pendulum – is constant, no matter what the angle of release. But in fact, that’s only approximately true – the period does vary slightly. Huygens wondered if he could do better. The end of a pendulum string moves along the arc of a circle, but is there a curved path it could follow so that the bob would reach the bottom of the curve in the same time no matter where it was released? This became known as the “tautochrone problem”. And guess which curve is the solution? An added bonus is its link to the “brachistochrone problem” of finding the curve between any two points along which a particle moving under gravity will descend in the shortest time. There’s no reason at all to think that the same curve could answer both problems, but it does. The solution is the cycloid. It’s a delightful surprise to find it cropping up in situations seemingly so unrelated to where we first encountered it.

When you roll a circle along a line, you get a cycloid. But what happens when you roll a line along a circle? This is an instance of a curve called an involute. To make one, you take a point at the end of a line segment and roll that line along the curve so it’s always just touching it (in other words, it’s a tangent). The involute is the curve traced out by that point. For the involute of a circle, imagine unspooling a thread from a cotton reel and following the end of the thread as it moves. The result is a spiralling curve emerging from the circle’s circumference.

When a line rolls along a circle, it produces a curve called an involute

Huygens was the first person to ask about involutes, as part of his attempts to make more accurate clocks. It’s all very well knowing the cycloid is the perfect tautochrone, but how do you get your string to follow a cycloidal path? You need to find a curve whose involute is a cycloid. The miraculous cycloid, it turns out, has the beautiful property that it is its own involute! But those lovely spiralling circle involutes turn out to be extremely useful too.

A circle with many involutes

My favourite application is one Huygens definitely couldn’t have predicted: in the design of a nuclear reactor that produces high-mass elements for scientific research. This is done by smashing neutrons at high speed into lighter elements, to create heavier ones. Within the cylindrical reactor cores, the uranium oxide fuel is sandwiched in thin layers between strips of aluminium, which are then curved to fit into the cylindrical shape. The heat produced by a quadrillion neutrons hurtling around every square centimetre is considerable, so coolant runs between these strips. It’s vital that they must be a constant distance apart all the way along their curved surfaces, to prevent hotspots. That’s where a useful property of circle involutes comes in. If you draw a set of circle involutes starting at equally spaced points on the circumference of a circle, then the distances between them remain constant along the whole of each curve. So, they are the perfect choice for the fuel strips in the reactor core. What’s more, the circle involute is the only curve for which this is true! I just love that a curve first studied in the context of pendulum clocks turns out to solve a key design question for nuclear reactors.

We’ve rolled circles along lines and lines along circles. Clearly the next step is to roll circles along circles. What happens? Here, we have some choices. What size is the rolling circle? And are we rolling along the inside or the outside of the stationary one? The curve made by a circle rolling along inside of the circle is called a hypocycloid; rolling it along the outside gives you an epicycloid. If you’ve ever played with a Spirograph toy, you’ll almost have drawn hypocycloids. Because your pen is not quite at the rim of the rolling circle, technically you are creating what are called hypotrochoids.

A cardioid (left) and nephroid (right)

Of the epicycloids, the most interesting is the cardioid: the heart-shaped curve resulting when the rolling circle has the same radius as the fixed one. Meanwhile, the kidney-shaped nephroid is produced by a rolling circle half the radius of the fixed one. Cardioids crop up in the most fascinating places. The central region of the Mandelbrot set, a famous fractal, is a cardioid. Sound engineers will be familiar with cardioid microphones, which pick up sound in a cardioid-shaped region. You might also find cardioid-like curves in the light patterns created in coffee cups in some kinds of lighting. If light rays from a fixed source are reflected off a curved mirror, the curve to which each of those reflected rays are tangent will be visible as a concentrated region of light, called a caustic. It turns out that a light source on the circumference of a perfectly circular mirror will result precisely in a cardioid!

Of course, in our coffee cup example, usually the light source isn’t exactly on the rim of the cup, but some way away. If it were very far away, we could assume that the light rays hitting the rim of the cup are parallel. In that situation, it can be shown that the caustic is actually not a cardioid but another epicycloid: the nephroid. Since a strong overhead light is somewhere between these two extremes, the curve we get is usually going to be somewhere between a cardioid and a nephroid. The mathematician Alfréd Rényi once defined a mathematician as “a device for turning coffee into theorems”. That process is nowhere more clearly seen than with our wonderful epicycloids. Check them out if you’re reading this with your morning cuppa!

For more such insights, log into www.international-maths-challenge.com.

*Credit for article given to Sarah Hart*