The magic of maths: festive puzzles to give your brain and imagination a workout

Panther Media Global/Alamy

Mathematics is a “science which requires a great amount of imagination”, said the 19th-century Russian maths professor Sofya Kovalevskaya – a pioneering figure for women’s equality in this subject.

We all have an imagination, so I believe everyone has the ability to enjoy mathematics. It’s not just arithmetic but a magical mixture of logic, reasoning, pattern spotting and creative thinking.

Of course, more and more research also shows the benefits of doing puzzles like these for brain health and development. Canadian psychologist Donald Hebb’s theory of learning has come to be known as “when neurons fire together, they wire together” (which, by the way, is one of the guiding principles behind training large neural networks in AI). New pathways start to form which can build and maintain strong cognitive function.

What’s more, doing maths is often a collaborative endeavour – and can be a great source of fun and fulfilment when people work together on problems. Which brings me to these festive-themed puzzles, which can be tackled by the whole family. No formal training in maths is required, and no complicated formulas are needed to solve them.

I hope they bring you some moments of mindful relaxation this holiday season. You can read the answers (and my explanations for them) here.

Festive maths puzzlers

nestdesigns/Shutterstock

Puzzle 1: You are given nine gold coins that look identical. You are told that one of them is fake, and that this coin weighs less than the real ones. You are also given a set of old-fashioned balance scales that weigh groups of objects and show which group is heavier.

Question: What is the smallest number of weighings you need to carry out to determine which is the fake coin?

Puzzle 2: You’ve been transported back in time to help cook Christmas dinner. Your job is to bake the Christmas pie, but there aren’t even any clocks in the kitchen, let alone mobile phones. All you’ve got is two egg-timers: one that times exactly four minutes, and one that times exactly seven minutes. The scary chef tells you to put the pie in the oven for exactly ten minutes and no longer.

Question: How can you time ten minutes exactly, and avoid getting told off by the chef?

Dasha Efremova/Shutterstock

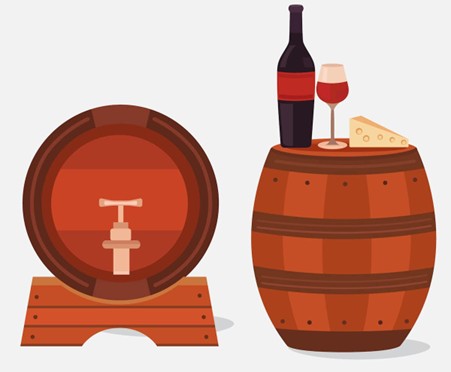
Puzzle 3: Having successfully cooked the Christmas pie, you are now entrusted with allocating the mulled wine – which is currently in two ten-litre barrels. The chef hands you one five-litre bottle and one four-litre bottle, both of which are empty. He orders you to fill the bottles with exactly three litres of wine each, without wasting a drop.

Question: How can you do this?

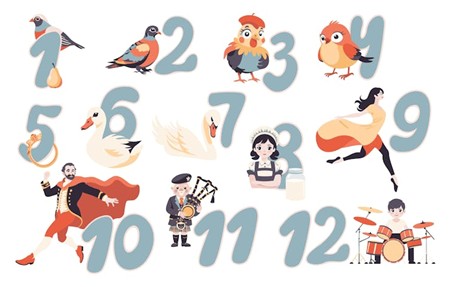
Puzzle 4: For the sake of this quiz, imagine there are not 12 but 100 days of Christmas. On the n-th day of Christmas, you receive £n as a gift, from £1 on the first day to £100 on the final day. In other words, far too many gifts for you to be able to count all the money!

Question: Can you calculate the total amount of money you have been given without laboriously adding all 100 numbers together?

(Note: a variation of this question was once posed to the German mathematician and astronomer Carl Friedrich Gauss in the 18th century.)

Puzzle 5: Here’s a Christmassy sequence of numbers. The first six in the sequence are: 9, 11, 10, 12, 9, 5 … (Note: the fifth number is 11 in some versions of this puzzle.)

Question: What is the next number in this sequence?

Garashchuk/Shutterstock

Puzzle 6: Take a look at the following list of statements:

Exactly one statement in this list of statements is false.

Exactly two statements in this list are false.

Exactly three statements in this list are false.

… and so on until:

Exactly 99 statements in this list are false.

Exactly 100 statements in this list are false.

Question: Which of these 100 statements is the only true one?

Puzzle 7: You are in a room with two other people, Arthur and Bob, who both have impeccable logic. Each of you is wearing a Christmas hat which is either red or green. Nobody can see their own hat but you can all see the other two.

You can also see that both Arthur’s and Bob’s hats are red. Now you are all told that at least one of the hats is red. Arthur says: “I do not know what colour my hat is.” Then Bob says: “I do not know what colour my hat is.”

Question: Can you deduce what colour your Christmas hat is?

Puzzle 8: There are three boxes under your Christmas tree. One contains two small presents, one contains two pieces of coal, and one contains a small present and a piece of coal. Each box has a label on it that shows what’s inside – but the labels have got mixed up, so every box currently has the wrong label on it. You are now told that you can open one box.

Question: Which box should you open, in order to then be able to switch the labels so that every label correctly shows the contents of its box?

Puzzle 9: Just before Christmas dinner, naughty Jack comes into the kitchen where there is one-litre bottle of orange juice and a one-litre bottle of apple juice. He decides to put a tablespoon of orange juice into the bottle of apple juice, then stirs it around so it’s evenly mixed.

But naughty Jill has seen what he did. Now she comes in, and takes a tablespoon of liquid from the bottle of apple juice and puts it into the bottle of orange juice.

Question: Is there now more orange juice in the bottle of apple juice, or more apple juice in the bottle of orange juice?

joto/Shutterstock

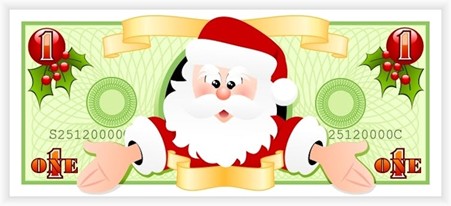
Puzzle 10: In Santa’s home town, all banknotes carry pictures of either Santa or Mrs Claus on one side, and pictures of either a present or a reindeer on the other. A young elf places four notes on a table showing the following pictures:

Santa   |   Mrs Claus   |   Present | Reindeer

Now an older, wiser elf tells him: “If Santa is on one side of the note, a present must be on the other.”

Question: Which notes must the young elf must turn over to confirm what the older elf says is true?

Bonus puzzle

If you need a festive tiebreaker, here’s a question that requires a little bit of algebra (and the formula “speed = distance/time”). It’s tempting to say this question can’t be solved because the distance is not known – but the magic of algebra should give you the answer.

Santa travels on his sleigh from Greenland to the North Pole at a speed of 30 miles per hour, and immediately returns from the North Pole to Greenland at a speed of 40 miles per hour

Tiebreaker: What is the average speed of Santa’s entire journey?

(Note: a non-Christmassy version of this question was posed by the American physicist Julius Sumner-Miller.)

For more such insights, log into www.international-maths-challenge.com.

*Credit for article given to Neil Saunders*


Maths is most popular A-level again – more students should get the opportunity to take their study further

Gorodenkoff/Shutterstock

In 2025, more young people than ever have opened their A-level results to find out how they did in their maths exam. Once again, maths has been the most popular A-level subject, with 112,138 entries in 2025.

This is up by more than 4% compared with 2024. Entries in further maths, an A-level that expands on the maths curriculum, have also risen – an increase of 7% since 2024, with over 19,000 entries this year.

As a professional mathematician this is pleasing news. Some of these students will be happily receiving confirmation of their place to study maths at university.

The joy I experienced when I discovered in my maths degree that many of the subjects I studied at school – chemistry, biology, physics and even music – are woven together by a mathematical fabric, is something I’ve never forgotten.

I’m excited by the idea that many young people are about to experience this for themselves. But I am concerned that fewer students will have the same opportunities in the future, as more maths departments are forced to downsize or close, and as we become more reliant on artificial intelligence.

There are a number of differences between studying maths at university compared with school. While this can be daunting at first, all of these differences underscore just how richly layered, deeply interconnected and vastly applicable maths is.

At university, not only do you learn beautiful formulas and powerful algorithms, but also grapple with why these formulas are true and dissect exactly what these algorithms are doing. This is the idea of the “proof”, which is not explored much at school and is something that can initially take students by surprise.

But proving why formulas are true and why algorithms work is an important and necessary step in being able discover new and exciting applications of the maths you’re studying.

Maths degrees involve finding out why mathematics works the way it does. Gorodenkoff/Shutterstock

A maths degree can lead to careers in finance, data science, AI, cybersecurity, quantum computing, ecology and climate modelling. But more importantly, maths is a beautifully creative subject, one that allows people to be immensely expressive in their scientific and artistic ideas.

A recent and stunning example of this is Hannah Cairo, who at just 17 disproved a 40-year old conjecture.

If there is a message I wish I knew when I started studying university mathematics it is this: maths is not just something to learn, but something to create. I’m continually amazed at how my students find new ways to solve problems that I first encountered over 20 years ago.

Accessiblity of maths degrees

But the question of going on to study maths at university is no longer just a matter of A-level grades. The recent and growing phenomenon of maths deserts – areas of the country where maths degrees are not offered – is making maths degrees less accessible, particularly for students outside of big cities.

Forthcoming research from The Campaign for Mathematical Sciences (CAMS), of which I am a supporter, shows that research-intensive, higher tariff universities – the ones that require higher grades to get in – took 66% of UK maths undergraduates in 2024, up from 56% in 2006.

This puts smaller departments in lower-tariff universities in danger of closure as enrolments drop. The CAMS research forecasts that an additional nine maths departments will have fewer than 50 enrolments in their degrees by 2035.

This cycle will further concentrate maths degrees in high tariff institutions, reinforcing stereotypes such as that only exceptionally gifted people should go on to study maths at university. This could also have severe consequences for teacher recruitment. The CAMS research also found that 25% of maths graduates from lower-tariff universities go into jobs in education, compared to 8% from higher tariff universities.

Maths in the age of AI

The growing capability and sophistication of AI is also putting pressure on maths departments

With Open AI’s claim that their recently released GPT-5 is like having “a team of PhD-level experts in your pocket”, the temptation to overly rely on AI poses further risks to the existence and quality of future maths degrees.

But the process of turning knowledge into wisdom and theory into application comes from the act of doing: doing calculations and forming logical and rigorous arguments. That is the key constituent of thinking clearly and creatively. It ensures students have ownership of their skills, capacities, and the work that they produce.

A data scientist will still require an in-depth working knowledge of the mathematical, algorithmic and statistical theory underpinning data science if they are going to be effective. The same for financial analysts, engineers and computer scientists.

The distinguished mathematician and computer scientist Leslie Lamport said that “coding is to programming what typing is to writing”. Just as you need to have some idea of what you are writing before you type it, you need to have some idea of the (mathematical) algorithm you are creating before you code it.

It is worth remembering that the early pioneers in AI – John McCarthy, Marvin Minsky, Claude Shannon, Alan Turing – all had degrees in mathematics. So we have every reason to expect that future breakthroughs in AI will come from people with mathematics degrees working creatively in interdisciplinary teams.

This is another great feature of maths: its versatility. It’s a subject that doesn’t just train you for a job but enables you to enjoy a rich and fulfilling career – one that can comprise many different jobs, in many different fields, over the course of a lifetime.

For more such insights, log into www.international-maths-challenge.com.

*Credit for article given to Neil Saunders*


Learning statistics through story: students get creative with numbers

Photo by Markus Krisetya via Unsplash

Statistics professor Johan Ferreira was feeling overwhelmed by the amount of “screen time” involved in online learning in 2021. He imagined students must be feeling the same way, and wondered what he could do to inspire them and make his subject matter more appealing.

One of the topics in statistics is time series analysis: statistical methods to understand trend behaviour in data which is measured over time. There are lots of examples in daily life, from rainfall records to changes in commodity prices, import or exports, or temperature.

Ferreira asked his students to write a short, fictional “bedtime” story using “characters” from time series analysis. The results were collected into a book that is freely available. He tells us more about it.

Why use storytelling to learn about statistics?

I’m fortunate to be something of a creative myself, being a professional oboe player with the Johannesburg Philharmonic Orchestra. It’s a valuable outlet for self-expression. I reflected on what other activity could inspire creativity without compromising the essence of statistical thinking that was required in this particular course I was teaching.

Example of a time series, the kind of data analysed using statistical methods. Author provided (no reuse)

I invited my third-year science and commerce students at the University of Pretoria to take part in a voluntary storytelling exercise, using key concepts in time series analysis as characters. Students got some guidelines but were free to be creative. My colleague and co-editor, Dr Seite Makgai, and I then read, commented on and edited the stories and put them together into an anthology.

Students gave their consent that their stories could be used for research purposes and might be published. Out of a class of over 200 students, over 30 contributions were received; 23 students permitted their work to be included in this volume.

We curated submissions into two sections (Part I: Fables and Fairy Tales and Part II: Fantasy and Sci-Fi) based on the general style and gist of the work.

The project aimed to develop a new teaching resource, inspire students to take ownership of their learning in a creative way, and support them through informal, project-based peer learning.

This collection is written by students, for students. They used personal and cultural contexts relevant to their background and environment to create content that has a solid background in their direct academic interests. And the stories are available without a paywall!

What are some of the characters and stories?

Student Lebogang Malebati wrote Stationaryville and the Two Brothers, a tale about AR(1) and AR(2). In statistics, AR refers to processes in which numerical values are based on past values. The brothers “were both born with special powers, powers that could make them stationary…” and could trick an evil wizard.

David Dodkins wrote Zt and the Shadow-spawn. In this story, Zt (common notation in time series analysis) has a magic amulet that reveals his character growth through a sequence of models and shows the hero’s victory in the face of adversity. He is a function of those that came before him (through an AR process).

Then there’s Nelis Daniels’ story about a shepherd plagued by a wolf called Arma (autoregressive moving average) which kept making sheep disappear.

And Dikelede Rose Motseleng’s modern fable about the love-hate relationship between AR(1) (“more of a linear guy” with a bad habit of predicting the future based on the past) and MA(1), “the type of girl who would always provide you with stationarity (stability).”

What was the impact of the project?

It was a deeply enriching experience for us to see how students see statistics in a context beyond that of the classroom, especially in cases where students reformulated their stories within their own cultural identities or niche interests.

Three particular main impacts stand out for us:

  • students have a new additional reference and learning resource for the course content
  • new students can refer to the experiences and contextualisation of this content of former students, leading to informal peer learning
  • students engage in a cognitive skill (higher-order and creative thinking) that is not frequently considered and included in this field and at this level.

In 2024, shortly after the book was published, we asked students in the time series analysis course of that year to read any one of four stories (related to concepts that were already covered in the course material at that point in time). We asked them to complete a short and informal survey to gauge their experience and insights regarding the potential of this book as a learning resource for them.

The 53 responses we got indicated that most students saw the book as a useful contribution to their learning experience in time series analysis.

Student perceptions of value of stories. Author supplied, Author provided (no reuse)

One positive comment from a student was:

I will always remember that the Random Walk is indeed not stationary but White Noise is. I already knew it, but now I won’t forget it.

Will you build on this in future?

It is definitely valuable to consider similar projects in other branches of statistics, but also, in other disciplines entirely, to develop content by students, for students.

At this stage, we’re having the stories and book translated into languages beyond English. In large classes that are essential to data science (such as statistics and mathematics), many different home languages may be spoken. Students often have to learn in their second, third, or even fourth language. So, this project is proving valuable in making advanced statistical concepts tactile and “at home” via translations.

Our publisher recently let us know that the Setswana translation is complete, with the Sepedi and Afrikaans translations following soon. To our knowledge, it’ll be the first such project not only in the discipline of statistics, but in four of the official languages in South Africa.

For more such insights, log into www.international-maths-challenge.com.

*Credit for article given to Johan Ferreira*


Could electric brain stimulation lead to better maths skills?

A painless, non-invasive brain stimulation technique can significantly improve how young adults learn maths, my colleagues and I found in a recent study. In a paper in PLOS Biology, we describe how this might be most helpful for those who are likely to struggle with mathematical learning because of how their brain areas involved in this skill communicate with each other.

Maths is essential for many jobs, especially in science, technology, engineering and finance. However, a 2016 OECD report suggested that a large proportion of adults in developed countries (24% to 29%) have maths skills no better than a typical seven-year-old. This lack of numeracy can contribute to lower income, poor health, reduced political participation and even diminished trust in others.

Education often widens rather than closes the gap between high and low achievers, a phenomenon known as the Matthew effect. Those who start with an advantage, such as being able to read more words when starting school, tend to pull further ahead. Stronger educational achievement has been also associated with socioeconomic status, higher motivation and greater engagement with material learned during a class.

Biological factors, such as genes, brain connectivity, and chemical signalling, have been shown in some studies to play a stronger role in learning outcomes than environmental ones. This has been well-documented in different areas, including maths, where differences in biology may explain educational achievements.

To explore this question, we recruited 72 young adults (18–30 years old) and taught them new maths calculation techniques over five days. Some received a placebo treatment. Others received transcranial random noise stimulation (tRNS), which delivers gentle electrical currents to the brain. It is painless and often imperceptible, unless you focus hard to try and sense it.

It is possible tRNS may cause long term side effects, but in previous studies my team assessed participants for cognitive side effects and found no evidence for it.

Participants who received tRNS were randomly assigned to receive it in one of two different brain areas. Some received it over the dorsolateral prefrontal cortex, a region critical for memory, attention, or when we acquire a new cognitive skill. Others had tRNS over the posterior parietal cortex, which processes maths information, mainly when the learning has been accomplished.

Before and after the training, we also scanned their brains and measured levels of key neurochemicals such as gamma-aminobutyric acid (gaba), which we showed previously, in a 2021 study, to play a role in brain plasticity and learning, including maths.

Some participants started with weaker connections between the prefrontal and parietal brain regions, a biological profile that is associated with poorer learning. The study results showed these participants made significant gains in learning when they received tRNS over the prefrontal cortex.

Stimulation helped them catch up with peers who had stronger natural connectivity. This finding shows the critical role of the prefrontal cortex in learning and could help reduce educational inequalities that are grounded in neurobiology.

How does this work? One explanation lies in a principle called stochastic resonance. This is when a weak signal becomes clearer when a small amount of random noise is added.

In the brain, tRNS may enhance learning by gently boosting the activity of underperforming neurons, helping them get closer to the point at which they become active and send signals. This is a point known as the “firing threshold”, especially in people whose brain activity is suboptimal for a task like maths learning.

It is important to note what this technique does not do. It does not make the best learners even better. That is what makes this approach promising for bridging gaps, not widening them. This form of brain stimulation helps level the playing field.

Our study focused on healthy, high-performing university students. But in similar studies on children with maths learning disabilities (2017) and with attention-deficit/hyperactivity disorder (2023) my colleagues and I found tRNS seemed to improve their learning and performance in cognitive training.

I argue our findings could open a new direction in education. The biology of the learner matters, and with advances in knowledge and technology, we can develop tools that act on the brain directly, not just work around it. This could give more people the chance to get the best benefit from education.

In time, perhaps personalised, brain-based interventions like tRNS could support learners who are being left behind not because of poor teaching or personal circumstances, but because of natural differences in how their brains work.

Of course, very often education systems aren’t operating to their full potential because of inadequate resources, social disadvantage or systemic barriers. And so any brain-based tools must go hand-in-hand with efforts to tackle these obstacles.

For more such insights, log into www.international-maths-challenge.com.

*Credit for article given to Roi Cohen Kadosh*


How good are South African kids at maths? Trends from a global study

School mathematics in South Africa is often seen as a sign of the health of the education system more generally. Under the racial laws of apartheid, until 1994, African people were severely restricted from learning maths. Tracking the changes in maths performance is a measure of how far the country has travelled in overcoming past injustices. Maths is also an essential foundation for meeting the challenges of the future, like artificial intelligence, climate change, energy and sustainable development.

Here, education researcher Vijay Reddy takes stock of South Africa’s mathematical capabilities. She reports on South African maths performance at grades 5 (primary school) and 9 (secondary school) in the Trends in International Mathematics and Science Study (TIMSS) and examines the gender gaps in mathematics achievement

What was unusual about the latest TIMSS study?

The study is conducted every four years. South Africa has participated in it at the secondary phase since 1995 and at the primary phase since 2015. The period between the 2019 and 2023 cycles was characterised by the onset of the COVID-19 pandemic, social distancing and school closures.

The Department of Basic Education estimated that an average of 152 school contact days were lost in 2020 and 2021. South Africa was among the countries with the highest school closures, along with Colombia, Costa Rica and Brazil. At the other end, European countries lost fewer than 50 days.

Some academics measured the extent of learning losses for 2020 and 2021 school closures, but there were no models to estimate subsequent learning losses. We can get some clues of the effects on learning over four years, by comparing patterns within South Africa against the other countries.

How did South African learners (and others) perform in the maths study?

The South African grade 9 mathematics achievement improved by 8 points from 389 in TIMSS 2019 to 397 in 2023. From the trends to TIMSS 2019, we had predicted a mathematics score of 403 in 2023.

For the 33 countries that participated in both the 2019 and 2023 secondary school TIMSS cycles, the average achievement decreased by 9 points from 491 in 2019 to 482 to 2023. Only three countries showed significant increases (United Arab Emirates, Romania and Sweden). There were no significant changes in 16 countries (including South Africa). There were significant decreases in 14 countries.

Based on these numbers, it would seem, on the face of it at least, that South Africa weathered the COVID-19 losses better than half the other countries.

However, the primary school result patterns were different. For South African children, there was a significant drop in mathematics achievement by 12 points, from 374 in 2019 to 362 in 2023. As expected, the highest decreases were in the poorer, no-fee schools.

Of the 51 countries that participated in both TIMSS 2019 and 2023, the average mathematics achievement score over the two cycles was similar. There were no significant achievement changes in 22 countries, a significant increase in 15 countries, and a significant decrease in 14 countries (including South Africa).

So, it seems that South African primary school learners suffered adverse learning effects over the two cycles.

The increase in achievement in secondary school and decrease in primary school was unexpected. These reasons for the results may be that secondary school learners experienced more school support compared with primary schools, or were more mature and resilient, enabling them to recover from the learning losses experienced during COVID-19. Learners in primary schools, especially poorer schools, may have been more affected by the loss of school contact time and had less support to fully recover during this time.

This pattern may also be due to poor reading and language skills as well as lack of familiarity with this type of test.

Does gender make a difference?

There is an extant literature indicating that globally boys are more likely to outperform girls in maths performance.

But in South African primary schools, girls outscore boys in both mathematics and reading. Girls significantly outscored boys by an average of 29 points for mathematics (TIMSS) and by 49 points for reading in the 2021 Progress in International Reading Study, PIRLS.

These patterns need further exploration. Of the 58 countries participating in TIMSS at primary schools, boys significantly outscored girls in 40 countries, and there were no achievement differences in 17 countries. South Africa was the only country where the girls significantly outscored boys. In Kenya, Zimbabwe, Zambia and Mozambique, the Southern and Eastern Africa Consortium for Monitoring Educational Quality (SEACMEQ) reading scores are similar for girls and boys, while the boys outscore girls in mathematics. In Botswana, girls outscore boys in reading and mathematics, but the gender difference is much smaller.

In secondary schools, girls continue to outscore boys, but the gap drops to 8 points. Of the 42 TIMSS countries, boys significantly outscored girls in maths in 21 countries; there were no significant difference in 17 countries; and girls significantly outscored boys in only four countries (South Africa, Palestine, Oman, Bahrain).

In summary, the South African primary school achievement trend relative to secondary school is unexpected and requires further investigation. It seems that as South African learners get older, they acquire better skills in how to learn, read and take tests to achieve better results. Results from lower grades should be used cautiously to predict subsequent educational outcomes.

Unusually, in primary schools, there is a big gender difference for mathematics achievement favouring girls. The gender difference persists to grade 9, but the extent of the difference decreases. As learners, especially boys, progress through their education system they seem to make up their learning shortcomings and catch up.

The national mathematics picture would look much better if boys and girls performed at the same level from primary school, suggesting the importance of interventions in primary schools, especially focusing on boys.

For more such insights, log into www.international-maths-challenge.com.

*Credit for article given to Vijay Reddy*


Taking a leap of faith into imaginary numbers opens new doors in the real world through complex analysis

Imaginary numbers push the boundaries of calculus and other branches of math. Hill Street Studios/DigitalVision via Getty Images

To a nonmathematician, having the letter “i” represent a number that does not quite exist and is “imaginary” can be hard to wrap your head around. If you open your mind to this way of thinking, however, a whole new world becomes possible.

I’m a mathematician who studies analysis: an area of math that deals with complex numbers. Unlike the more familiar real numbers – positive and negative integers, fractions, square roots, cube roots and even numbers such as pi – complex numbers have an imaginary component. This means they are made of both real numbers and the imaginary number i: the square root of negative 1.

Remember, a square root of a number represents a number whose square is the original number. A positive number times itself is a positive number. A negative number times itself is a positive number. The imaginary number i depicts a number that somehow when multiplied by itself is negative.

Conversations about imaginary numbers with a nonmathematician often lead to objections like, “But those numbers don’t really exist, do they?” If you are one of these skeptics, you’re not alone. Even mathematical giants found complex numbers difficult to swallow. For one, calling -√1 “imaginary” isn’t doing it any favors in helping people understand that it’s not fantastical. Mathematician Girolamo Cardano, in his 1545 book dealing with complex numbers, “Ars Magna,” dismissed them as “subtle as they are useless.” Even Leonhard Euler, one of the greatest mathematicians, supposedly computed √(-2) √(-3) as √6. The correct answer is -√6.

In high school, you may have encountered the quadratic formula, which gives solutions to equations where the unknown variable is squared. Maybe your high school teacher didn’t want to deal with the issue of what happens when (b2 – 4ac) – the expression under the square root in the quadratic formula – is negative. They might have brushed this under the rug as something to deal with in college.

The quadratic formula can be applied in more cases when the expression under the radical is allowed to be negative. Jamie Twells/Wikimedia Commons

However, if you are willing to believe in the existence of square roots of negative numbers, you will get solutions to a whole new set of quadratic equations. In fact, a whole amazing and useful world of mathematics comes into view: the world of complex analysis.

Complex numbers simplify other areas of math

What do you get for your leap of faith in complex numbers?

For one, trigonometry becomes a lot easier. Instead of memorizing several complicated trig formulas, you need only one equation to rule them all: Euler’s 1740 formula. With decent algebra skills, you can manipulate Euler’s formula to see that most of the standard trigonometric formulas used to measure a triangle’s length or angle become a snap.

Euler’s formula relies on imaginary numbers. Raina Okonogi-Neth

Calculus becomes easier, too. As mathematicians Roger Cotes, René Descartes – who coined the term “imaginary number” – and others have observed, complex numbers make seemingly impossible integrals easy to solve and measure the area under complex curves.

Complex numbers also play a role in understanding all the possible geometric figures you can construct with a ruler and compass. As noted by mathematicians Jean-Robert Argand and Carl Friedrich Gauss, you can use complex numbers to manipulate geometric figures such as pentagons and octagons.

Complex analysis in the real world

Complex analysis has many applications to the real world.

Mathematician Rafael Bombelli’s idea of performing algebraic operations such as addition, subtraction, multiplication and division on complex numbers makes it possible to use them in calculus.

Fourier series allow periodic functions (blue) to be approximated by sums of sine and cosine functions (red). This process relies on complex analysis. Jim Belk/Wikimedia Commons

From here, much of what scientists use in physics to study signals – or data transmission – becomes more manageable and understandable. For example, complex analysis is used to manipulate wavelets, or small oscillations in data. These are critical to removing the noise in a garbled signal from a satellite, as well as compressing images for more efficient data storage.

Complex analysis allows engineers to transform a complicated problem into an easier one. Thus, it is also an important tool in many applied physics topics, such as studying the electrical and fluid properties of complicated structures.

Once they became more comfortable with complex numbers, famous mathematicians like Karl Weierstrass, Augustin-Louis Cauchy and Bernhard Riemann and others were able to develop complex analysis, building a useful tool that not only simplifies mathematics and advances science, but also makes them more understandable.

For more such insights, log into www.international-maths-challenge.com.

*Credit for article given to William Ross*


English children lag behind in geometry – parents can help them learn through play

Shutterstock

Geometry is an important branch of mathematics, which we use to understand the properties of 2D and 3D space such as distance, shape, size and position. We use geometry every day: cutting paper to wrap a present, calculating the area of a room to tile a floor, and interpreting pie charts and bar graphs at work. Even noticing when a picture on the wall is askew draws on our geometrical understanding.

But although children in England excel in mathematics compared to many countries, their scores in geometry are significantly below their overall mathematics scores. This pattern has held consistently for children in both year five (ages nine and ten) and year nine (ages 13-14) since 2015.

The solution might lie in improving children’s spatial skills: something that could be done through activities as simple and fun as playing with jigsaws, toy cars or construction sets.

Spatial thinking is the ability to understand the spatial properties of objects, such as their size and location, and to visualise objects and problems. Try, for instance, to picture a cube in your mind. How many sides does it have? You’ve just used spatial visualisation skills to work it out.

Research consistently shows that children who are good at spatial thinking are good at maths, and that spatial training is effective for maths improvement.

Despite this, spatial thinking isn’t an area of focus in schools. Instead, the current mathematics curriculum has a strong focus on number.

For example, the current geometry curriculum doesn’t include visualisation. Visualisation is the ability to imagine and manipulate spatial information in the mind’s eye. It is an aspect of spatial thinking which is foundational to mathematics. The inclusion of more spatial thinking would have benefits across the teaching of maths. As well as being central to geometry, it helps with reading graphs, rearranging formulae and problem solving.

In the meantime, though, parents can help their children develop spatial skills at home. Here are some tips for pre-school and primary age children.

Spatial play

When doing a jigsaw, ask your child if they can turn the piece in their imagination, rather than trying different options with the real piece, to work out where it goes. This draws on visualisation.

Your child may well have received a craft kit, marble run or construction set for Christmas. Any toy like this with pictorial instructions – diagrams you have to follow to construct something – requires spatial skills.

Encourage your child to look at the instructions and then back at their creation. This engages visual memory: the ability to maintain an image in memory for a small amount of time. This is important for holding numbers in mind during mathematical problem solving.

If your child likes playing with dollhouses, toy cars or toy farms, ask them about differences in scale – whether, for instance, a doll’s hat would fit on their own head. You could ask them to draw a road for their toy cars, thinking about how big it will have to be to fit them.

Small-word play can help develop spatial skills. Kolpakova Daria/Shutterstock

This encourages the development of spatial scaling, a spatial skill that children can later employ when reasoning about proportions or working with fractions.

For pre-school children, simple activities like sorting teddies by size and labelling them “small,” “medium,” or “large,” can build an early foundation for spatial reasoning.

While playing with your children, try to use spatial language – words such as “left”, “right”, “between”, “in”, “above” – to discuss what you are doing. When parents use more spatial language, their children also use more spatial language – and children with stronger spatial language demonstrate stronger mathematics performance. So, using these words will be beneficial for your children’s mathematics development.

Some spatial words are more challenging than others. “Between” is hard for a four-year-old, and “increase” and “parallel” are better used with older children. To help your child understand these concepts, you can use your hands to demonstrate. Hand gestures provide a concrete representation of a spatial concept and help children visualise what a spatial word means.

Encouraging quality spatial play is an easy and enjoyable way for parents to enlighten children to the spatial aspects of the world. Not only will this strengthen their spatial and mathematical skills, but it will also give them a solid foundation for future success, at school and beyond.

For more such insights, log into www.international-maths-challenge.com.

*Credit for article given to Emily Farran*


‘I was scared’: many student teachers had bad maths experiences at school. Here’s how they can do better

Toey Adante/ Shutterstock

What do you remember about maths at school? Did you whizz through the problems and enjoy getting the answers right? Or did you often feel lost and worried you weren’t keeping up? Perhaps you felt maths wasn’t for you and you stopped doing it altogether.

Maths can generate strong emotions in students. When these emotions are negative, it leads to poor mathematical wellbeing. This means students do not feel good when doing maths and do not function well. They may experience feelings of hopelessness and despair, and view themselves as incapable of learning maths.

Poor mathematical wellbeing, if not addressed, can develop into maths anxiety). This can impact working memory (which we use for calculating and problem-solving) and produce physical symptoms such as increased heart and breathing rates. It can also lead to students avoiding maths subjects, courses and careers.

Research shows students often start primary school enjoying and feeling optimistic about maths. However, these emotions can decline rapidly as students progress through school and can continue into adulthood.

Our new, as-yet-unpublished, research shows how this can be an issue for those studying to become teachers.

Our research

We frequently see students enter our university courses lacking confidence in their maths knowledge and ability to teach the subject. Some students describe it as “maths trauma”.

To better understand this issue, we surveyed 300 students who are studying to be primary teachers. All were enrolled in their first maths education unit.

We asked them to recount a negative and positive experience with maths at school. Many described feelings of shame and hopelessness. These feelings were often attributed to unsupportive teachers and teaching practices when learning maths at school.

As teacher educators, we often see students who do not have confidence to teach maths. Ground Picture/ Shutterstock

‘I felt so much anxiety’

The responses describing unpleasant experiences were highly emotional. The most common emotion experienced was shame (35%), followed by anxiety (27%), anger (18%), hopelessness (12%) and boredom (8%). Students also described feeling stupid, afraid, left behind, panicked, rushed and unsupported.

Being put on the spot in front of their peers and being afraid of providing wrong answers was a significant cause of anxiety:

The teacher had the whole class sitting in a circle and was asking students at random different times tables questions like ‘what is 4 x 8?’ I remember I felt so much anxiety sitting in that circle as I was not confident, especially with my six and eight times tables.

Students recalled how competition between students being publicly “right” or “wrong” featured in their maths lessons. Another student recalled how their teacher held back the whole class until a classmate could perfectly recite a certain times table.

Students also told us about feeling left behind and not being able to catch up.

In around Year 9, I remember doing algebra, and feeling like I didn’t ‘get’ it. I remember the feeling of falling behind. Not nice! The feeling of gentle panic, like you’re trying to hang on and the rope is pulled through your hands.

Students also described the stress of results being made public in front of their classmates. Another respondent told us how the teacher called out NAPLAN maths results from lowest to highest in front of the whole class.

Students often feel more negatively about maths as they progress through school. Juice Verve/Shutterstock

‘I was scared of maths teachers’

In other studies, primary and high school students have said a supportive teacher is one of the most important influences on their mathematical wellbeing.

In our research, many of the students’ descriptions directly mentioned “the teacher”. This further shows how important the teacher/student relationship is and its impact on students’ feelings about maths. As one student told us, they were:

[…] belittled by the teacher and the class [was] asked to tell me the answer to the question that I didn’t know. I felt lost and embarrassed and upset.

Another student told us how they were asked to stay behind after class after others had left because they didn’t understand “wordy maths problems”.

[there were] sighs and huffs from the teacher as it was taking so long to learn. I was scared of maths and maths teachers.

But teachers were also mentioned extensively when students reflected on pleasant experiences. Approximately one third of student responses mentioned teachers who were understanding, kind and supportive:

In Year 8 my teacher for maths made it fun and engaging and made sure to help every student […] The teacher made me feel smart and that if I put my mind to it I could do it.

What can we do differently?

Our research suggests there are four things teachers can do differently when teaching maths to support students’ learning and feelings about maths.

  1. Work with negative emotions: we can support students to tune into negative emotions and use them to their advantage. For example, we can show students how to embrace being confused – this is an opportunity to learn and with the right level of support, overcome the issue. In turn, this teaches students resilience.
  2. Normalise negative emotions: we can invite students to share their emotions with others in the class. Chances are, they will not be the only one feeling worried. This can help students feel supported and show them they are not alone.
  3. Treat mathematical wellbeing as seriously as maths learning: teachers can be patient and supportive and make sure maths lessons are engaging and relevant to students’ lives. When teachers focus on enjoying learning and supporting students’ psychological safety, this encourages risk-taking and makes it harder to develop negative emotions.
  4. Ditch the ‘scary’ methods: avoid teaching approaches that students find unpleasant – such as pitting students against each other or calling on students for an answer in front of their peers. In doing so, teachers can avoid creating more “maths scars” in the next generation of students.

For more such insights, log into www.international-maths-challenge.com.

*Credit for article given to Tracey Muir, Julia Hill,  & Sharyn Livy*


The Fascinating World of Sudoku: A Beginner’s Guide with Examples

Sudoku, the classic number puzzle, has captured the minds of puzzle enthusiasts around the globe. Originating from Japan, the name Sudoku translates to “single number,” reflecting the puzzle’s core principle: each number should appear only once in each row, column, and grid. This article will introduce you to the basics of Sudoku, walk you through some examples, and offer tips to enhance your solving skills.

What is Sudoku?

Sudoku is a logic-based puzzle game typically played on a 9×9 grid divided into nine 3×3 subgrids. The objective is to fill the grid with numbers from 1 to 9, ensuring that each row, each column, and each 3×3 subgrid contains all the numbers from 1 to 9 without repetition.

Basic Rules of Sudoku:

  1. Each row must contain the numbers 1 to 9, without repetition.
  2. Each column must contain the numbers 1 to 9, without repetition.
  3. Each 3×3 subgrid must contain the numbers 1 to 9, without repetition.

How to Solve a Sudoku Puzzle

Step-by-Step Example

Let’s walk through a simple Sudoku puzzle to understand the solving process.

Initial Puzzle:

5 3 _ | _ 7 _ | _ _ _

6 _ _ | 1 9 5 | _ _ _

_ 9 8 | _ _ _ | _ 6 _

——+——-+——

8 _ _ | _ 6 _ | _ _ 3

4 _ _ | 8 _ 3 | _ _ 1

7 _ _ | _ 2 _ | _ _ 6

——+——-+——

_ 6 _ | _ _ _ | 2 8 _

_ _ _ | 4 1 9 | _ _ 5

_ _ _ | _ 8 _ | _ 7 9

Step 1: Start with the Easy Ones

Begin by looking for rows, columns, or subgrids where only one number is missing. For instance, in the first row, the missing numbers are 1, 2, 4, 6, 8, and 9. However, given the other numbers in the row and subgrid, you can often narrow down the possibilities.

Step 2: Use the Process of Elimination

In the first 3×3 subgrid (top left), we are missing the numbers 1, 2, 4, 6, 7. By checking the rows and columns intersecting the empty cells, we can often deduce which numbers go where.

Example Fill-In:

  • For the empty cell in the first row, third column, the possible numbers are 1, 2, 4, 6, 8, 9. However, since 6 and 9 are in the same column and 8 is in the same row, the number for this cell must be 2.

Step 3: Repeat the Process

Continue using the process of elimination and logical deduction for the remaining cells. Let’s fill in a few more:

  • For the second row, second column, the missing numbers are 2, 3, 4, 7, 8. Since 3 and 8 are already in the same subgrid, we need to see which other numbers fit based on the column and row.

Intermediate Puzzle:

5 3 2 | _ 7 _ | _ _ _

6 _ _ | 1 9 5 | _ _ _

_ 9 8 | _ _ _ | _ 6 _

——+——-+——

8 _ _ | _ 6 _ | _ _ 3

4 _ _ | 8 _ 3 | _ _ 1

7 _ _ | _ 2 _ | _ _ 6

——+——-+——

_ 6 _ | _ _ _ | 2 8 _

_ _ _ | 4 1 9 | _ _ 5

_ _ _ | _ 8 _ | _ 7 9

Step 4: Solve the Puzzle

By continuing to apply these methods, you will gradually fill in the entire grid. Here’s the completed puzzle for reference:

5 3 4 | 6 7 8 | 9 1 2

6 7 2 | 1 9 5 | 3 4 8

1 9 8 | 3 4 2 | 5 6 7

——+——-+——

8 5 9 | 7 6 1 | 4 2 3

4 2 6 | 8 5 3 | 7 9 1

7 1 3 | 9 2 4 | 8 5 6

——+——-+——

9 6 1 | 5 3 7 | 2 8 4

2 8 7 | 4 1 9 | 6 3 5

3 4 5 | 2 8 6 | 1 7 9

Tips for Solving Sudoku

  1. Start with the obvious: Fill in the easy cells first to gain momentum.
  2. Use pencil marks: Write possible numbers in cells to keep track of your thoughts.
  3. Look for patterns: Familiarize yourself with common patterns and techniques, such as naked pairs, hidden pairs, and X-Wing.
  4. Stay organized: Work methodically through rows, columns, and sub grids.
  5. Practice regularly: The more you practice, the better you’ll get at spotting solutions quickly.

Conclusion

Sudoku is a fantastic way to challenge your brain, improve your logical thinking, and enjoy a bit of quiet time. Whether you’re a beginner or an experienced solver, the satisfaction of completing a Sudoku puzzle is a reward in itself. So, grab a puzzle, follow these steps, and immerse yourself in the fascinating world of Sudoku!


Historical Influences of Mathematics (Part 3/3)

Three factors—the needs of the subject, the child, and the society—have influenced what mathematics is to be taught in schools. Many people think that “math is math” and never changes. In this three-part series, we briefly discuss these three factors and paint a different picture: mathematics is a subject that is ever-changing.

In this third and final part, we discuss the-

Needs of the Society

The usefulness of mathematics in everyday life and in many vocations has also affected what is taught and when it is taught. In early America, mathematics was considered necessary primarily for clerks and bookkeepers. The curriculum was limited to counting, the simpler procedures for addition, subtraction, and multiplication, and some facts about measures and fractions. By the late nineteenth century, business and commerce had advanced to the point. that mathematics was considered important for everyone. The arithmetic curriculum expanded to include such topics as percentages, ratios and proportions, powers, roots, and series.

This emphasis on social utility, on teaching what was needed for use in occupations, continued into the twentieth century. One of the most vocal advocates of social utility was Guy Wilson. He and his students conducted numerous surveys to determine what arithmetic was actually used by carpenters, shopkeepers, and other workers. He believed that the dominating aim of the school mathematics program should be to teach those skills and only those skills.

In the 1950s, the outburst of public concern over the “space race” resulted in a wave of research and development in mathematics curricula. Much of this effort was focused on teaching the mathematically talented student. By the mid-1960s, however, concern was also being expressed for the disadvantaged student as U.S. society renewed its commitment to equality of opportunity. With each of these changes, more and better mathematical achievement was promised.

In the 1970s, when it became apparent that the promise of greater achievement had not fully materialised, another swing in curriculum development occurred. Emphasis was again placed on the skills needed for success in the real world. The minimal competency movement stressed the basics. As embodied in sets of objectives and in tests, the basics were considered to be primarily addition, subtraction, multiplication, and division with whole numbers and fractions. Thus, the skills needed in colonial times were again being considered by many to be the sole necessities, even though children were now living in a world with calculators, computers, and other features of a much more technological society.

By the 1980s, it was acknowledged that no one knew exactly what skills were needed for the future but that everyone needed to be able to solve problems. The emphasis on problem-solving matured through the last 20 years of the century to the point where problem-solving was not seen as a separate topic but as a way to learn and use mathematics.

Today, one need of our society is for a workforce that is competitive in the world. There is a call for school mathematics to ensure that students are ready for workforce training programs or college.

Conclusion

International Mathematics Olympiad play a vital role in shaping the intellectual and analytical landscape of society. They not only foster critical thinking, problem-solving skills, and creativity among students but also prepare them to tackle complex real-world issues. By encouraging young minds to engage with challenging mathematical concepts, Olympiads help cultivate a future generation of scientists, engineers, economists, and leaders who can drive innovation and progress. Moreover, the collaborative and competitive nature of these competitions promotes a culture of academic excellence and perseverance.

As we face increasingly complex global challenges, the importance of nurturing a strong foundation in mathematics through Olympiads cannot be overstated. They are not just competitions; they are essential platforms for equipping society with the tools and mindset needed to build a better, more informed, and innovative world.