Mathematicians Find 27 Tickets That Guarantee UK National Lottery Win

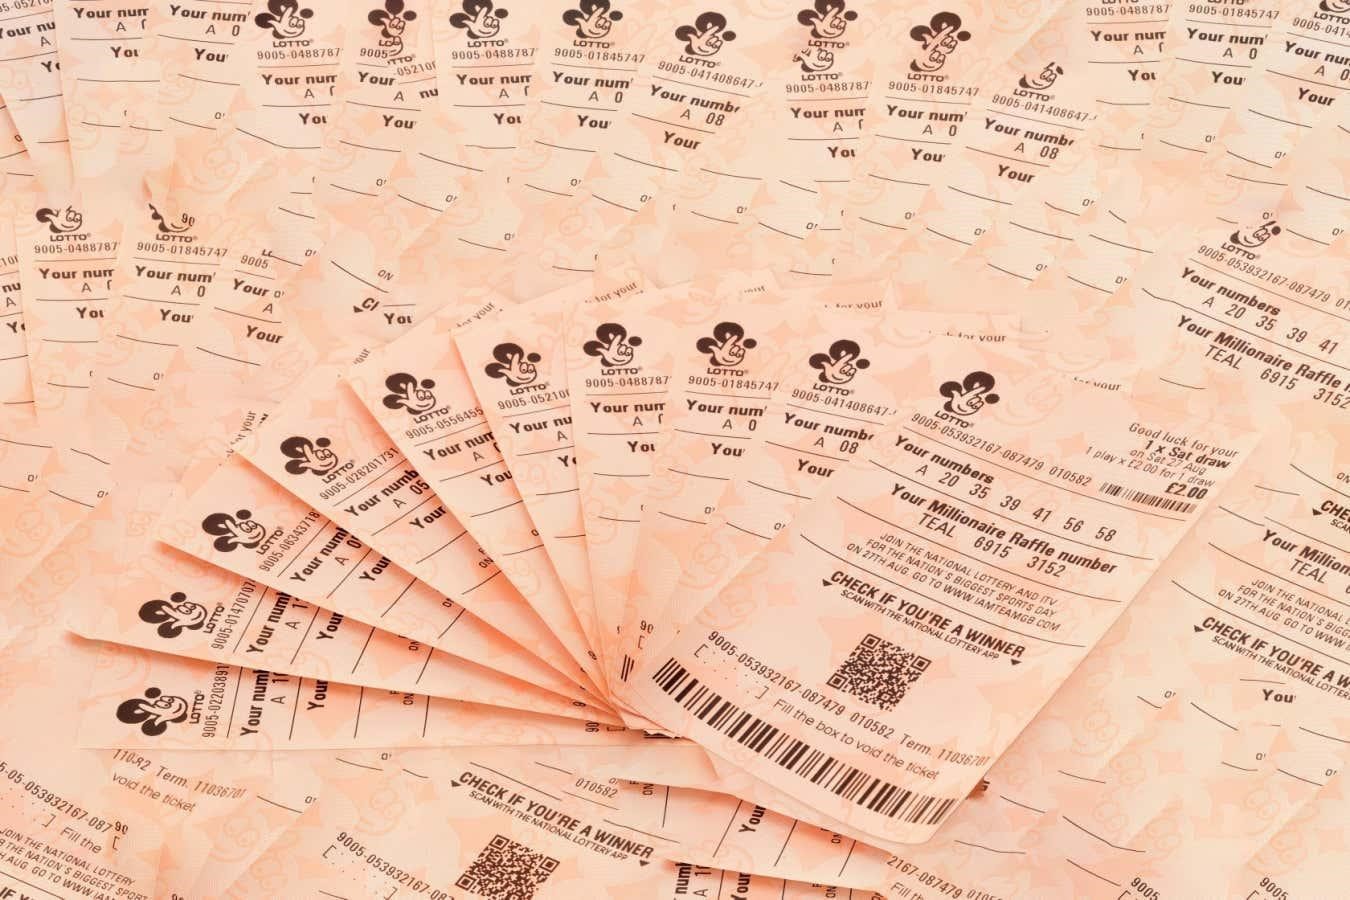
Buying a specific set of 27 tickets for the UK National Lottery will mathematically guarantee that you win something.

Buying 27 tickets ensures a win in the UK National Lottery

You can guarantee a win in every draw of the UK National Lottery by buying just 27 tickets, say a pair of mathematicians – but you won’t necessarily make a profit.

While there are many variations of lottery in the UK, players in the standard “Lotto” choose six numbers from 1 to 59, paying £2 per ticket. Six numbers are randomly drawn and prizes are awarded for tickets matching two or more.

David Cushing and David Stewart at the University of Manchester, UK, claim that despite there being 45,057,474 combinations of draws, it is possible to guarantee a win with just 27 specific tickets. They say this is the optimal number, as the same can’t be guaranteed with 26.

The proof of their idea relies on a mathematical field called finite geometry and involves placing each of the numbers from 1 to 59 in pairs or triplets on a point within one of five geometrical shapes, then using these to generate lottery tickets based on the lines within the shapes. The five shapes offer 27 such lines, meaning that 27 tickets bought using those numbers, at a cost of £54, will hit every possible winning combination of two numbers.

The 27 tickets that guarantee a win on the UK National Lottery

Their research yielded a specific list of 27 tickets (see above), but they say subsequent work has shown that there are two other combinations of 27 tickets that will also guarantee a win.

“We’ve been thinking about this problem for a few months. I can’t really explain the thought process behind it,” says Cushing. “I was on a train to Manchester and saw this [shape] and that’s the best logical [explanation] I can give.”

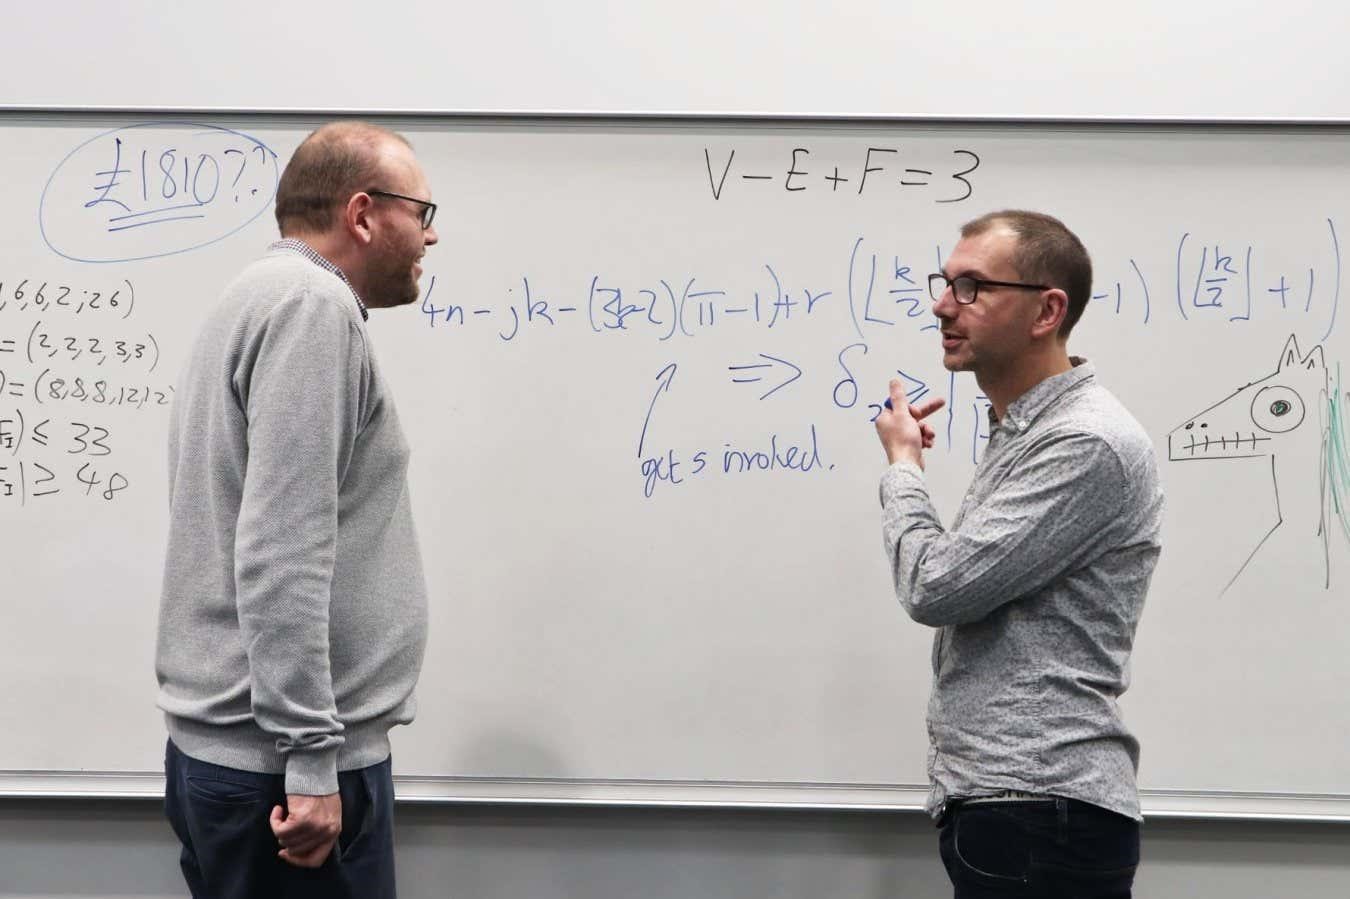
Looking at the winning numbers from the 21 June Lotto draw, the pair found their method would have won £1810. But the same numbers played on 1 July would have matched just two balls on three of the tickets – still a technical win, but giving a prize of just three “lucky dip” tries on a subsequent lottery, each of which came to nothing.

Stewart says proving that 27 tickets could guarantee a win was the easiest part of the research, while proving it is impossible to guarantee a win with 26 was far trickier. He estimates that the number of calculations needed to verify that would be 10165, far more than the number of atoms in the universe. “There’d be absolutely no way to brute force this,” he says.

The solution was a computer programming language called Prolog, developed in France in 1971, which Stewart says is the “hero of the story”. Unlike traditional computer languages where a coder sets out precisely what a machine should do, step by step, Prolog instead takes a list of known facts surrounding a problem and works on its own to deduce whether or not a solution is possible. It takes these facts and builds on them or combines them in order to slowly understand the problem and whittle down the array of possible solutions.

“You end up with very, very elegant-looking programs,” says Stewart. “But they are quite temperamental.”

Cushing says the research shouldn’t be taken as a reason to gamble more, particularly as it doesn’t guarantee a profit, but hopes instead that it encourages other researchers to delve into using Prolog on thorny mathematical problems.

A spokesperson from Camelot, the company that operates the lottery, told New Scientist that the paper made for “interesting reading”.

“Our approach has always been to have lots of people playing a little, with players individually spending small amounts on our games,” they say. “It’s also important to bear in mind that, ultimately, Lotto is a lottery. Like all other National Lottery draw-based games, all of the winning Lotto numbers are chosen at random – any one number has the same and equal chance of being drawn as any other, and every line of numbers entered into a draw has the same and equal chance of winning as any other.”

For more such insights, log into www.international-maths-challenge.com.

*Credit for article given to Matthew Sparkes*


Everything You Need To Know About Statistics (But Were Afraid To Ask)

Does the thought of p-values and regressions make you break out in a cold sweat? Never fear – read on for answers to some of those burning statistical questions that keep you up 87.9% of the night.

  • What are my hypotheses?

There are two types of hypothesis you need to get your head around: null and alternative. The null hypothesis always states the status quo: there is no difference between two populations, there is no effect of adding fertiliser, there is no relationship between weather and growth rates.

Basically, nothing interesting is happening. Generally, scientists conduct an experiment seeking to disprove the null hypothesis. We build up evidence, through data collection, against the null, and if the evidence is sufficient we can say with a degree of probability that the null hypothesis is not true.

We then accept the alternative hypothesis. This hypothesis states the opposite of the null: there is a difference, there is an effect, there is a relationship.

  • What’s so special about 5%?

One of the most common numbers you stumble across in statistics is alpha = 0.05 (or in some fields 0.01 or 0.10). Alpha denotes the fixed significance level for a given hypothesis test. Before starting any statistical analyses, along with stating hypotheses, you choose a significance level you’re testing at.

This states the threshold at which you are prepared to accept the possibility of a Type I Error – otherwise known as a false positive – rejecting a null hypothesis that is actually true.

  • Type what error?

Most often we are concerned primarily with reducing the chance of a Type I Error over its counterpart (Type II Error – accepting a false null hypothesis). It all depends on what the impact of either error will be.

Take a pharmaceutical company testing a new drug; if the drug actually doesn’t work (a true null hypothesis) then rejecting this null and asserting that the drug does work could have huge repercussions – particularly if patients are given this drug over one that actually does work. The pharmaceutical company would be concerned primarily with reducing the likelihood of a Type I Error.

Sometimes, a Type II Error could be more important. Environmental testing is one such example; if the effect of toxins on water quality is examined, and in truth the null hypothesis is false (that is, the presence of toxins does affect water quality) a Type II Error would mean accepting a false null hypothesis, and concluding there is no effect of toxins.

The down-stream issues could be dire, if toxin levels are allowed to remain high and there is some health effect on people using that water.

Do you know the difference between continuous and categorical variables?

  • What is a p-value, really?

Because p-values are thrown about in science like confetti, it’s important to understand what they do and don’t mean. A p-value expresses the probability of getting a given result from a hypothesis test, or a more extreme result, if the null hypothesis were true.

Given we are trying to reject the null hypothesis, what this tells us is the odds of getting our experimental data if the null hypothesis is correct. If the odds are sufficiently low we feel confident in rejecting the null and accepting the alternative hypothesis.

What is sufficiently low? As mentioned above, the typical fixed significance level is 0.05. So if the probability portrayed by the p-value is less than 5% you reject the null hypothesis. But a fixed significance level can be deceiving: if 5% is significant, why is 6% not?

It pays to remember that such probabilities are continuous, and any given significance level is arbitrary. In other words, don’t throw your data away simply because you get a p-value of 6-10%.

  • How much replication do I have?

This is probably the biggest issue when it comes to experimental design, in which the focus is on ensuring the right type of data, in large enough quantities, is available to answer given questions as clearly and efficiently as possible.

Pseudoreplication refers to the over-inflation of degrees of freedom (a mathematical restriction put in place when we calculate a parameter – e.g. a mean – from a sample). How would this work in practice?

Say you’re researching cholesterol levels by taking blood from 20 male participants.

Each male is tested twice, giving 40 test results. But the level of replication is not 40, it’s actually only 20 – a requisite for replication is that each replicate is independent of all others. In this case, two blood tests from the same person are intricately linked.

If you were to analyse the data with a sample size of 40, you would be committing the sin of pseudoreplication: inflating your degrees of freedom (which incidentally helps to create a significant test result). Thus, if you start an experiment understanding the concept of independent replication, you can avoid this pitfall.

  • How do I know what analysis to do?

There is a key piece of prior knowledge that will help you determine how to analyse your data. What kind of variable are you dealing with? There are two most common types of variable:

1) Continuous variables. These can take any value. Were you to you measure the time until a reaction was complete, the results might be 30 seconds, two minutes and 13 seconds, or three minutes and 50 seconds.

2) Categorical variables. These fit into – you guessed it – categories. For instance, you might have three different field sites, or four brands of fertiliser. All continuous variables can be converted into categorical variables.

With the above example we could categorise the results into less than one minute, one to three minutes, and greater than three minutes. Categorical variables cannot be converted back to continuous variables, so it’s generally best to record data as “continuous” where possible to give yourself more options for analysis.

Deciding which to use between the two main types of analysis is easy once you know what variables you have:

ANOVA (Analysis of Variance) is used to compare a categorical variable with a continuous variable – for instance, fertiliser treatment versus plant growth in centimetres.

Linear Regression is used when comparing two continuous variables – for instance, time versus growth in centimetres.

Though there are many analysis tools available, ANOVA and linear regression will get you a long way in looking at your data. So if you can start by working out what variables you have, it’s an easy second step to choose the relevant analysis.

Ok, so perhaps that’s not everything you need to know about statistics, but it’s a start. Go forth and analyse!

For more such insights, log into www.international-maths-challenge.com.

*Credit for article given to Sarah-Jane O’Connor*


Mathematicians Have Finally Proved That Bach was a Great Composer

Converting hundreds of compositions by Johann Sebastian Bach into mathematical networks reveals that they store lots of information and convey it very effectively.

Johann Sebastian Bach is considered one of the great composers of Western classical music. Now, researchers are trying to figure out why – by analysing his music with information theory.

Suman Kulkarni at the University of Pennsylvania and her colleagues wanted to understand how the ability to recall or anticipate a piece of music relates to its structure. They chose to analyse Bach’s opus because he produced an enormous number of pieces with many different structures, including religious hymns called chorales and fast-paced, virtuosic toccatas.

First, the researchers translated each composition into an information network by representing each note as a node and each transition between notes as an edge, connecting them. Using this network, they compared the quantity of information in each composition. Toccatas, which were meant to entertain and surprise, contained more information than chorales, which were composed for more meditative settings like churches.

Kulkarni and her colleagues also used information networks to compare Bach’s music with listeners’ perception of it. They started with an existing computer model based on experiments in which participants reacted to a sequence of images on a screen. The researchers then measured how surprising an element of the sequence was. They adapted information networks based on this model to the music, with the links between each node representing how probable a listener thought it would be for two connected notes to play successively – or how surprised they would be if that happened. Because humans do not learn information perfectly, networks showing people’s presumed note changes for a composition rarely line up exactly with the network based directly on that composition. Researchers can then quantify that mismatch.

In this case, the mismatch was low, suggesting Bach’s pieces convey information rather effectively. However, Kulkarni hopes to fine-tune the computer model of human perception to better match real brain scans of people listening to the music.

“There is a missing link in neuroscience between complicated structures like music and how our brains respond to it, beyond just knowing the frequencies [of sounds]. This work could provide some nice inroads into that,” says Randy McIntosh at Simon Fraser University in Canada. However, there are many more factors that affect how someone perceives music – for example, how long a person listens to a piece and whether or not they have musical training. These still need to be accounted for, he says.

Information theory also has yet to reveal whether Bach’s composition style was exceptional compared with other types of music. McIntosh says his past work found some general similarities between musicians as different from Bach as the rock guitarist Eddie Van Halen, but more detailed analyses are needed.

“I would love to perform the same analysis for different composers and non-Western music,” says Kulkarni.

For more such insights, log into www.international-maths-challenge.com.

*Credit for article given to Karmela Padavic-Callaghan*


To Make Maths Classes Sizzle, Inject Some Politics And Social Justice

Relating mathematics to questions that are relevant to many students can help address its image problem, argues Eugenia Cheng.

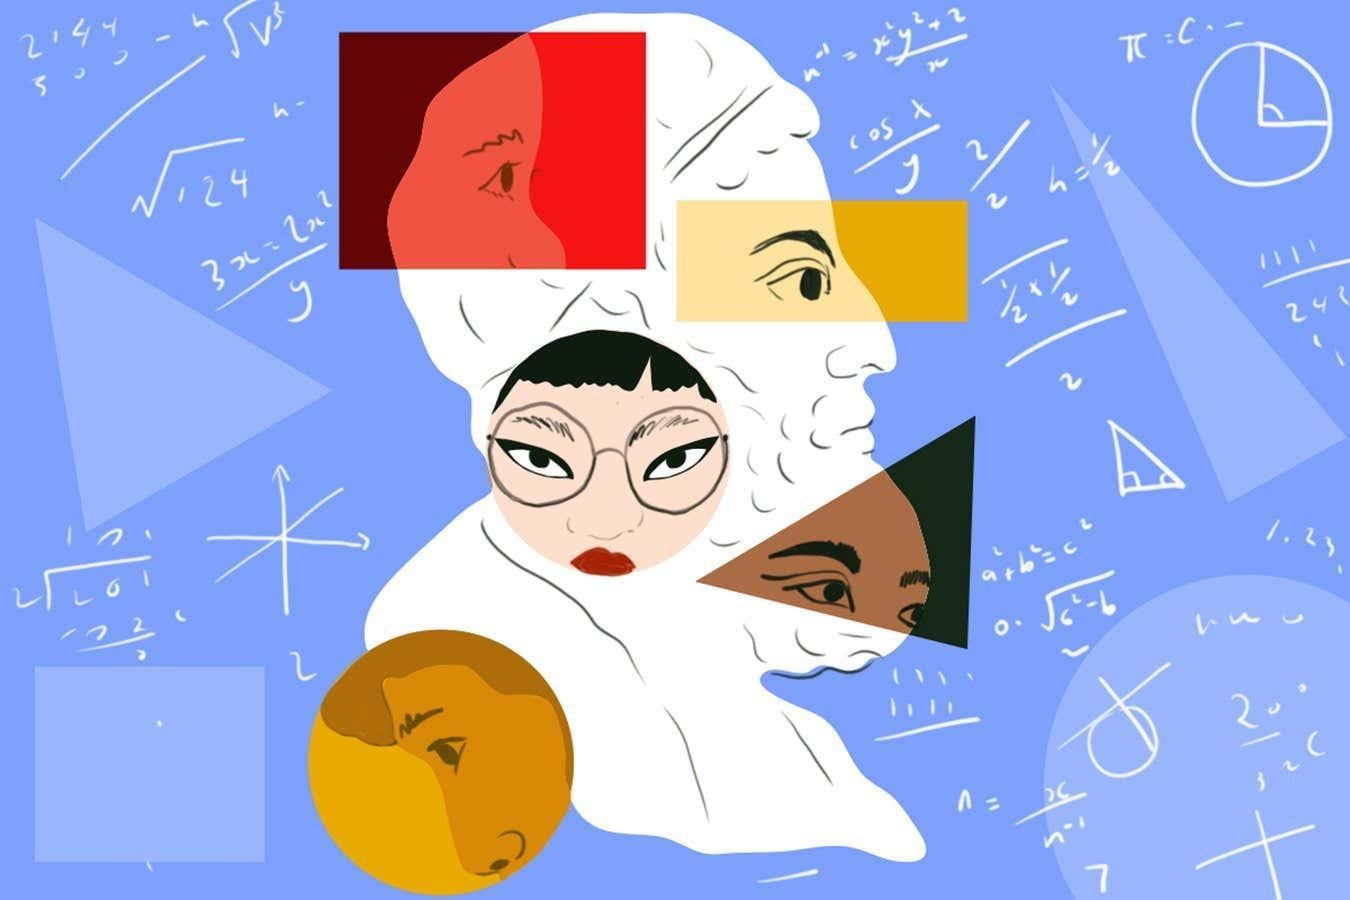
Mathematics has an image problem: far too many people are put off it and conclude that the subject just isn’t for them. There are many issues, including the curriculum, standardised tests and constraints placed on teachers. But one of the biggest problems is how maths is presented, as cold and dry.

Attempts at “real-life” applications are often detached from our daily lives, such as arithmetic problems involving a ludicrous number of watermelons or using a differential equation to calculate how long a hypothetical cup of coffee will take to cool.

I have a different approach, which is to relate abstract maths to questions of politics and social justice. I have taught fairly maths-phobic art students in this way for the past seven years and have seen their attitudes transformed. They now believe maths is relevant to them and can genuinely help them in their everyday lives.

At a basic level, maths is founded on logic, so when I am teaching the principles of logic, I use examples from current events rather than the old-fashioned, detached type of problem. Instead of studying the logic of a statement like “all dogs have four legs”, I might discuss the (also erroneous) statement “all immigrants are illegal”.

But I do this with specific mathematical structures, too. For example, I teach a type of structure called an ordered set, which is a set of objects subject to an order relation such as “is less than”. We then study functions that map members of one ordered set to members of another, and ask which functions are “order-preserving”. A typical example might be the function that takes an ordinary number and maps it to the number obtained from multiplying by 2. We would then say that if x < y then also 2x < 2y, so the function is order-preserving. By contrast the function that squares numbers isn’t order-preserving because, for example, -2 < -1, but (-2)2 > (-1)2. If we work through those squaring operations, we get 4 and 1.

However, rather than sticking to this type of dry mathematical example, I introduce ones about issues like privilege and wealth. If we think of one ordered set with people ordered by privilege, we can make a function to another set where the people are now ordered by wealth instead. What does it mean for that to be order-preserving, and do we expect it to be so? Which is to say, if someone is more privileged than someone else, are they automatically more wealthy? We can also ask about hours worked and income: if someone works more hours, do they necessarily earn more? The answer there is clearly no, but then we go on to discuss whether we think this function should be order-preserving or not, and why.

My approach is contentious because, traditionally, maths is supposed to be neutral and apolitical. I have been criticised by people who think my approach will be off-putting to those who don’t care about social justice; however, the dry approach is off-putting to those who do care about social justice. In fact, I believe that all academic disciplines should address our most important issues in whatever way they can. Abstract maths is about making rigorous logical arguments, which is relevant to everything. I don’t demand that students agree with me about politics, but I do ask that they construct rigorous arguments to back up their thoughts and develop the crucial ability to analyse the logic of people they disagree with.

Maths isn’t just about numbers and equations, it is about studying different logical systems in which different arguments are valid. We can apply it to balls rolling down different hills, but we can also apply it to pressing social issues. I think we should do both, for the sake of society and to be more inclusive towards different types of student in maths education.

For more such insights, log into www.international-maths-challenge.com.

*Credit for article given to Eugenia Cheng*


Mathematicians Find Odd Shapes That Roll Like A Wheel In Any Dimension

Not content with shapes in two or three dimensions, mathematicians like to explore objects in any number of spatial dimensions. Now they have discovered shapes of constant width in any dimension, which roll like a wheel despite not being round.

A 3D shape of constant width as seen from three different angles. The middle view resembles a 2D Reuleaux triangle

Mathematicians have reinvented the wheel with the discovery of shapes that can roll smoothly when sandwiched between two surfaces, even in four, five or any higher number of spatial dimensions. The finding answers a question that researchers have been puzzling over for decades.

Such objects are known as shapes of constant width, and the most familiar in two and three dimensions are the circle and the sphere. These aren’t the only such shapes, however. One example is the Reuleaux triangle, which is a triangle with curved edges, while people in the UK are used to handling equilateral curve heptagons, otherwise known as the shape of the 20 and 50 pence coins. In this case, being of constant width allows them to roll inside coin-operated machines and be recognised regardless of their orientation.

Crucially, all of these shapes have a smaller area or volume than a circle or sphere of the equivalent width – but, until now, it wasn’t known if the same could be true in higher dimensions. The question was first posed in 1988 by mathematician Oded Schramm, who asked whether constant-width objects smaller than a higher-dimensional sphere might exist.

While shapes with more than three dimensions are impossible to visualise, mathematicians can define them by extending 2D and 3D shapes in logical ways. For example, just as a circle or a sphere is the set of points that sits at a constant distance from a central point, the same is true in higher dimensions. “Sometimes the most fascinating phenomena are discovered when you look at higher and higher dimensions,” says Gil Kalai at the Hebrew University of Jerusalem in Israel.

Now, Andrii Arman at the University of Manitoba in Canada and his colleagues have answered Schramm’s question and found a set of constant-width shapes, in any dimension, that are indeed smaller than an equivalent dimensional sphere.

Arman and his colleagues had been working on the problem for several years in weekly meetings, trying to come up with a way to construct these shapes before they struck upon a solution. “You could say we exhausted this problem until it gave up,” he says.

The first part of the proof involves considering a sphere with n dimensions and then dividing it into 2n equal parts – so four parts for a circle, eight for a 3D sphere, 16 for a 4D sphere and so on. The researchers then mathematically stretch and squeeze these segments to alter their shape without changing their width. “The recipe is very simple, but we understood that only after all of our elaboration,” says team member Andriy Bondarenko at the Norwegian University of Science and Technology.

The team proved that it is always possible to do this distortion in such a way that you end up with a shape that has a volume at most 0.9n times that of the equivalent dimensional sphere. This means that as you move to higher and higher dimensions, the shape of constant width gets proportionally smaller and smaller compared with the sphere.

Visualising this is difficult, but one trick is to imagine the lower-dimensional silhouette of a higher-dimensional object. When viewed at certain angles, the 3D shape appears as a 2D Reuleaux triangle (see the middle image above). In the same way, the 3D shape can be seen as a “shadow” of the 4D one, and so on.  “The shapes in higher dimensions will be in a certain sense similar, but will grow in complexity as [the] dimension grows,” says Arman.

Having identified these shapes, mathematicians now hope to study them further. “Even with the new result, which takes away some of the mystery about them, they are very mysterious sets in high dimensions,” says Kalai.

For more such insights, log into www.international-maths-challenge.com.

*Credit for article given to Alex Wilkins*


Vindication For Maths Teachers: Pythagoras’s Theorem Seen in the Wild

For all the students wondering why they would ever need to use the Pythagorean theorem, Katie Steckles is delighted to report on a real-world encounter.

Recently, I was building a flat-pack wardrobe when I noticed something odd in the instructions. Before you assembled the wardrobe, they said, you needed to measure the height of the ceiling in the room you were going to put it in. If it was less than 244 centimetres high, there was a different set of directions to follow.

These separate instructions asked you to build the wardrobe in a vertical orientation, holding the side panels upright while you attached them to the base. The first set of directions gave you a much easier job, building the wardrobe flat on the floor before lifting it up into place. I was intrigued by the value of 244 cm: this wasn’t the same as the height of the wardrobe, or any other dimension on the package, and I briefly wondered where that number had come from. Then I realised: Pythagoras.

The wardrobe was 236 cm high and 60 cm deep. Looking at it side-on, the length of the diagonal line from corner to corner can be calculated using Pythagoras’s theorem. The vertical and horizontal sides meet at a right angle, meaning if we square the length of each then add them together, we get the well-known “square of the hypotenuse”. Taking the square root of this number gives the length of the diagonal.

In this case, we get a diagonal length a shade under 244 cm. If you wanted to build the wardrobe flat and then stand it up, you would need that full diagonal length to fit between the floor and the ceiling to make sure it wouldn’t crash into the ceiling as it swung past – so 244 cm is the safe ceiling height. It is a victory for maths in the real world, and vindication for maths teachers everywhere being asked, “When am I going to use this?”

This isn’t the only way we can connect Pythagoras to daily tasks. If you have ever needed to construct something that is a right angle – like a corner in joinery, or when laying out cones to delineate the boundaries of a sports pitch – you can use the Pythagorean theorem in reverse. This takes advantage of the fact that a right-angled triangle with sides of length 3 and 4 has a hypotenuse of 5 – a so-called 3-4-5 triangle.

If you measure 3 units along one side from the corner, and 4 along the other, and join them with a diagonal, the diagonal’s length will be precisely 5 units, if the corner is an exact right angle. Ancient cultures used loops of string with knots spaced 3, 4 and 5 units apart – when held out in a triangle shape, with a knot at each vertex, they would have a right angle at one corner. This technique is still used as a spot check by builders today.

Engineers, artists and scientists might use geometrical thinking all the time, but my satisfaction in building a wardrobe, and finding the maths checked out perfectly, is hard to beat.

Katie Steckles is a mathematician, lecturer, YouTuber and author based in Manchester, UK. She is also puzzle adviser for New Scientist’s puzzle column, BrainTwister. Follow her @stecks

For more such insights, log into www.international-maths-challenge.com.

*Credit for article given to Peter Rowlett*


Pythagoras Was Wrong About The Maths Behind Pleasant Music

It is said that the ancient Greek philosopher Pythagoras came up with the idea that musical note combinations sound best in certain mathematical ratios, but that doesn’t seem to be true.

Pythagoras has influenced Western music for millennia

An ancient Greek belief about the most pleasing combinations of musical notes – often attributed to the philosopher Pythagoras – doesn’t actually reflect the way people around the world appreciate harmony, researchers have found. Instead, Pythagoras’s mathematical arguments may merely have been taken as fact and used to assert the superiority of Western culture.

According to legend, Pythagoras found that the ringing sounds of a blacksmith’s hammers sounded most pleasant, or “consonant”, when the ratio between the size of two tools involved two integers, or whole numbers, such as 3:2.

This idea has shaped how Western musicians play chords, because the philosopher’s belief that listeners prefer music played in perfect mathematical ratios was so influential. “Consonance is a really important concept in Western music, in particular for telling us how we build harmonies,” says Peter Harrison at the University of Cambridge.

But when Harrison and his colleagues surveyed 4272 people in the UK and South Korea about their perceptions of music, their findings flew in the face of this ancient idea.

In one experiment, participants were played musical chords and asked to rate how pleasant they seemed. Listeners were found to slightly prefer sounds with an imperfect ratio. Another experiment discovered little difference in appeal between the sounds made by instruments from around the world, including the bonang, an Indonesian gong chime, which produces harmonies that cannot be replicated on a Western piano.

While instruments like the bonang have traditionally been called “inharmonic” by Western music culture, study participants appreciated the sounds the instrument and others like it made. “If you use non-Western instruments, you start preferring different harmonies,” says Harrison.

“It’s fascinating that music can be so universal yet so diverse at the same time,” says Patrick Savage at the University of Auckland, New Zealand. He says that the current study also contradicts previous research he did with some of the same authors, which found that integer ratio-based rhythms are surprisingly universal.

Michelle Phillips at the Royal Northern College of Music in Manchester, UK, points out that the dominance of Pythagorean tunings, as they are known, has been in question for some time. “Research has been hinting at this for 30 to 40 years, as music psychology has grown as a discipline,” she says. “Over the last fifteenish years, people have undertaken more work on music in the whole world, and we now know much more about non-Western pitch perception, which shows us even more clearly how complex perception of harmony is.”

Harrison says the findings tell us both that Pythagoras was wrong about music – and that music and music theory have been too focused on the belief that Western views are held worldwide. “The idea that simple integer ratios are superior could be framed as an example of mathematical justification for why we’ve got it right over here,” he says. “What our studies are showing is that, actually, this is not an inviolable law. It’s something that depends very much on the way in which you’re playing music.”

For more such insights, log into www.international-maths-challenge.com.

*Credit for article given to Chris Stokel-Walker*


Mathematicians Make Even Better Never-Repeating Tile Discovery

An unsatisfying caveat in a mathematical breakthrough discovery of a single tile shape that can cover a surface without ever creating a repeating pattern has been eradicated. The newly discovered “spectre” shape can cover a surface without repeating and without mirror images.

The pattern on the left side is made up of the “hat” shape, including reflections. The pattern on the right is made up of round-edged “spectre” shapes that repeat infinitely without reflections

David Smith et al

Mathematicians solved a decades-long mystery earlier this year when they discovered a shape that can cover a surface completely without ever creating a repeating pattern. But the breakthrough had come with a caveat: both the shape and its mirror image were required. Now the same team has discovered that a tweaked version of the original shape can complete the task without its mirror.

Simple shapes such as squares and equilateral triangles can tile a surface without gaps in a repeating pattern. Mathematicians have long been interested in a more complex version of tiling, known as aperiodic tiling, which involves using more complex shapes that never form such a repeating pattern.

The most famous aperiodic tiles were created by mathematician Roger Penrose, who in the 1970s discovered that two different shapes could be combined to create an infinite, never-repeating tiling. In March, Chaim Goodman-Strauss at the University of Arkansas and his colleagues found the “hat”, a shape that could technically do it alone, but using a left-handed and right-handed version. This was a slightly unsatisfying solution and left the question of whether a single shape could achieve the same thing with no reflections remaining.

The researchers have now tweaked the equilateral polygon from their previous research to create a new family of shapes called spectres. These shapes allow non-repeating pattern tiling using no reflections at all.

Until now, it wasn’t clear whether such a single shape, known as an einstein (from the German “ein stein” or “one stone”), could even exist. The researchers say in their paper that the previous discovery of the hat was a reminder of how little understood tiling patterns are, and that they were surprised to make another breakthrough so soon.

“Certainly there is no evidence to suggest that the hat (and the continuum of shapes to which it belongs) is somehow unique, and we might therefore hope that a zoo of interesting new monotiles will emerge in its wake,” the researchers write in their new paper. “Nonetheless, we did not expect to find one so close at hand.”

Sarah Hart at Birkbeck, University of London, says the new result is even more impressive than the original finding. “It’s very intellectually satisfying to have a solution that doesn’t need the mirror image because if you actually had real tiles then a tile and its mirror image are not the same,” she says. “With this new tile there are no such caveats.”

For more such insights, log into www.international-maths-challenge.com.

*Credit for article given to Matthew Sparkes*


Try These Mathematical Magic Tricks That Are Guaranteed To Work

There are no rabbits pulled out of hats here – these tricks rely on mathematical principles and will never fail you, says Peter Rowlett.

LOOK, I’ve got nothing up my sleeves. There are magic tricks that work by sleight of hand, relying on the skill of the performer and a little psychology. Then there are so-called self-working magic tricks, which are guaranteed to work by mathematical principles.

For example, say I ask you to write down a four-digit number and show me. I will write a prediction but keep it secret. Write another four-digit number and show me, then I will write one and show you. Now, sum the three visible numbers and you may be surprised to find the answer matches the prediction I made when I had only seen one number!

The trick is that while the number I wrote and showed you appeared random, I was actually choosing digits that make 9 when added to the digits of your second number. So if you wrote 3295, I would write 6704. This means the two numbers written after I made my prediction sum to 9999. So, my prediction was just your original number plus 9999. This is the same as adding 10,000 and subtracting 1, so I simply wrote a 1 to the left of your number and decreased the last digit by 1. If you wrote 2864, I would write 12863 as my prediction.

Another maths trick involves a series of cards with numbers on them (pictured). Someone thinks of a number and tells you which of the cards their number appears on. Quick as a flash, you tell them their number. You haven’t memorised anything; the trick works using binary numbers.

Regular numbers can be thought of as a series of columns containing digits, with each being 10 times the previous. So the right-most digit is the ones, to its left is the tens, then the hundreds, and so on. Binary numbers also use columns, but with each being worth two times the one to its right. So 01101 means zero sixteens, one eight, one four, zero twos and one one: 8+4+1=13.

Each card in this trick represents one of the columns in a binary number, moving from right to left: card 0 is the ones column, card 1 is the twos column, etc. Numbers appear on a card if their binary equivalent has a 1 in that place, and are omitted if it has a 0 there. For instance, the number 25 is 11001 in binary, so it is on cards 0, 3 and 4.

You can work this trick by taking the cards the person’s number appears on and converting them to their binary columns. From there, you can figure out the binary number and convert it to its regular number. But here’s a simple shortcut: the binary column represented by each card is the first number on the card, so you can just add the first number that appears on the cards the person names. So, for cards 0 and 2, you would add 1 and 4 to get 5.

Many self-working tricks embed mathematical principles in card magic, memorisation tricks or mind-reading displays, making the maths harder to spot. The key is they work every time.

For more such insights, log into www.international-maths-challenge.com.

*Credit for article given to Peter Rowlett*


Mathematicians Discovered The Ultimate Bathroom Tile In 2023

After decades of searching, mathematicians discovered a single shape that can cover a surface without forming repeating patterns, launching a small industry of “aperiodic monotile” merchandise.

The “hat” shape can tile an infinite plane without creating repeating patterns

It is rare for a shape to make a splash, but this year one did just that with the announcement of the first ever single tile that can cover a surface without forming repeating patterns. The discovery of this “aperiodic monotile” in March has since inspired everything from jigsaw puzzles to serious research papers.

“It’s more than I can keep up with in terms of the amount and even, to some extent, the level and depth of the material, because I’m not really a practising mathematician, I’m more of a computer scientist,” says Craig Kaplan at the University of Waterloo, Canada. He is on the team that found the shape, which it called the “hat”. Mathematicians had sought such an object for decades.

After revealing the tile in March, the team unveiled a second shape in May, the “spectre”, which improved on the hat by not requiring its mirror image to tile fully, making it more useful for real surfaces.

The hat has since appeared on T-shirts, badges, bags and as cutters that allow you to make your own ceramic versions.

It has also sparked more than a dozen papers in fields from engineering to chemistry. Researchers have investigated how the structure maps into six-dimensional spaces and the likely physical properties of a material with hat-shaped crystals. Others have found that structures built with repeating hat shapes could be more resistant to fracturing than a honeycomb pattern, which is renowned for its strength.

Kaplan says a scientific instrument company has also expressed an interest in using a mesh with hat-shaped gaps to collect atmospheric samples on Mars, as it believes that the pattern may be less susceptible to problems than squares.

“It’s a bit bittersweet,” says Kaplan. “We’ve set these ideas free into the world and they’ve taken off, which is wonderful, but leaves me a little bit melancholy because it’s not mine any more.”

However, the team has no desire to commercialise the hat, he says. “The four of us agreed early on that we’d much rather let this be free and see what wonderful things people do with it, rather than trying to protect it in any way. Patents are something that, as mathematicians, we find distasteful.”

For more such insights, log into www.international-maths-challenge.com.

*Credit for article given to Matthew Sparkes*