A periodic table of primes: Research team claims that prime numbers can be predicted

Both arithmetic aficionados and the mathematically challenged will be equally captivated by new research that upends hundreds of years of popular belief about prime numbers.

Contrary to what just about every mathematician on Earth will tell you, prime numbers can be predicted, according to researchers at City University of Hong Kong (CityUHK) and North Carolina State University, U.S.

The research team comprises Han-Lin Li, Shu-Cherng Fang, and Way Kuo. Fang is the Walter Clark Chair Professor of Industrial and Systems Engineering at North Carolina State University. Kuo is a Senior Fellow at the Hong Kong Institute for Advanced Study, CityU.

This is a genuinely revolutionary development in prime number theory, says Way Kuo, who is working on the project alongside researchers from the U.S. The team leader is Han-Lin Li, a Visiting Professor in the Department of Computer Science at CityUHK.

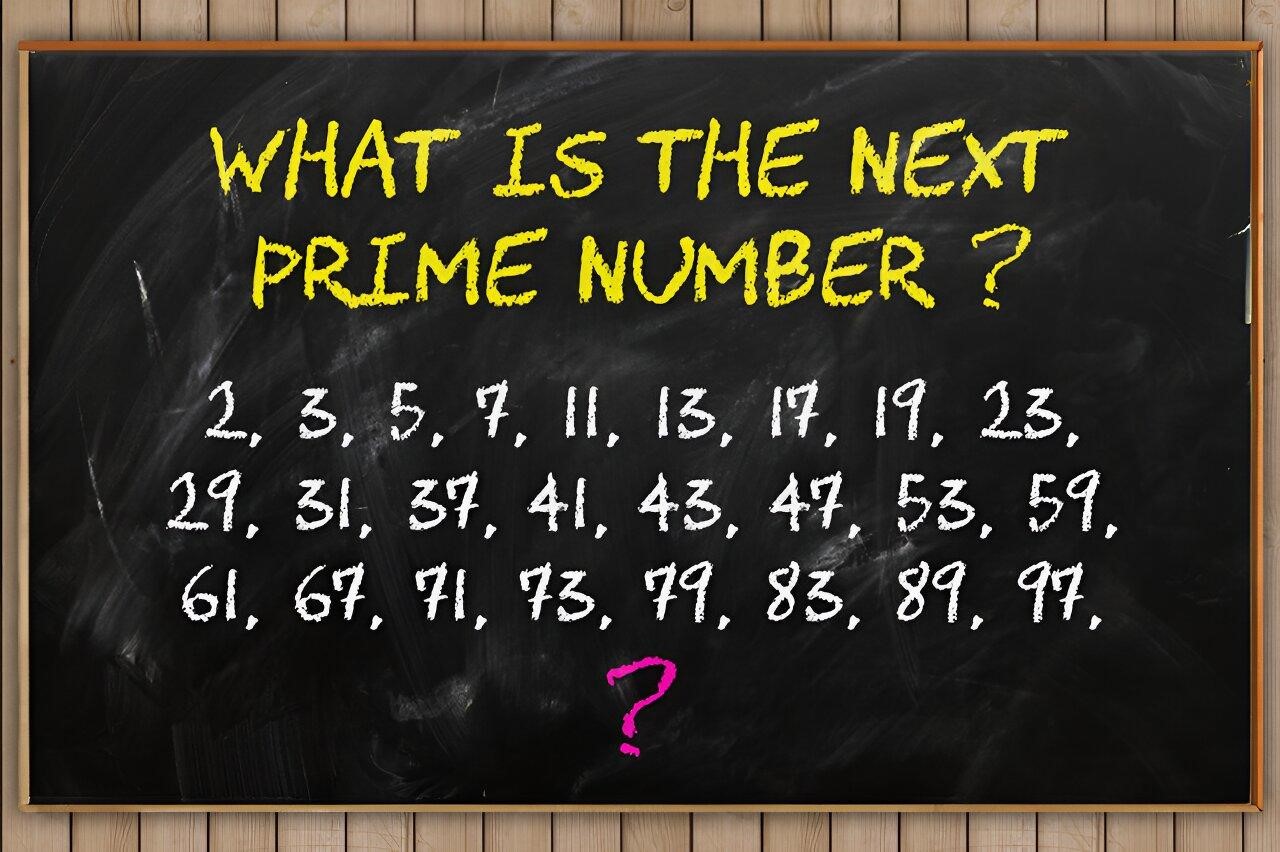
We have known for millennia that an infinite number of prime numbers, i.e., 2, 3, 5, 7, 11, etc., can be divided by themselves and the number 1 only. But until now, we have not been able to predict where the next prime will pop up in a sequence of numbers. In fact, mathematicians have generally agreed that prime numbers are like weeds: they seem just to shoot out randomly.

“But our team has devised a way to predict accurately and swiftly when prime numbers will appear,” adds Kuo.

The technical aspects of the research are daunting for all but a handful of mathematicians worldwide. In a nutshell, the outcome of the team’s research is a handy periodic table of primes, or the PTP, pointing the locations of prime numbers. The research is available as a working paper in the SSRN Electronic Journal.

The PTP can be used to shed light on finding a future prime, factoring an integer, visualizing an integer and its factors, identifying locations of twin primes, predicting the total number of primes and twin primes or estimating the maximum prime gap within an interval, among others.

More to the point, the PTP has major applications today in areas such as cyber security. Primes are already a fundamental part of encryption and cryptography, so this breakthrough means data can be made much more secure if we can predict prime numbers, Kuo explains.

This advance in prime number research stemmed from working on systems reliability design and a color coding system that uses prime numbers to enable efficient encoding and more effective color compression. During their research, the team discovered that their calculations could be used to predict prime numbers.

For more such insights, log into our website https://international-maths-challenge.com

Credit of the article given to Michael Gibb, City University of Hong Kong


How do we solve the maths teacher shortage? We can start by training more existing teachers to teach maths

Imagine if you enrolled your child in swimming lessons but instead of a qualified swimming instructor, they were taught freestyle technique by a soccer coach.

Something similar is happening in classrooms around Australia every day. As part of the ongoing teacher shortage, there are significant numbers of teachers teaching “out-of-field”. This means they are teaching subjects they are not qualified to teach.

One of the subjects where out-of-field teaching is particularly common is maths.

A 2021 report on Australia’s teaching workforce found that 40% of those teaching high school mathematics are out-of-field (English and science were 28% and 29%, respectively).

Another 2021 study of students in Year 8 found they were more likely to be taught by teachers who had specialist training in both maths and maths education if they went to a school in an affluent area rather than a disadvantaged one (54% compared with 31%).

Our new report looks at how we can fix this situation by training more existing teachers in maths education.


Why is this a problem?

Mathematics is one of the key parts of school education. But we are seeing worrying signs students are not receiving the maths education they need.

The 2021 study of Year 8 students showed those taught by teachers with a university degree majoring in maths had markedly higher results, compared with those taught by out-of-field teachers.

We also know maths skills are desperately needed in the broader workforce. The burgeoning worlds of big data and artificial intelligence rely on mathematical and statistical thinking, formulae and algorithms. Maths has also been identified as a national skill shortages priority area.

There are worrying signs students are not receiving the maths education they need. Aaron Lefler/ Unsplash, CC BY

What do we do about this?

There have been repeated efforts to address teacher shortages,including trying to retain existing mathematics teachers, having specialist teachers teaching across multiple schools and higher salaries. There is also a push to train more teachers from scratch, which of course will take many years to implement.

There is one strategy, however, that has not yet been given much attention by policy makers: upgrading current teachers’ maths and statistics knowledge and their skills in how to teach these subjects.

They already have training and expertise in how to teach and a commitment to the profession. Specific training in maths will mean they can move from being out-of-field to “in-field”.

How to give teachers this training

A new report commissioned by mathematics and statistics organisations in Australia (including the Australian Mathematical Sciences Institute) looks at what is currently available in Australia to train teachers in maths.

It identified 12 different courses to give existing teachers maths teaching skills. They varied in terms of location, duration (from six months to 18 months full-time) and aims.

For example, some were only targeted at teachers who want to teach maths in the junior and middle years of high school. Some taught university-level maths and others taught school-level maths. Some had government funding support; others could cost students more than A$37,000.

Overall, we found the current system is confusing for teachers to navigate. There are complex differences between states about what qualifies a teacher to be “in-field” for a subject area.

In the current incentive environment, we found these courses cater to a very small number of teachers. For example, in 2024 in New South Wales this year there are only about 50 government-sponsored places available.

This is not adequate. Pre-COVID, it was estimated we were losing more than 1,000 equivalent full-time maths teachers per year to attrition and retirement and new graduates were at best in the low hundreds.

But we don’t know exactly how many extra teachers need to be trained in maths. One of the key recommendations of the report is for accurate national data of every teacher’s content specialisations.

We need a national approach

The report also recommends a national strategy to train more existing teachers to be maths teachers. This would replace the current piecemeal approach.

It would involve a standard training regime across Australia with government and school-system incentives for people to take up extra training in maths.

There is international evidence to show a major upskilling program like this could work.

In Ireland, where the same problem was identified, the government funds a scheme run by a group of universities. Since 2012, teachers have been able to get a formal qualification (a professional diploma). Between 2009 and 2018 the percentage of out-of-field maths teaching in Ireland dropped from 48% to 25%.

To develop a similar scheme here in Australia, we would need coordination between federal and state governments and universities. Based on the Irish experience, it would also require several million dollars in funding.

But with students receiving crucial maths lessons every day by teachers who are not trained to teach maths, the need is urgent.

The report mentioned in this article was commissioned by the Australian Mathematical Sciences Institute, the Australian Mathematical Society, the Statistical Society of Australia, the Mathematics Education Research Group of Australasia and the Actuaries Institute.

For more such insights, log into our website https://international-maths-challenge.com

Credit of the article given to Monstera Production/ Pexels , CC BY


Wrappers delight: The Easter egg equation you never knew you needed

This Easter season, as you tear open those chocolate eggs, have you ever wondered why they’re snugly wrapped in foil? Turns out the answer lies within the easter egg equation.

Mathematician Dr. Saul Schleimer, from the University of Warwick, sheds light on the delightful connection between Easter egg wrapping and mathematical curvature.

“When you wrap an egg with foil, there are always wrinkles in the foil. This doesn’t happen when you wrap a box. The reason is that foil has zero Gaussian curvature (a measure of flatness), while an egg has (variable) positive curvature. Perfect wrapping (without wrinkles) requires that the curvatures match,” explains Professor Schleimer.

So, unlike flat surfaces, eggs have variable positive curvature, making them challenging to wrap without creases or distortions. Foil, with its flat surface and zero Gaussian curvature, contrasts sharply with the egg’s curved shape.

Attempting to wrap an egg with paper, which also lacks the required curvature, would result in unsightly wrinkles and a less-than-ideal presentation. Therefore, by using tin foil, we can harmonize the egg’s curvature with the wrapping material, achieving a snug fit without compromising its shape, thus showcasing the delightful intersection of mathematics and Easter traditions.

For more such insights, log into our website https://international-maths-challenge.com

Credit of the article given to University of Warwick


‘I had such fun!’, says winner of top math prize

For Michel Talagrand, who won the Abel mathematics prize on Wednesday, math provided a fun life free from all constraints—and an escape from the eye problems he suffered as a child.

“Math, the more you do it, the easier it gets,” the 72-year-old said in an interview with AFP.

He is the fifth French Abel winner since the award was created by Norway’s government in 2003 to compensate for the lack of a Nobel prize in mathematics.

Talagrand’s career in functional analysis and probability theorysaw him tame some of the incredibly complicated limits of random behaviour.

But the mathematician said he had just been “studying very simple things by understanding them absolutely thoroughly.”

Talagrand said he was stunned when told by the Norwegian Academy of Science and Letters that he had won the Abel prize.

“I did not react—I literally didn’t think for at least five seconds,” he said, adding that he was very happy for his wife and two children.

Fear of going blind

When he was young, Talagrand only turned to math “out of necessity,” he said.

By the age of 15, he had endured multiple retinal detachments and “lived in terror of going blind”.

Unable to run around with friends in Lyon, Talagrand immersed himself in his studies.

His father had a math degree and so he followed the same path. He said he was a “mediocre” student in other areas.

Talagrand was particularly poor at spelling, and still lashes out at what he calls its “arbitrary rules”.

Especially in comparison to math, which has “an order in which you do well if you are sensitive to it,” he said.

In 1974, Talagrand was recruited by the French National Centre for Scientific Research (CNRS), before getting a Ph.D. at Paris VI University.

He spent a decade studying functional analysis before finding his “thing”: probability.

It was then that Talagrand developed his influential theory about “Gaussian processes,” which made it possible to study some random phenomena.

Australian mathematician Matt Parker said that Talagrand had helped tame these “complicated random processes”.

Physicists had previously developed theories on the limits of how randomness behaves, but Talagrand was able to use mathematics to prove these limits, Parker said on the Abel Prize website.

‘Monstrously complicated’

“In a sense, things are as simple as could be—whereas mathematical objects can be monstrously complicated,” Talagrand said.

His work deepening the understanding of random phenomena “has become essential in today’s world,” the CNRS said, citing algorithms which are “the basis of our weather forecasts and our major linguistic models”.

Rather than creating a “brutal transformation”, Talagrand considers his discoveries as a collective work he compared to “the construction of a cathedral in which everyone lays a stone”.

He noted that French mathematics had been doing well an elite level, notching up both Abel prizes and Fields medals—the other equivalent to a math Nobel, which is only awarded to mathematicians under 40.

“But the situation is far less brilliant in schools,” where young people are increasingly less attracted to the discipline, he lamented.

The new Abel winner admitted that math can be daunting at first, but re-emphasized his belief that it gets easier the more you do it.

He advised aspiring mathematicians not to worry about failure.

“You can fail to solve a problem 10 times—but that doesn’t matter if you succeed on the 11th try,” he said.

It can also be hard work.

“All my life I worked to the point of exhaustion—but I had such fun!” he said.

“With math, you have all the resources within yourself. You work without any constraints, free from concerns about money or bosses,” he added.

“It’s marvelous.”

Talagrand will receive his prize, including a 7.5-million-kroner ($705,000) check, in Oslo on May 21.

For more such insights, log into our website https://international-maths-challenge.com

Credit of the article given to Juliette Collen


Ice-ray patterns: A rediscovery of past design for the future

Chinese ice-ray lattice, or “binglie” as it is called in Chinese, is an intricate pattern that looks like cracked ice and is a common decorative element used in traditional Chinese window designs.

Originally inspired by fragmented patterns on ice or crackle-glazed ceramic surfaces, the design represents the melting of the ice and the beginning of a thriving spring.

When Dr. Iasef Md Rian, now an Associate Professor at Xi’an Jiaotong-Liverpool University’s Department of Architecture, arrived in China for the first time in 2019, he was immediately captivated by the latticed window designs in the classical gardens of Suzhou.

“Classical gardens in China strike me as very different from the Western ones, which are more symmetrical and organized,” he says. “Chinese gardens, however, have a more natural formation in their layout and design. The ice-ray window design is one of the manifestations.”

Having focused on fractal geometry in architectural design for many years, Dr. Rian felt an urge to explore the beauty in the patterns.

“My mind is always looking for this kind of inspiration source, so I was motivated right away to study the underlying geometric principles of the ice-ray patterns, he says.”


Revealing the underlying rule

Dr. Rian finds that the rule of creating ice-ray patterns is actually very simple.

He explains, “Take Type 1 as an example; a square is first divided into two quadrilaterals, and then each quadrilateral is further divided into two quadrilaterals. In each step, the proportions of the subdivided quadrilaterals are different, and this is how the random pattern is created using a simple rule.

“Through this configuration, Chinese craftsmen might have intended to increase its firmness so it can function as a window fence to provide protection. The random configuration of ice-ray lattices provides multi-angled connections, which transform the window into a collection of resultant forces and uniform stress distribution, in turn achieving a unique degree of stiffness.

“The microstructure of trabecular bone tissue in our own bodies serves as an excellent natural example of the potential of random lattices. It balances high stiffness, which contributes to strength, with a surprisingly lightweight structure.”

Dr. Rian recently published a paper in Frontiers of Architectural Research that explores the geometric qualities of ice-ray patterns and expands the possibilities of integrating random patterns into structural designs, especially the lattice shell design, which is often used in spherical domes and curved structures.

“In my research, I developed an algorithm to model the ice-ray patterns for lattice shell designs and assessed their feasibility and effectiveness compared to conventional gridshells. These gridshells, made from regular grids, contrast with continuous shells.

“While regular gridshells perform well under uniform loads, the ice-ray lattice offers strength under asymmetric loads. Some ice-ray patterns, resulting from optimization, surprisingly provide better strength than regular gridshells under self-weight. There is also an additional aesthetic advantage when applying the ice-ray pattern to a lattice shell design.

“I extend the application of this pattern to curved surfaces, which helps to unlock its potential in the geometric, structural, and constructional aspects of lattice shell design,” he says.

Dr. Rian has also integrated ice-ray patterns and complex geometries into his teaching. In 2022, he organized a workshop for students to design ice-ray lattice roofs.

He explains that learning the concept of fractal geometry can really push the students’ ideas toward a unique design.

“This is very different from what they’ve learned in high school. In learning to create this geometry system, they will also learn computational modeling and simulations. In the end, they’ll get comprehensive knowledge of advanced architectural and digital design,” he says.

Rediscovering traditional designs

To extend the research in this field, Dr. Rian is investigating the effectiveness of complex geometry in various aspects like micro-scale material design and structural design.

He says, “For instance, in facade design, we usually use conventional or parametric geometry to design regular shapes. However, the random shapes designed with complex geometry can offer a more natural impression and daylight penetration.”

He encourages design students and researchers to learn from the past.

“Any traditional design has a hidden rule in it. We can now use digital technologies and advanced tools to extend and expand the knowledge of traditional craftsmanship for contemporary design.

“There are many inspirations behind the traditional designs, and those principles can really inspire us designers to make innovative designs for the future,” he says.


For more such insights, log into our website https://international-maths-challenge.com

Credit of the article given to Yi Qian, Xi’an jiaotong-Liverpool University


Why 2024 Abel Prize Winner Michel Talagrand Became A Mathematician

After losing an eye at the age of 5, the 2024 Abel prize winner Michel Talagrand found comfort in mathematics.

French mathematician Michel Talagrand has won the 2024 Abel prize for his work on probability theory and describing randomness. Shortly after he had heard the news, New Scientist spoke with Talagrand to learn more about his mathematical journey.

Alex Wilkins: What does it mean to win the Abel prize?

Michel Talagrand: I think everybody would agree that the Abel prize is really considered like the equivalent of the Nobel prize in mathematics. So it’s something for me totally unexpected, I never, ever dreamed I would receive this prize. And actually, it’s not such an easy thing to do, because there is this list of people who already received it. And on that list, they are true giants of mathematics. And it’s not such a comfortable feeling to sit with them, let me tell you, because it’s clear that their achievements are on an entirely other scale than I am.

What are your attributes as a mathematician?

I’m not able to learn mathematics easily. I have to work. It takes a very long time and I have a terrible memory. I forget things. So I try to work, despite handicaps, and the way I worked was trying to understand really well the simple things. Really, really well, in complete detail. And that turned out to be a successful approach.

Why does maths appeal to you?

Once you are in mathematics, and you start to understand how it works, it’s completely fascinating and it’s very attractive. There are all kinds of levels, you are an explorer. First, you have to understand what people before you did, and that’s pretty challenging, and then you are on your own to explore, and soon you love it. Of course, it is extremely frustrating at the same time. So you have to have the personality that you will accept to be frustrated.

But my solution is when I’m frustrated with something, I put it aside, when it’s obvious that I’m not going to make any more progress, I put it aside and do something else, and I come back to it at a later date, and I have used that strategy with great efficiency. And the reason why it succeeds is the function of the human brain, things mature when you don’t look at them. There are questions which I’ve literally worked on for a period of 30 years, you know, coming back to them. And actually at the end of the 30 years, I still made progress. That’s what is incredible.

How did you get your start?

Now, that’s a very personal story. First, it helps that my father was a maths teacher, and of course that helped. But really, the determining factor is I was unlucky to have been born with a deficiency in my retinas. And I lost my right eye when I was 5 years old. I had multiple retinal detachments when I was 15. I stayed in the hospital a long time, I missed school for six months. And that was extremely traumatic, I lived in constant terror that there will be a next retinal detachment.

To escape that, I started to study. And my father really immensely helped me, you know, when he knew how hard it was, and when I was in hospital, he came to see me every day and he started talking about some simple mathematics, just to keep my brain functioning. I started studying hard mathematics and physics to really, as I say, to fight the terror and, of course, when you start studying, then you become good at it and once you become good, it’s very appealing.

What is it like to be a professional mathematician?

Nobody tells me what I have to do and I’m completely free to use my time and do what I like. That fitted my personality well, of course, and it’s helped me to devote myself totally to my work.

For more such insights, log into www.international-maths-challenge.com.

*Credit for article given to Alex Wilkins*


What’s Pi Day all about? Math, science, pies and more

Math enthusiasts around the world, from college kids to rocket scientists, celebrate Pi Day on Thursday, which is March 14 or 3/14—the first three digits of an infinite number with many practical uses.

Around the world many people will mark the day with a slice of pie—sweet, savory or even pizza.

Simply put, pi is a mathematical constant that expresses the ratio of a circle’s circumference to its diameter. It is part of many formulas used in physics, astronomy, engineering and other fields, dating back thousands of years to ancient Egypt, Babylon and China.

Pi Day itself dates to 1988, when physicist Larry Shaw began celebrations at the Exploratorium science museum in San Francisco. The holiday didn’t really gain national recognition though until two decades later. In 2009, Congress designated every March 14 to be the big day—to hopefully spur more interest in math and science. Fittingly enough, the day is also Albert Einstein’s birthday.

Here’s a little more about the holiday’s origin and how it’s celebrated today.

WHAT IS PI?

Pi can calculate the circumference of a circle by measuring the diameter—the distance straight across the circle’s middle—and multiplying that by the 3.14-plus number.

It is considered a constant number and it is also infinite, meaning it is mathematically irrational. Long before computers, historic scientists such as Isaac Newton spent many hours calculating decimal places by hand. Today, using sophisticated computers, researchers have come up with trillions of digits for pi, but there is no end.

WHY IS IT CALLED PI?

It wasn’t given its name until 1706, when Welsh mathematician William Jones began using the Greek symbol for the number.

Why that letter? It’s the first Greek letter in the words “periphery” and “perimeter,” and pi is the ratio of a circle’s periphery—or circumference—to its diameter.

WHAT ARE SOME PRACTICAL USES?

The number is key to accurately pointing an antenna toward a satellite. It helps figure out everything from the size of a massive cylinder needed in refinery equipment to the size of paper rolls used in printers.

Pi is also useful in determining the necessary scale of a tank that serves heating and air conditioning systems in buildings of various sizes.

NASA uses pi on a daily basis. It’s key to calculating orbits, the positions of planets and other celestial bodies, elements of rocket propulsion, spacecraft communication and even the correct deployment of parachutes when a vehicle splashes down on Earth or lands on Mars.

Using just nine digits of pi, scientists say it can calculate the Earth’s circumference so accurately it only errs by about a quarter of an inch (0.6 centimeters) for every 25,000 miles (about 40,000 kilometers).

IT’S NOT JUST MATH, THOUGH

Every year the San Francisco museum that coined the holiday organizes events, including a parade around a circular plaque, called the Pi Shrine, 3.14 times—and then, of course, festivities with lots of pie.

Around the country, many events now take place on college campuses. For example, Nova Southeastern University in Florida will hold a series of activities, including a game called “Mental Math Bingo” and event with free pizza (pies)—and for dessert, the requisite pie.

“Every year Pi Day provides us with a way to celebrate math, have some fun and recognize how important math is in all our lives,” said Jason Gershman, chair of NSU’s math department.

At Michele’s Pies in Norwalk, Connecticut, manager Stephen Jarrett said it’s one of their biggest days of the year.

“We have hundreds of pies going out for orders (Thursday) to companies, schools and just individuals,” Jarrett said in an interview. “Pi Day is such a fun, silly holiday because it’s a mathematical number that people love to turn into something fun and something delicious. So people celebrate Pi Day with sweet pies, savory pies, and it’s just an excuse for a little treat.”

NASA has its annual “Pi Day Challenge” online, offering people plenty of games and puzzles, some of them directly from the space agency’s own playbook such as calculating the orbit of an asteroid or the distance a moon rover would need to travel each day to survey a certain lunar area.

WHAT ABOUT EINSTEIN?

Possibly the world’s best-known scientist, Einstein was born on March 14, 1879, in Germany. The infinite number of pi was used in many of his breakthrough theories and now Pi Day gives the world another reason to celebrate his achievements.

In a bit of math symmetry, famed physicist Stephen Hawking died on March 14, 2018, at age 76. Still, pi is not a perfect number. He once had this to say,

“One of the basic rules of the universe is that nothing is perfect. Perfection simply doesn’t exist. Without imperfection, neither you nor I would exist.”


For more such insights, log into our website https://international-maths-challenge.com

Credit of the article given to Curt Anderson


Paper offers a mathematical approach to modeling a random walker moving across a random landscape

Tiny particles like pollen grains move constantly, pushed and pulled by environmental forces. To study this motion, physicists use a “random walk” model—a system in which every step is determined by a random process. Random walks are useful for studying everything from tiny physics to diffusion to financial markets.

But what if the environment itself—and not just the walker—is random? “We can think of a town in which the elevation undulates in a random way, with the walker more likely to step downhill rather than uphill,” says physicist and SFI Professor Sidney Redner.

A fundamental question in this scenario, he says, is to determine the time for the system to move from one arbitrary point to another. This quantity is called the “first-passage time,” and researchers have solved it in one dimension, albeit using cumbersome calculations.

In a paper published in Physical Review E, Redner, together with SFI Program Postdoctoral Fellow James Holehouse, introduced a new way to efficiently determine all possible first-passage times and their probabilities. Their approach, which relies on heady math, captures the randomness of both the walker and the environment.

In the paper, they describe how to compute a “moment generating function”—a kind of mathematical machine for providing complete statistical information about the distribution of first-passage times.

Their approach could improve predictive analyses in a wide range of processes influenced by randomness, from changing biological populations to migration systems to the dynamics of financial instruments used to study markets. It builds on ideas that Redner first described in his 2001 book “A Guide to First Passage Processes” (and for which he’s preparing a second edition.)

Researchers typically approach first-passage problems using enormous simulations, which start with initial systems and run through time to predict the time to reach a certain state. “But simulations are a really poor way to study [these systems],” Holehouse says.

Redner adds, “If you simulate some of these systems, you’re guaranteed to get the wrong answer because you need to simulate so many instances of the system that to see the right answer would require a computation time that is beyond the age of the universe.”

For more such insights, log into our website https://international-maths-challenge.com

Credit of the article given to Santa Fe Institute


How do neural networks learn? A mathematical formula explains how they detect relevant patterns

Neural networks have been powering breakthroughs in artificial intelligence, including the large language models that are now being used in a wide range of applications, from finance, to human resources to health care. But these networks remain a black box whose inner workings engineers and scientists struggle to understand.

Now, a team led by data and computer scientists at the University of California San Diego has given neural networks the equivalent of an X-ray to uncover how they actually learn.

The researchers found that a formula used in statistical analysis provides a streamlined mathematical description of how neural networks, such as GPT-2, a precursor to ChatGPT, learn relevant patterns in data, known as features. This formula also explains how neural networks use these relevant patterns to make predictions.

“We are trying to understand neural networks from first principles,” said Daniel Beaglehole, a Ph.D. student in the UC San Diego Department of Computer Science and Engineering and co-first author of the study. “With our formula, one can simply interpret which features the network is using to make predictions.”

The team present their findings in the journal Science.

Why does this matter? AI-powered tools are now pervasive in everyday life. Banks use them to approve loans. Hospitals use them to analyse medical data, such as X-rays and MRIs. Companies use them to screen job applicants. But it’s currently difficult to understand the mechanism neural networks use to make decisions and the biases in the training data that might impact this.

“If you don’t understand how neural networks learn, it’s very hard to establish whether neural networks produce reliable, accurate, and appropriate responses,” said Mikhail Belkin, the paper’s corresponding author and a professor at the UC San Diego Halicioglu Data Science Institute. “This is particularly significant given the rapid recent growth of machine learning and neural net technology.”

The study is part of a larger effort in Belkin’s research group to develop a mathematical theory that explains how neural networks work. “Technology has outpaced theory by a huge amount,” he said. “We need to catch up.”

The team also showed that the statistical formula they used to understand how neural networks learn, known as Average Gradient Outer Product (AGOP), could be applied to improve performance and efficiency in other types of machine learning architectures that do not include neural networks.

“If we understand the underlying mechanisms that drive neural networks, we should be able to build machine learning models that are simpler, more efficient and more interpretable,” Belkin said. “We hope this will help democratize AI.”

The machine learning systems that Belkin envisions would need less computational power, and therefore less power from the grid, to function. These systems also would be less complex and so easier to understand.

Illustrating the new findings with an example

(Artificial) neural networks are computational tools to learn relationships between data characteristics (i.e. identifying specific objects or faces in an image). One example of a task is determining whether in a new image a person is wearing glasses or not. Machine learning approaches this problem by providing the neural network many example (training) images labeled as images of “a person wearing glasses” or “a person not wearing glasses.”

The neural network learns the relationship between images and their labels, and extracts data patterns, or features, that it needs to focus on to make a determination. One of the reasons AI systems are considered a black box is because it is often difficult to describe mathematically what criteria the systems are actually using to make their predictions, including potential biases. The new work provides a simple mathematical explanation for how the systems are learning these features.

Features are relevant patterns in the data. In the example above, there are a wide range of features that the neural networks learns, and then uses, to determine if in fact a person in a photograph is wearing glasses or not.

One feature it would need to pay attention to for this task is the upper part of the face. Other features could be the eye or the nose area where glasses often rest. The network selectively pays attention to the features that it learns are relevant and then discards the other parts of the image, such as the lower part of the face, the hair and so on.

Feature learning is the ability to recognize relevant patterns in data and then use those patterns to make predictions. In the glasses example, the network learns to pay attention to the upper part of the face. In the new Science paper, the researchers identified a statistical formula that describes how the neural networks are learning features.

Alternative neural network architectures: The researchers went on to show that inserting this formula into computing systems that do not rely on neural networks allowed these systems to learn faster and more efficiently.

“How do I ignore what’s not necessary? Humans are good at this,” said Belkin. “Machines are doing the same thing. Large Language Models, for example, are implementing this ‘selective paying attention’ and we haven’t known how they do it. In our Science paper, we present a mechanism explaining at least some of how the neural nets are ‘selectively paying attention.'”

For more such insights, log into our website https://international-maths-challenge.com

Credit of the article given to University of California – San Diego


Drawings of mathematical problems predict their resolution

A team from the University of Geneva (UNIGE), in collaboration with CY Cergy Paris University (CYU) and University of Burgundy (uB), have analysed drawings made by children and adults when solving simple problems. The scientists found that, whatever the age of the participant, the most effective calculation strategies were associated with certain drawing typologies.

These results, published in the journal Memory & Cognition, open up new perspectives for the teaching of mathematics.

Learning mathematics often involves small problems, linked to concrete everyday situations. For example, pupils have to add up quantities of flour to make a recipe or subtract sums of money to find out what’s left in their wallets after shopping. They are thus led to translate statements into algorithmic procedures to find the solution.

This translation of words into solving strategies involves a stage of mental representation of mathematical information, such as numbers or the arithmetic operation to be performed, and non-mathematical information, such as the context of the problem.

The cardinal or ordinal dimensions of problems

Having a clearer idea of these mental representations would enable a better understanding of the choice of calculation strategies. Scientists from UNIGE, CYU and uB conducted a study with 10-year-old children and adults, asking them to solve simple problems with the instruction to use as few calculation steps as possible.

The participants were then asked to produce a drawing or diagram explaining their problem-solving strategy for each statement. The contexts of some problems called on the cardinal properties of numbers—the quantity of elements in a set—others on their ordinal properties—their position in an ordered list.

The former involved marbles, fishes, or books, for example: “Paul has 8 red marbles. He also has blue marbles. In total, Paul has 11 marbles. Jolene has as many blue marbles as Paul, and some green marbles. She has 2 green marbles less than Paul has red marbles. In total, how many marbles does Jolene have?”

The latter involved lengths or durations, for example: “Sofia traveled for 8 hours. Her trip started during the day. Sofia arrived at 11. Fred leaves at the same time as Sofia. Fred’s trip lasted 2 hours less than Sofia’s. What time was it when Fred arrived?”

Both of the above problems share the same mathematical structure, and both can be solved by a long strategy in 3 steps: 11–8 = 3; 8–2 = 6; 6 + 3 = 9, but also in a single calculation: 11–2 = 9, using a simple subtraction. However, the mental representations of these problems are very different, and the researchers wanted to determine whether the type of representations could predict the calculation strategy, in 1 or 3 steps, of those who solve them.

‘”Our hypothesis was that cardinal problems—such as the one involving marbles—would inspire cardinal drawings, i.e., diagrams with identical individual elements, such as crosses or circles, or with overlaps of elements in sets or subsets.

“Similarly, we assumed that ordinal problems—such as the one mentioning travel times—would lead to ordinal representations, i.e., diagrams with axes, graduations or intervals—and that these ordinal drawings would reflect participants’ representations and indicate that they would be more successful in identifying the one-step solution strategy,” explains Hippolyte Gros, former post-doctoral fellow at UNIGE’s Faculty of Psychology and Educational Sciences, associate professor at CYU, and first author of the study.

Identifying mental representations through drawings

These hypotheses were validated by analysing the drawings of 52 adults and 59 children. “We have shown that, irrespective of their experience—since the same results were obtained in both children and adults—the use of strategies by the participants depends on their representation of the problem, and that this is influenced by the non-mathematical information contained in the problem statement, as revealed by their drawings,” says Emmanuel Sander, full professor at the UNIGE’s Faculty of Psychology and Educational Sciences.

“Our study also shows that, even after years of experience in solving addition and subtraction, the difference between cardinal and ordinal problems remains very marked. The majority of participants were only able to solve problems of the second type in a single step.”

Improving mathematical learning through drawing analysis

The team also noted that drawings showing ordinal representations were more frequently associated with a one-step solution, even if the problem was cardinal. In other words, drawing with a scale or an axis is linked to the choice of the fastest calculation.

“From a pedagogical point of view, this suggests that the presence of specific features in a student’s drawing may or may not indicate that his or her representation of the problem is the most efficient one for meeting the instructions—in this case, solving with the fewest calculations possible,” observes Jean-Pierre Thibaut, full professor at the uB Laboratory for Research on Learning and Development.

“Thus, when it comes to subtracting individual elements, a representation via an axis—rather than via subsets—is more effective in finding the fastest method. Analysis of students’ drawings in arithmetic can therefore enable targeted intervention to help them translate problems into more optimal representations. One way of doing this is to work on the graphical representation of statements in class, to help students understand the most direct strategies,” concludes Gros.

For more such insights, log into our website https://international-maths-challenge.com

Credit of the article given to University of Geneva.