Homeschooled children don’t always get a well-rounded curriculum. miniseries via Getty Images
Homeschooling is the fastest-growing education setting in the United States. More than 3 million students were educated at home in the 2021-22 school year, up from 2.5 million in the spring of 2019. Current estimates from the U.S. Census Bureau indicate that there are 3.62 million students homeschooled in the United States. That’s a meteoric increase from about 1 million in 1997.
Some experts, including Harvard law professor Elizabeth Bartholet, find the increase a cause to call for greater regulation. University of Washington education policy professor David Knight agrees, citing a lack of accountability and measures of student progress. Knight also worries about an absence of certain disciplines such as social studies that public schools are required to teach.
For those of us who have researched the homeschool movement and studied its past, these are not new concerns. So, what do we know about homeschooling and preparedness for college?
Data shows homeschooled students fare well
In 2020, we reviewed the evidence about how well homeschooling prepares people for college, career and life and published what we learned in a book chapter titled: “Life after Homeschool.”
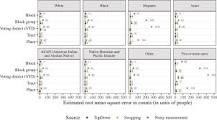
We found evidence that homeschooled students are just as prepared academically for higher education as traditionally schooled peers. In one study, researchers drew a sample of 825,672 students – including 732 students who had been homeschooled – and found the homeschooled group scored higher on several measures of college preparedness, including the SAT and first-year GPA in college.
Ave Maria University education professor Marc Snyder came to similar results in a 2013 study. Snyder compared homeschooled and traditional students at his Catholic university in Florida to find the average ACT scores for homeschooled students was 26. Public school students averaged 24.22, and students who attended Catholic schools averaged 24.53.
Snyder’s study reinforces data from the ACT itself. The testing outlet reported that from 2001-2019, the average ACT scores for homeschooled students trended up, while public school students’ scores declined slightly. In 2023, the national average on the ACT was 19.9; the average for homeschoolers was 22.8.
Areas of concern abound as homeschool growth accelerates
Still, calls for regulation persist because of a host of challenges homeschooled students present. The Coalition for Responsible Home Education wants states to require minimal qualifications of a high school diploma or GED for the parent providing primary instruction, instruction for students in the same subjects as in public schools, and annual standardized assessments. In some states, they note, parents don’t even have to tell their local school district of their intent to homeschool.
The pro-regulation side points to studies showing homeschooled students feel less prepared for college and are four times less likely to go to college after high school. Homeschool students also take an average of one fewer math and science course than traditional peers.
Homeschooled students also often lack resources and guidance provided in traditional high schools for college prep. And social challenges abound when these students transition; a study of seven homeschooled graduates in Pennsylvania found students struggling to maintain their existing moral beliefs related to drinking, drug use and sexual norms, with the majority admitting they changed some beliefs and practices.
There’s also data that shows homeschooled students find the more structured academic environment on university campuses to be difficult to adjust to after a more lax experience learning at home.
Still, efforts to regulate homeschooling face opposition from parents as well as advocacy groups such as the Home School Legal Defense Association. In March 2024, for example, these forces defeated an attempt in New Hampshire to require homeschool students to take a statewide exam.
3 ways to improve homeschooling
To help homeschooled students transition to college, we recommend parents take three steps to better prepare their kids.
- Prioritize math and scienceto help address the math and science gap. Parents can use online courses offered through virtual high schools or employ tutors.
- Enroll in dual-credit or community college coursesto provide a taste of the structure of college life and to interact with peers from diverse backgrounds.
- Talk to children about the diversity of perspectivesthey will encounter at college. This can help prepare them for how to negotiate and respect the opinions of others.
Homeschooled students can successfully transition to college and compete with their peers. The challenges they face are entirely foreseeable, which means they can be addressed easily.
For more such insights, log into our website https://international-maths-challenge.com
Credit of the article given to The Conversation