Researchers find classical musical compositions adhere to power law

A team of researchers, led by Daniel Levitin of McGill University, has found after analysing over two thousand pieces of classical music that span four hundred years of history, that virtually all of them follow a one-over-f (1/f) power distribution equation. He and his team have published the results of their work in the Proceedings of the National Academy of Sciences.

One-over-f equations describe the relative frequency of things that happen over time and can be used to describe such naturally occurring events as annual river flooding or the beating of a human heart. They have been used to describe the way pitch is used in music as well, but until now, no one has thought to test the idea that they could be used to describe the rhythm of the music too.

To find out if this is the case, Levitin and his team analysed (by measuring note length line by line) close to 2000 pieces of classical music from a wide group of noted composers. In so doing, they found that virtually every piece studied conformed to the power law. They also found that by adding another variable to the equation, called a beta, which was used to describe just how predictable a given piece was compared to other pieces, they could solve for beta and find a unique number for each composer.

After looking at the results as a whole, they found that works written by some classical composers were far more predictable than others, and that certain genres in general were more predictable than others too. Beethoven was the most predictable of the group studied, while Mozart was the least of the bunch. And symphonies are generally far more predictable than Ragtimes with other types falling somewhere in-between. In solving for beta, the team discovered that they had inadvertently developed a means for calculating a composer’s unique individual rhythm signature. In speaking with the university news group at McGill, Levitin said, “this was one of the most unanticipated and exciting findings of our research.”

Another interesting aspect of the research is that because the patterns are based on the power law, the music the team studied shares the same sorts of patterns as fractals, i.e. elements in the rhythm that occur the second most often happen only half as often, the third, just a third as often and so forth. Thus, it’s not difficult to imagine music in a fractal patterns that are unique to individual composers.

For more such insights, log into our website https://international-maths-challenge.com

Credit of the article given to Bob Yirka , Phys.org


Good at Sudoku? Here’s some you’ll never complete

Last month, a team led by Gary McGuire from University College Dublin in Ireland made an announcement: they had proven you can’t have a solvable Sudoku puzzle with less than 17 numbers already filled in.

Unlike most mathematical announcements, this was quickly picked up by the popular scientific media. Within a few days, the new finding had been announced in Nature and other outlets.

So where did this problem come from and why is its resolution interesting.

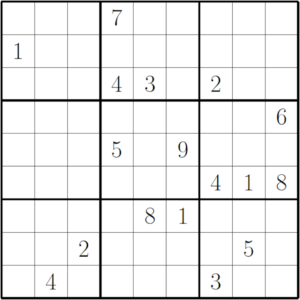
As you probably know, the aim of a Sudoku puzzle is to complete a partially-filled nine-by-nine grid of numbers. There are some guidelines: the numbers one to nine must appear exactly once each in every row, column and three-by-three sub-grid.

As with a crossword, a valid Sudoku puzzle must have a unique solution. There’s only one way to go from the initial configuration (with some numbers already filled in) to a completed grid.

Newspapers often grade their puzzles as easy, medium or hard, which will depend on how easy it is at every stage of solving the puzzle to fill in the “next” number. While a puzzle with a huge number of initial clues will usually be easy, it is not necessarily the case that a puzzle with few initial clues is difficult.

Reckon you can complete a 17-clue Sudoku puzzle? (answer below) Gordon Royle

When Sudoku-mania swept the globe in the mid-2000s, many mathematicians, programmers and computer scientists – amateur and professional – started to investigate Sudoku itself. They were less interested in solving individual puzzles, and more focused on asking and answering mathematical and/or computational questions about the entire universe of Sudoku puzzles and solutions.

As a mathematician specialising in the area of combinatorics (which can very loosely be defined as the mathematics of counting configurations and patterns), I was drawn to combinatorial questions about Sudoku.

I was particularly interested in the question of the smallest number of clues possible in a valid puzzle (that is, a puzzle with a unique solution).

In early 2005, I found a handful of 17-clue puzzles on a long-since forgotten Japanese-language website. By slightly altering these initial puzzles, I found a few more, then more, and gradually built up a “library” of 17-clue Sudoku puzzles which I made available online at the time.

Other people started to send me their 17-clue puzzles and I added any new ones to the list until, after a few years, I had collected more than 49,000 different 17-clue Sudoku puzzles.

By this time, new ones were few and far between, and I was convinced we had found almost all of the 17-clue puzzles. I was also convinced there was no 16-clue puzzle. I thought that demonstrating this would either require some new theoretical insight or clever programming combined with massive computational power, or both.

Either way, I thought proving the non-existence of a 16-clue puzzle was likely to be too difficult a challenge.

They key to McGuire’s approach was to tackle the problem indirectly. The total number of completed puzzles (that is, completely filled-in grids) is astronomical – 5,472,730,538 – and trying to test each of these to see if any choice of 16 cells from the completed grid forms a valid puzzle is far too time-consuming.

Instead, McGuire and colleagues used a different, indirect approach.

An “unavoidable set” in a completed Sudoku grid is a subset of the clues whose entries can be rearranged to leave another valid completed Sudoku grid. For a puzzle to be uniquely completable, it must contain at least one entry from every unavoidable set.

See the picture below to see what I mean.

If a completed grid contains the ten-clue configuration in the left picture, then any valid Sudoku puzzle must contain at least one of those ten clues. If it did not, then in any completed puzzle, those ten positions could either contain the left-hand configuration or the right-hand configuration and so the solution would not be unique.

Gordon Royle

While finding all the unavoidable sets in a given grid is difficult, it’s only necessary to find enough unavoidable sets to show that no 16 clues can “hit” them all. In the process of resolving this question, McGuire’s team developed new techniques for solving the “hitting set” problem.

It’s a problem that has many other applications – any situation in which a small set of resources must be allocated while still ensuring that all needs are met by at least one of the selected resources (i.e. “hit”) can be modelled as a hitting set problem.

Once the theory and software was in place, it was then a matter of running the programs for each of the 5.5 billion completed grids. As you can imagine, this required substantial computing power.

After 7 million core-CPU hours on a supercomputer (the equivalent of a single computer running for 7 million hours) and a year of actual elapsed time, the result was announced a few weeks ago, on New Year’s Day.

So is it correct?

The results of any huge computation should be evaluated with some caution, if not outright suspicion, especially when the answer is simply “no, doesn’t exist”, because there are many possible sources of error.

But in this case, I feel the result is far more likely to be correct than otherwise, and I expect it to be independently-verified before too long. In addition, McGuire’s team built on many different ideas, discussions and computer programs that were thrashed out between interested contributors to various online forums devoted to the mathematics of Sudoku. In this respect, many of the basic components of their work have already been thoroughly tested.

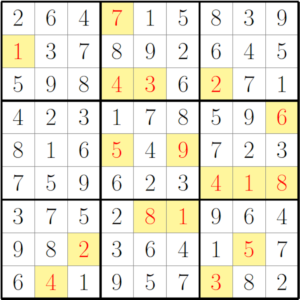
Solution to the 17-clue Sudoku puzzle, above. Gordon Royle

And so back to the question: why is the resolution of this problem interesting? And is it important?

Certainly, knowing that the smallest Sudoku puzzles have 17 clues is not in itself important. But the immense popularity of Sudoku meant that this question was popularised in a way that many similar questions have never been, and so it took on a special role as a “challenge question” testing the limits of human knowledge.

The school students to whom I often give outreach talks have no real concept of the limitations of computers and mathematics. In my past talks, these students were almost always astonished to know that the answer to such a simple question was just not known.

And now, in my future outreach talks, I will describe how online collaboration, theoretical development and significant computational power were combined to solve this problem, and how this process promises to play an increasing role in the future development of mathematics.

For more such insights, log into our website https://international-maths-challenge.com

Credit of the article given to Gordon Royle, The University of Western Australia


Putting the magic into maths

Queen Mary, University of London has developed a new educational resource for teachers to help students use amazing magic tricks to learn about maths.

The web resource (www.mathematicalmagic.com), which includes the ‘Manual for Mathematical Magic’ and a series of interactive videos, was led by Queen Mary’s Professor Peter McOwan with the help of the College’s resident stand-up comedian Matt Parker and semi-professional magician and maths teacher Jason Davison.

Professor McOwan said: “It was great fun to be able to work with Matt and Jason on these new videos, showing how maths and magic can fuse together education and entertainment.

“While we explain most of the tricks, we have deliberately included a few where we leave the viewer to figure it out. It’s all just maths, but we wanted to leave some magical mystery in there too!”

Mr Davison said: “Using the fun of magic makes this a really great way to learn some of the fundamentals of maths, the links between maths and magic are strong and a brilliant way to bring excitement into the classroom.”

The educational website builds on a bank of teaching resources led by Professor McOwan, including Illusioneering (www.Illusioneering.org), a website which gives students and teachers the platform to explore science and engineering through a range of magic tricks; and cs4fn (www.cs4fn.org), a web and magazine initiative putting the fun into computer science.

The production of the videos for mathematicalmagic.com was possible due to funding from the UK National Higher Education STEM programme. The Programme supports Higher Education Institutions in the exploration of new approaches to recruiting students and delivering programmes of study within the Science, Technology, Engineering and Mathematics (STEM) disciplines.

Institute of Mathematics and its Applications project manager in HE STEM, Makhan Singh, said: “Once again we see the power of making education fun! Peter McOwan brings alive the mystery of magic whilst showcasing the power of mathematics – sheer brilliance! It’s entertaining, amusing, educational and most definitely relevant in today’s classrooms; well done!”.

For more such insights, log into our website https://international-maths-challenge.com

Credit of the article given to Queen Mary, University of London


Super Models – Using Maths to Mitigate Natural Disasters

We can’t tame the oceans, but modelling can help us better understand them.

Last year will go on record as one of significant natural disasters both in Australia and overseas. Indeed, the flooding of the Brisbane River in January is still making news as the Queensland floods inquiry investigates whether water released from Wivenhoe Dam was responsible. Water modelling is being used to answer the question: could modelling have avoided the problem in the first place?

This natural disaster – as well as the Japanese tsunami in March and the flooding in Bangkok in October – involved the movement of fluids: water, mud or both. And all had a human cost – displaced persons, the spread of disease, disrupted transport, disrupted businesses, broken infrastructure and damaged or destroyed homes. With the planet now housing 7 billion people, the potential for adverse humanitarian effects from natural disasters is greater than ever.

Here in CSIRO’s division of Mathematical and Information Sciences, we’ve been working with various government agencies (in Australia and China) to model the flow of flood waters and the debris they carry. Governments are starting to realise just how powerful computational modelling is for understanding and analysing natural disasters and how to plan for them.

This power is based on two things – the power of computers and the power of the algorithms (computer processing steps) that run on the computers.

In recent years, the huge increase in computer power and speed coupled with advances in algorithm development has allowed mathematical modellers like us to make large strides in our research.

These advances have enabled us to model millions, even billions of water particles, allowing us to more accurately predict the effects of natural and man-made fluid flows, such as tsunamis, dam breaks, floods, mudslides, coastal inundation and storm surges.

So how does it work?

Well, fluids such as sea water can be represented as billions of particles moving around, filling spaces, flowing downwards, interacting with objects and in turn being interacted upon. Or they can be visualised as a mesh of the fluids’ shape.

Let’s consider a tsunami such as the one that struck the Japanese coast in March of last year. When a tsunami first emerges as a result of an earthquake, shallow water modelling techniques give us the most accurate view of the wave’s formation and early movement.

Mesh modelling of water being poured into a glass.

Once the wave is closer to the coast however, techniques known collectively as smoothed particle hydrodynamics (SPH) are better at predicting how the wave interacts with local geography. We’ve created models of a hypothetical tsunami off the northern Californian coastline to test this.

A dam break can also be modelled using SPH. The modelling shows how fast the water moves at certain times and in certain places, where water “overtops” hills and how quickly it reaches towns or infrastructure such as power stations.

This can help town planners to build mitigating structures and emergency services to co-ordinate an efficient response. Our models have been validated using historical data from a real dam that broke in California in 1928 – the St. Francis Dam.

Having established that our modelling techniques work better than others, we can apply them to a range of what-if situations.

In collaboration with the Satellite Surveying and Mapping Application Centre in China we tested scenarios such as the hypothetical collapse of the massive Geheyan Dam in China.

We combined our modelling techniques with digital terrain models to get a realistic picture of how such a disaster would unfold and, therefore, what actions could mitigate it.

Our experience in developing and using these techniques over several decades allows us to combine them in unique ways for each situation.

We’ve modelled fluids not just for natural disaster planning but also movie special effects, hot metal production, water sports and even something as everyday as insurance.

Insurance companies have been looking to us for help to understand how natural disasters unfold. They cop a lot of media flak after disasters for not covering people affected. People living in low-lying areas have traditionally had difficulty accessing flood insurance and find themselves unprotected in flood situations.

Insurers are starting to realise that the modelling of geophysical flows can provide a basis for predicting localised risk of damage due to flooding and make flood coverage a viable business proposition. One Australian insurance company has been working with us to quantify risk of inundation in particular areas.

Using data from the 1974 Brisbane floods, the floods of last year and fluid modelling data, an insurance company can reliably assess residents’ exposure to particular risks and thereby determine suitable premiums.

With evidence-based tools such as fluid modelling in their arsenal, decision-makers are better prepared for the future. That may be a future of more frequent natural disasters, a future with a more-densely-populated planet, or, more likely, a combination of both.

For more such insights, log into www.international-maths-challenge.com.

*Credit for article given to Mahesh Prakash*


Super models – using maths to mitigate natural disasters

Last year will go on record as one of significant natural disasters both in Australia and overseas. Indeed, the flooding of the Brisbane River in January is still making news as the Queensland floods inquiry investigates whether water released from Wivenhoe Dam was responsible. Water modelling is being used to answer the question: could modelling have avoided the problem in the first place?

This natural disaster – as well as the Japanese tsunami in March and the flooding in Bangkok in October – involved the movement of fluids: water, mud or both. And all had a human cost – displaced persons, the spread of disease, disrupted transport, disrupted businesses, broken infrastructure and damaged or destroyed homes. With the planet now housing 7 billion people, the potential for adverse humanitarian effects from natural disasters is greater than ever.

Here in CSIRO’s division of Mathematical and Information Sciences, we’ve been working with various government agencies (in Australia and China) to model the flow of flood waters and the debris they carry. Governments are starting to realise just how powerful computational modelling is for understanding and analysing natural disasters and how to plan for them.

This power is based on two things – the power of computers and the power of the algorithms (computer processing steps) that run on the computers.

In recent years, the huge increase in computer power and speed coupled with advances in algorithm development has allowed mathematical modellers like us to make large strides in our research.

These advances have enabled us to model millions, even billions of water particles, allowing us to more accurately predict the effects of natural and man-made fluid flows, such as tsunamis, dam breaks, floods, mudslides, coastal inundation and storm surges.

So how does it work?

Well, fluids such as sea water can be represented as billions of particles moving around, filling spaces, flowing downwards, interacting with objects and in turn being interacted upon. Or they can be visualised as a mesh of the fluids’ shape.

Let’s consider a tsunami such as the one that struck the Japanese coast in March of last year. When a tsunami first emerges as a result of an earthquake, shallow water modelling techniques give us the most accurate view of the wave’s formation and early movement.

Once the wave is closer to the coast however, techniques known collectively as smoothed particle hydrodynamics (SPH) are better at predicting how the wave interacts with local geography. We’ve created models of a hypothetical tsunami off the northern Californian coastline to test this.

A dam break can also be modelled using SPH. The modelling shows how fast the water moves at certain times and in certain places, where water “overtops” hills and how quickly it reaches towns or infrastructure such as power stations.

This can help town planners to build mitigating structures and emergency services to co-ordinate an efficient response. Our models have been validated using historical data from a real dam that broke in California in 1928 – the St. Francis Dam.

Having established that our modelling techniques work better than others, we can apply them to a range of what-if situations.

In collaboration with the Satellite Surveying and Mapping Application Centre in China we tested scenarios such as the hypothetical collapse of the massive Geheyan Dam in China.

We combined our modelling techniques with digital terrain models to get a realistic picture of how such a disaster would unfold and, therefore, what actions could mitigate it.

Our experience in developing and using these techniques over several decades allows us to combine them in unique ways for each situation.

We’ve modelled fluids not just for natural disaster planning but also movie special effects, hot metal production, water sports and even something as everyday as insurance.

Insurance companies have been looking to us for help to understand how natural disasters unfold. They cop a lot of media flak after disasters for not covering people affected. People living in low-lying areas have traditionally had difficulty accessing flood insurance and find themselves unprotected in flood situations.

Insurers are starting to realise that the modelling of geophysical flows can provide a basis for predicting localised risk of damage due to flooding and make flood coverage a viable business proposition. One Australian insurance company has been working with us to quantify risk of inundation in particular areas.

Using data from the 1974 Brisbane floods, the floods of last year and fluid modelling data, an insurance company can reliably assess residents’ exposure to particular risks and thereby determine suitable premiums.

With evidence-based tools such as fluid modelling in their arsenal, decision-makers are better prepared for the future. That may be a future of more frequent natural disasters, a future with a more-densely-populated planet, or, more likely, a combination of both.

For more such insights, log into our website https://international-maths-challenge.com

Credit of the article given to Mahesh Prakash, CSIRO


Make Mine a Double: Moore’s Law And The Future of Mathematics

Our present achievements will look like child’s play in a few years.

What do iPhones, Twitter, Netflix, cleaner cities, safer cars, state-of-the-art environmental management and modern medical diagnostics have in common? They are all made possible by Moore’s Law.

Moore’s Law stems from a seminal 1965 article by Intel founder Gordon Moore. He wrote:

“The complexity for minimum component costs has increased at a rate of roughly a factor of two per year … Certainly over the short term this rate can be expected to continue, if not to increase. Over the longer term, the rate of increase is a bit more uncertain, although there is no reason to believe it will not remain nearly constant for at least ten years. That means, by 1975, the number of components per integrated circuit for minimum cost will be 65,000.”

Moore noted that in 1965 engineering advances were enabling a doubling in semiconductor density every 12 months, but this rate was later modified to roughly 18 months. Informally, we may think of this as doubling computer performance.

In any event, Moore’s Law has now continued unabated for 45 years, defying several confident predictions it would soon come to a halt, and represents a sustained exponential rate of progress that is without peer in the history of human technology. Here is a graph of Moore’s Law, shown with the transistor count of various computer processors:

Where we’re at with Moore’s Law

At the present time, researchers are struggling to keep Moore’s Law on track. Processor clock rates have stalled, as chip designers have struggled to control energy costs and heat dissipation, but the industry’s response has been straightforward — simply increase the number of processor “cores” on a single chip, together with associated cache memory, so that aggregate performance continues to track or exceed Moore’s Law projections.

The capacity of leading-edge DRAM main memory chips continues to advance apace with Moore’s Law. The current state of the art in computer memory devices is a 3D design, which will be jointly produced by IBM and Micron Technology, according to a December 2011 announcement by IBM representatives.

As things stand, the best bet for the future of Moore’s Law are nanotubes — submicroscopic tubes of carbon atoms that have remarkable properties.

According to a recent New York Times article, Stanford researchers have created prototype electronic devices by first growing billions of carbon nanotubes on a quartz surface, then coating them with an extremely fine layer of gold atoms. They then used a piece of tape (literally!) to pick the gold atoms up and transfer them to a silicon wafer. The researchers believe that commercial devices could be made with these components as early as 2017.

Moore’s Law in science and maths

So what does this mean for researchers in science and mathematics?

Plenty, as it turns out. A scientific laboratory typically uses hundreds of high-precision devices that rely crucially on electronic designs, and with each step of Moore’s Law, these devices become ever cheaper and more powerful. One prominent case is DNA sequencers. When scientists first completed sequencing a human genome in 2001, at a cost of several hundred million US dollars, observers were jubilant at the advances in equipment that had made this possible.

Now, only ten years later, researchers expect to reduce this cost to only US$1,000 within two years and genome sequencing may well become a standard part of medical practice. This astounding improvement is even faster than Moore’s Law!

Applied mathematicians have benefited from Moore’s Law in the form of scientific supercomputers, which typically employ hundreds of thousands of state-of-the-art components. These systems are used for tasks such as climate modelling, product design and biological structure calculations.

Today, the world’s most powerful system is a Japanese supercomputer that recently ran the industry-standard Linpack benchmark test at more than ten “petaflops,” or, in other words, 10 quadrillion floating-point operations per second.

Below is a graph of the Linpack performance of the world’s leading-edge systems over the time period 1993-2011, courtesy of the website Top 500. Note that over this 18-year period, the performance of the world’s number one system has advanced more than five orders of magnitude. The current number one system is more powerful than the sum of the world’s top 500 supercomputers just four years ago.


Linpack performance over time.

Pure mathematicians have been a relative latecomer to the world of high-performance computing. The present authors well remember the era, just a decade or two ago, when the prevailing opinion in the community was that “real mathematicians don’t compute.”

But thanks to a new generation of mathematical software tools, not to mention the ingenuity of thousands of young, computer-savvy mathematicians worldwide, remarkable progress has been achieved in this arena as well (see our 2011 AMS Notices article on exploratory experimentation in mathematics).

In 1963 Daniel Shanks, who had calculated pi to 100,000 digits, declared that computing one billion digits would be “forever impossible.” Yet this level was reached in 1989. In 1989, famous British physicist Roger Penrose, in the first edition of his best-selling book The Emperor’s New Mind, declared that humankind would likely never know whether a string of ten consecutive sevens occurs in the decimal expansion of pi. Yet this was found just eight years later, in 1997.

Computers are certainly being used for more than just computing and analysing digits of pi. In 2003, the American mathematician Thomas Hales completed a computer-based proof of Kepler’s conjecture, namely the long-hypothesised fact that the simple way the grocer stacks oranges is in fact the optimal packing for equal-diameter spheres. Many other examples could be cited.

Future prospects

So what does the future hold? Assuming that Moore’s Law continues unabated at approximately the same rate as the present, and that obstacles in areas such as power management and system software can be overcome, we will see, by the year 2021, large-scale supercomputers that are 1,000 times more powerful and capacious than today’s state-of-the-art systems — “exaflops” computers (see NAS Report). Applied mathematicians eagerly await these systems for calculations, such as advanced climate models, that cannot be done on today’s systems.

Pure mathematicians will use these systems as well to intuit patterns, compute integrals, search the space of mathematical identities, and solve intricate symbolic equations. If, as one of us discussed in a recent Conversation article, such facilities can be combined with machine intelligence, such as a variation of the hardware and software that enabled an IBM system to defeat the top human contestants in the North American TV game show Jeopardy!, we may see a qualitative advance in mathematical discovery and even theory formation.

It is not a big leap to imagine that within the next ten years tailored and massively more powerful versions of Siri (Apple’s new iPhone assistant) will be an integral part of mathematics, not to mention medicine, law and just about every other part of human life.

Some observers, such as those in the Singularity movement, are even more expansive, predicting a time just a few decades hence when technology will advance so fast that at the present time we cannot possibly conceive or predict the outcome.

Your present authors do not subscribe to such optimistic projections, but even if more conservative predictions are realised, it is clear that the digital future looks very bright indeed. We will likely look back at the present day with the same technological disdain with which we currently view the 1960s.

For more such insights, log into www.international-maths-challenge.com.

*Credit for article given to Jonathan Borwein (Jon) and David H. Bailey*


‘Touch’ TV series uses numbers to connect people

Think about all of the different people that you come in contact with on any given day: family, friends, coworkers and strangers going about their lives. The fateful hijacking of Flight 93 on 9/11 showed how a plane full of people could be connected in a way that none of the passengers could have imagined as they boarded their flights.

Is everything connected? Is the world a predictable set of patterns? Can one person really make a difference? Fox’s sci-fi television series, “Touch,” will tell stories of how unrelated people and events can be linked together, with the overall theme that one person does have the power to “touch” the world.

“People are hungry to believe that they are all connected and that what they do matters,” said Carol Barbee, executive producer of “Touch.” “I am inspired by people living their lives, doing what they love and care about. This show has a rare opportunity to tell stories about ordinary people. The best stories come from real life and anyone could be a character on the show.”

The show centers on Martin Bohm (played by Kiefer Sutherland), who is trying desperately to find a way to connect with his autistic son, Jake (played by David Mazouz). Jake is unable to speak and doesn’t like to be touched, but he does see where patterns intersect. Martin’s discovery that his son is using numbers instead of words to communicate compels him to try to put together a puzzle full of seemingly unrelated pieces.

When John Nash (played by Russell Crowe) shows his future wife, Alicia Nash (played by Jennifer Connelly) the night sky, at first all she sees is a sky full of stars until he takes her hand and traces a pattern connecting the stars. When she recognizes the pattern, Nash remarks, “Now, you are a mathematician!”

So, if numbers are like stars and mathematics is like a constellation, then it would seem that anyone can see mathematics and the patterns in everyday things.

“Mathematics sees patterns that are already there, but normally are invisible,” said Devlin. “If the show uses that idea, they would capture the very essence of mathematics.”

For example, the Fibonacci sequence follows a pattern where the first two numbers are added together to get the next number (0, 1, 1, 2, 3, 5, 8, 13, 21, 34). Fibonacci numbers are found throughout nature, such as the number of petals in a rose. Most people wouldn’t notice the mathematical patterns in these objects or identify the sequence of numbers; they would just enjoy the beauty of nature.

So, while storytellers may take poetic license with the mathematics presented, the show’s themes can bring awareness to how mathematics touches everything and connects the world, including people, in universal ways.

“I hope that viewers will come away with an awareness of the effects that they have on people and a drive to do good work in the real world,” said Barbee. “I hope people understand the power of an individual, you have no idea the power of your reach on a daily basis or how many lives you touch.”

For more such insights, log into our website https://international-maths-challenge.com

Credit of the article given to Emilie Lorditch, Inside Science News Service


Mathematics confirm the chaos of the Spanish labor market

Unemployment time series in Spain behave in a chaotic way according to a study at the University of Seville. Such chaos demonstrates the complex and unpredictable nature of the Spanish labour market in the long run. However, short term patterns can be predicted using complex mathematical models.

“Using mathematical techniques we have found evidence of chaos in unemployment time series in Spain. In theory, this explains why unemployment trends are so unstable,” outlines Elena Olmedo, researcher at the University of Seville and author of the study “Is there chaos in the Spanish labour market?”, which was published in the Chaos, Solitons & Fractals journal.

Olmedo explains that when a system is chaotic, its behaviour is “highly complex and unpredictable in the long run”. This is the case because any small change is magnified by the system itself. She adds however that “in the short term, its behaviour can be predicted but non-linear models that capture the complexity of behaviour must be used for this.”

To carry out the study, Spain’s National Employment Institute (INEM) provided the country’s unemployment figures over a 36-year period from 1965 to 2001. Through the use of two algorithms, the so-called ‘maximum Lyapunov exponent’ was calculated. This parameter measures the instability of a certain system. Positive results indicate instability and chaotic behaviour.

The results confirm the nonlinearity and chaoticity of the Spanish labour market. This, in turn, is the first step in characterizing unemployment time series and explaining their reality. Scientists are now working on the second phase of the study. This involves the development of short-term predictions with the relevant mathematic models. The Sevillian researchers are currently working with artificial neural networks.

Chaotic models and the ‘butterfly effect’

In economics, linear models have been traditionally used to characterise and predict unemployment time series. But, they tend to produce rather simple behavioural trends which have to be randomly disturbed to achieve more realistic results. For this reason, the team opted for nonlinear models and concentrated mainly on chaotic models.

These mathematic models are capable of showing very different behaviours over time when dealing with infinitesimally small changes in initial conditions. An example would be the ‘butterfly effect’ which suggests that the flutter of one of these insects’ wings could trigger a tsunami on the other side of the world.

Olmedo concludes that “the use of chaotic models allows us to obtain behavioural trends as complex as their own reality. However, we need to continue in our investigations to find better tools that help us in characterization and prediction.”

For more such insights, log into our website https://international-maths-challenge.com

Credit of the article given to FECYT – Spanish Foundation for Science and Technology


Strategic player challenges tip matches

Grand Slam tennis players in the US, Wimbledon and Australian Opens could improve their chances of winning sets, matches and even tournaments through more aggressive and strategic use of challenges, Swinburne research has found.

Analysis of the ‘nested’ scoring system used in tennis by esteemed Swinburne sports statistician, Professor Stephen Clarke and Sheffield University’s John Norman, found that players don’t have to increase their chances of winning a point very much, to significantly increase their chances of winning a match.

The two to four player challenges allowed on show courts in three of the Grand Slam tournaments are much more important than previously realised, and should be deployed later in games, later in sets and when players are behind, the new statistical modelling has shown.

“Optimal use of the three challenges available (in the Australian Open) can increase a player’s chance of winning a set to 55 per cent in an otherwise even contest,’’ Professor Clarke writes in a paper accepted for publication in the Journal of the Operational Research Society.

“This increases their chance of winning a best of three-set match to 58 per cent, and a best of five-set match to 59 per cent, which is nearly 60:40. That’s a lot of difference,” he said.

The ‘moneyball’-like analysis of the increased strategic advantage of a challenge acted much like compound interest, he said.

“If your chance of winning a match is 60 per cent, the chance of winning seven matches in a row to win the tournament is probably double what you had before, so it could have quite a drastic effect over the life of the tournament.

“There should be more aggressive challenging in more important points which tend to occur later in games, later in sets and when the player is behind rather than when ahead.”

To date, analysis of challenges from both Wimbledon and the Australian Open shows players are sparing in their deployment of challenges, and are successful only about 30 per cent of the time. It was unlikely players, coaches or commentators realised the strategic importance of challenges, he said.

Professor Clarke – himself a keen tennis, Australian Rules Football and cricket fan – said the Australian Open tennis crowd enjoyed the process of the challenge – which is replayed and dramatised using proprietary technology, as it added much to the tension and enjoyment of the tournament.

Similar challenge rules are expected to be introduced in other sports, prompting academics to consider the growing use of technology and how it will increasingly enable players to challenge umpires’ decisions.

For more such insights, log into our website https://international-maths-challenge.com

Credit of the article given to Swinburne University of Technology


The numbers game

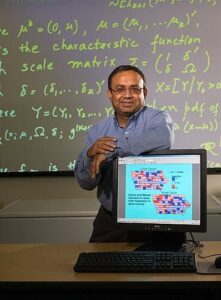
Dipak Dey, Board of Trustees Distinguished Professor of Statistics and associate dean in the College of Liberal Arts and Sciences.

Dipak Dey, Board of Trustees Distinguished Professor of Statistics and associate dean in the College of Liberal Arts and Sciences, has been called an ambassador for the field. A prolific researcher, he is best known for his contributions in the areas of statistical decision theory and Bayesian statistics.

A Fellow of both the American Statistical Association and the Institute of Mathematical Statistics, he is also recognized for developing and maintaining collaborative research programs with other departments and organizations. He recently sat down to answer questions about his field.

We’ve all heard the saying, “Statistics don’t lie.” Yet it’s not uncommon to see statistics misused to prove a point. As a statistics expert, does this frustrate you? And how do you respond?

Statistics do not lie, but sometimes researchers do by misusing and misunderstanding. Sometimes people try to misuse statistics to get across a particular agenda. As a discipline, statistics is a sound science and is being prominently used in all disciplines. Unfortunately statisticians and scientists can’t control how others with a specific agenda may or may not misuse the sound principles and paradigms for their personal benefit.

Data can often be manipulated or ignored to come to a specific conclusion, but that in and of itself is not a reflection on the theory and modeling used in the field. The situation is similar to misusing any kind of legitimate system for one’s personal agenda. People are warned against doing such things, but every year we hear about some powerful interests misusing statistical data to prove a specific point. This is unfortunate and indeed frustrating. In case of such cases, are the principles of statistics at fault? We need to think before we answer.

Personally, I feel happy and proud to know what statistics is about, and how it helps society and life as a whole. After, all knowledge is golden. So I keep learning through the knowledge that can be acquired through the regular use of statistics.

Why should we all know more about statistics?

We all need to know more statistics because it is the science of using data in all fields and disciplines to determine and draw true conclusions about the world. The knowledge gained from statistics is used regularly in technology, business, economics, medicine, social science, and can be related as fact-based knowledge to help people’s daily lives.

What are statisticians doing to expand the public’s understanding of statistics and how they are used?

Besides teaching statistics at the educational level, statisticians have now joined various government agencies, nonprofit organizations, corporations, and other sectors in everything from technology to fashion. As I mentioned before, the discipline of statistics is used in virtually all fields. Whether it is for the analysis of polling data for politics or the analysis of air and water quality for the environment or the analysis of cancer data for smokers, statistics plays a key role in gaining fact-based knowledge. Specifically when it comes to the example of our government, where the decisions being made impact all citizens of the country, statisticians are playing determinative roles in the Food and Drug Administration, the National Institutes of Health, the Census Bureau, the Bureau of Labor Statistics, the United States Department of Agriculture, the National Center for Atmospheric Research, the National Institute for Environmental Research, the National Institute for Educational and Health Statistics, etc.

What role do statistics play in the public debate about an issue, such as what governments should do to deal with climate change?

Statistics play a major role in the public debate about various issues, often controversial issues. Fact-based data gathered through surveys and opinion polls often determine how much support the government has toward a specific point of view or agenda. Statistics can be used to model and track climate change through scientific data. Similarly, statistics can be used to determine how people feel about certain scientific conclusions. Statistics can be used to both refute and support specific claims. Many debates are resolved by using appropriately designed models to demonstrate a point. Many agencies, e.g. Gallup and Westat, are taking polls on major issues from the public. The Roper Center at UConn is a major archive that maintains a huge database of public opinion about science, economics, and government matters. The government constantly turns to statistics to gauge the way to make policy.

What the government should or wants to do in regards to climate change is based both on public opinion statistics as well as various fact-based expert opinions from scientists. Climatologists, for example, often extensively use statistics in risk analysis and extreme event modeling to factually measure climate change. They draw conclusions based on the detailed statistical analysis.

Why should students who are considering a major pick statistics?

The two primary reasons would be a love for science and, arguably more important, the need for a fruitful career. The job market in statistics is flourishing at a rapid pace. One North American job website recently published its 2011 job ratings where they ranked “statistician” as the fourth best job of 2011. Statistics as a field is extremely popular in all sectors, and its popularity and the need for statisticians will only grow. A statistician’s talent is needed virtually everywhere, and most students should have no problem finding a job post-college. A statistics major has the choice to join various sectors, as I mentioned before, ranging from sports to the government. With a BS or BA in statistics, students can also choose to pursue higher education in a specialty fields such as biostatistics, bioinformatics, computational statistics, actuarial science, financial statistics, etc.

What are some of the career paths for statisticians now that didn’t exist a few years ago? And what types of jobs do your graduates get?

There are many career paths for today’s statisticians. Many of them evolved due to the cutting-edge development of computers that didn’t exist in the past. These include but are certainly not limited to opportunities in pharmaceutical companies, market research firms, biotech companies, insurance industries, and the government. The job prospects are endless and yet to be fully determined.

For more such insights, log into our website https://international-maths-challenge.com

Credit of the article given to Cindy Weiss, University of Connecticut