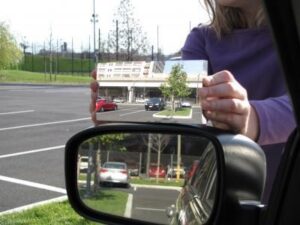
The mathematics of jury size: Statistical model shows several interesting properties of US jury configurations

Could different jury sizes improve the quality of justice? The answers are not clear, but mathematicians are analysing juries to identify potential improvements.

The U.S. Constitution does not say that juries in criminal cases must include 12 people or that their decisions must be unanimous. In fact, some states use juries of different sizes.

One primary reason why today’s juries tend to have 12 people is that the Welsh king Morgan of Gla-Morgan, who established jury trials in 725 A.D., decided upon the number, linking the judge and jury to Jesus and his Twelve Apostles.

The Supreme Court has ruled that smaller juries can be permitted. States such as Florida, Connecticut and others have used — or considered — smaller juries of six or nine people. In Louisiana, super-majority verdicts of nine jurors out of 12 are allowed.

However, in 1978, the Supreme Court ruled that a five-person jury is not allowed after Georgia attempted to assign five-person juries to certain criminal trials.

To mathematicians and statisticians, this offers a clear division between acceptable and not acceptable, and therefore an opportunity for analysis.

“What seems to be apparent reading the literature on this is that the Supreme Court is making these decisions basically on an intuitive basis,” said Jeff Suzuki, a mathematician at Brooklyn College in New York. “It’s their sense of how big a jury should be to ensure proper deliberation.”

At a mathematics conference earlier this year, Suzuki presented research comparing the likelihood of conviction of a hypothetical defendant with the same likelihood of guilt but different jury conditions.

Building on a well-established line of research, which began with 18th-century French philosopher and mathematician Nicolas de Condorcet, mathematical analysis of juries has continued over the years, beginning from Condorcet’s idea that each juror has some probability of coming to the correct conclusion about the defendant’s guilt or innocence.

Suzuki used three different probabilities to calculate the likely decision of a jury, including the probability that the defendant is actually guilty, the probability that a juror will make the correct decision if the defendant is guilty, and the probability that a juror will make the correct decision if the defendant is not guilty

Suzuki’s model suggests that smaller juries are more likely than larger juries to convict when the defendant appears less certain to be guilty. All the juries he modeled are very likely to convict when the evidence suggests that a defendant is almost certainly guilty. But for slightly less certain cases, differences become clear.

If it appears that there’s an 80 percent likelihood that the defendant is guilty, then Suzuki’s model suggests that less than 10 percent of the time a 12-person jury would unanimously vote to convict, but a 6-person jury would unanimously vote to convict over 25 percent of the time — and a Louisiana-style jury that can convict with nine out of 12 votes would convict in roughly 60 percent of such trials.

Suzuki admits that the models may not be capturing the complete picture. Even if states that use fewer than 12 jurors had higher conviction rates than other states, that wouldn’t mean smaller juries convict greater numbers of innocent defendants, he said.

One potential problem with translating this research to real world trials is that it leaves out the interaction between jurors, which Suzuki admitted is a problem.

“We don’t have a good model for how jurors interact with each other,” he said. “The real challenge is that the data doesn’t really exist.”

In addition to the issue of juror interaction, the [Suzuki’s] models leave out other factors important to finding the correct verdict, such as the possibility that testimony or evidence could deceive the jury, said Bruce Spencer, a professor of statistics at Northwestern University in Evanston, Ill., who did not work with Suzuki.

“If the evidence is very misleading, it’s going to tend to mislead all of [the jurors],” said Spencer.

In a separate study, Spencer analysed surveys completed by judges just before juries delivered their verdict and compared what the judges thought to the juries’ decisions, finding that the verdicts agreed about 80 percent of the time. He found that in about one in every five trials in his study sample, the judge and the jury came to different conclusions.

Real data on the true guilt or innocence of a defendant on trial is simply not available. The jury’s decision is only half the story of a verdict’s accuracy. Many factors in jury decisions cannot be captured quantitatively.

“If you’re coming up with a measure of the speed of light or a standard kilogram, you like to have some assessment of uncertainty,” said Spencer. “I think it is difficult to assess the uncertainty of our estimates.”

Although Spencer knows either the judge or jury must have been wrong in the 20 percent of cases in his study when the two disagreed, there was not enough information to know which was correct in a given case. Using statistical modeling, he found that overall the judges and juries were about equally accurate, but cautioned about drawing conclusions based on the limited number of cases in his study.

Suzuki is trying to figure out more about verdict accuracy with his research. He said that he can build estimates of false conviction rates by counting how many verdicts are later overturned. The estimates are imperfect, he said, especially given that new technology such as DNA testing was not available when some of the original verdicts were given.

But Suzuki feels that his research can at least examine some of the important details of jury trials. Making better models helps to draw general conclusions, despite the uniqueness of each trial.

“You can use probabilistic methods to model human behaviour, provided that you understand what the statistics are and are not telling you, ”Said Suzuki.

For more such insights, log into our website https://international-maths-challenge.com

Credit of the article given to Chris Gorski, Inside Science News Service


On the hunt for mathematical beauty

Alexei Borodin

For anyone who has ever taken a commercial flight, it’s an all-too-familiar scene: Hundreds of passengers sit around waiting for boarding to begin, then rush to be at the front of the line as soon as it does.

Boarding an aircraft can be a frustrating experience, with passengers often wondering if they will ever make it to their seats. But Alexei Borodin, a professor of mathematics at MIT, can predict how long it will take for you to board an airplane, no matter how long the line. That’s because Borodin studies difficult probability problems, using sophisticated mathematical tools to extract precise information from seemingly random groups.

“Imagine an airplane in which each row has one seat, and there are 100 seats,” Borodin says. “People line up in random order to fill the plane, and each person has a carry-on suitcase in their hand, which it takes them one minute to put into the overhead compartment.”

If the passengers all board the plane in an orderly fashion, starting from the rear seats and working their way forwards, it would be a very quick process, Borodin says. But in reality, people queue up in a random order, significantly slowing things down.

So how long would it take to board the aircraft? “It’s not an easy problem to solve, but it is possible,” Borodin says. “It turns out that it is approximately equal to twice the square root of the number of people in the queue.” So with a 100-seat airplane, boarding would take 20 minutes, he says.

Borodin says he has enjoyed solving these kinds of tricky problems since he was a child growing up in the former Soviet Union. Born in the industrial city of Donetsk in eastern Ukraine, Borodin regularly took part in mathematical Olympiads in his home state. Held all over the world, these Olympiads set unusual problems for children to solve, requiring them to come up with imaginative solutions while working against the clock.

It is perhaps no surprise that Borodin had an interest in math from an early age: His father, Mikhail Borodin, is a professor of mathematics at Donetsk State University. “He was heavily involved in research while I was growing up,” Borodin says. “I guess children always look up to their parents, and it gave me an understanding that mathematics could be an occupation.”

In 1992, Borodin moved to Russia to study at Moscow State University. The dissolution of the USSR meant that, arriving in Moscow, Borodin found himself faced with a choice of whether to take Ukrainian citizenship, like his parents back in Donetsk, or Russian. It was a difficult decision, but for practical reasons Borodin opted for Russian citizenship.

Times were tough while Borodin was studying in Moscow. Politically there was a great deal of unrest in the city, including a coup attempt in 1993. Many scientists began leaving Russia, in search of a more stable life elsewhere.

Financially things were not easy for Borodin either, as he had just $15 each month to spend on food and accommodation. “But I still remember the times fondly,” he says. “I didn’t pay much attention to politics at the time, I was working too hard. And I had my friends, and my $15 per month to live on.”

After Borodin graduated from Moscow State University in 1997, a former adviser who had moved to the United States invited Borodin over to join him. So he began splitting his time between Moscow and Philadelphia, where he studied for his PhD at the University of Pennsylvania.

He then spent seven years at the California Institute of Technology before moving to MIT in 2010, where he has continued his research into probabilities in large random objects.

Borodin says there are no big mathematical problems he is desperate to solve. Instead, his greatest motivation is the pursuit of what he calls the beauty of the subject. While it may seem strange to talk about finding beauty in abstract mathematical constructions, many mathematicians view their work as an artistic endeavor.

“If one asks 100 mathematicians to describe this beauty, one is likely to get 100 different answers,” he says.

And yet all mathematicians tend to agree that something is beautiful when they see it, he adds, saying, “It is this search for new instances of mathematical beauty that largely drives my research.”

For more such insights, log into our website https://international-maths-challenge.com

Credit of the article given to Helen Knight, Massachusetts Institute of Technology


Mathematical methods help predict movement of oil and ash following environmental disasters

When oil started gushing into the Gulf of Mexico in late April 2010, friends asked George Haller whether he was tracking its movement. That’s because the McGill engineering professor has been working for years on ways to better understand patterns in the seemingly chaotic motion of oceans and air. Meanwhile, colleagues of Josefina Olascoaga in Miami were asking the geophysicist a similar question. Fortunately, she was.

For those involved in managing the fallout from environmental disasters like the Deepwater Horizon oil spill, it is essential to have tools that predict how the oil will move, so that they make the best possible use of resources to control the spill. Thanks to work done by Haller and Olascoaga, such tools now appear to be within reach. Olascoaga’s computational techniques and Haller’s theory for predicting the movement of oil in water are equally applicable to the spread of ash in the air, following a volcanic explosion.

“In complex systems such as oceans and the atmosphere, there are a lot of features that we can’t understand offhand,” Haller explains. “People used to attribute these to randomness or chaos. But it turns out, when you look at data sets, you can find hidden patterns in the way that the air and water move.” Over the past decade, the team has developed mathematical methods to describe these hidden structures that are now broadly called Lagrangian Coherent Structures (LCSs), after the French mathematician Joseph-Louis Lagrange.

“Everyone knows about the Gulf Stream, and about the winds that blow from the West to the East in Canada,” says Haller, “but within these larger movements of air or water, there are intriguing local patterns that guide individual particle motion.” Olascoaga adds, “Though invisible, if you can imagine standing in a lake or ocean with one foot in warm water and the other in the colder water right beside it, then you have experienced an LCS running somewhere between your feet.”

“Ocean flow is like a busy city with a network of roads,” Haller says, “except that roads in the ocean are invisible, in motion, and transient.” The method Haller and Olascoaga have developed allows them to detect the cores of LCSs. In the complex network of ocean flows, these are the equivalent of “traffic intersections” and they are crucial to understanding how the oil in a spill will move. These intersections unite incoming flow from opposite directions and eject the resulting mass of water. When such an LCS core emerges and builds momentum inside the spill, we know that oil is bound to seep out within the next four to six days. This means that the researchers are now able to forecast dramatic changes in pollution patterns that have previously been considered unpredictable.

So, although Haller wasn’t tracking the spread of oil during the Deepwater Horizon disaster, he and Olascoaga were able to join forces to develop a method that does not simply track: it actually forecasts major changes in the way that oil spills will move. The two researchers are confident that this new mathematical method will help those engaged in trying to control pollution make well-informed decisions about what to do.

For more such insights, log into our website https://international-maths-challenge.com

Credit of the article given to University of Miami


Making sports statistics more scientific

Whether it is the sprinter who finished first or the team that scored more points, it’s usually easy to determine who won a sporting event. But finding the statistics that explain why an athlete or team wins is more difficult — and major figures at the intersection of sports and numbers are determined to crack this problem.

Many statistics explain part of the picture, especially in team sports, such as the number of points scored by a point guard, a quarterback’s passing yards, or a slugger’s batting average. But many of these numbers — some of them sacred among sports fans — don’t directly address a player’s contribution to winning. This was a primary topic of discussion last weekend at the Sloan Sports Analytics Conference in Boston.

Organised by students from the MIT Sloan School of Management and sponsored by several sports-related companies, including media outlet ESPN, the conference brought together over 2,200 people to discuss player evaluation and other factors important to the business of sports.

Many of the research presentations and panel discussions described efforts to remove subjective judgments from sports statistics — and how to define new statistics more directly explain a player’s value.

“We have huge piles of statistics now,” said Bill James, Boston Red Sox official and baseball statistics pioneer, at a panel discussion about adding modern statistics to box scores. “What you have to do is reduce it to significant but small concepts,” said James.

New technology and analysis is only now making it possible to learn more about many fundamental events in several sports, which are not often addressed by traditional sports statistics.

“We’re going to talk about stats that work and stats that don’t work,” said John Walsh, executive vice president of ESPN, who moderated the box score panel discussion.

The panel, which also included three other experts, cited several examples of statistics that didn’t work: a receiver might drop a pass for one of several reasons — but rarely are drops broken down into categories; an assist in basketball is a judgment call with room for different interpretations; and fielding percentage in baseball only generally describes a defensive player’s ability.

In another session, Greg Moore, the director of baseball products for the sports graphics and visualization company Sportvision, described recent data-collection advances in baseball. When all the company’s systems are fully deployed in Major League Baseball stadiums, they plan to track the trajectory of each pitch thrown, the movement of all the players on the field and the speed of every swing and hit ball. Their systems, already fully installed in some ballparks, will collect over a million data points at every game. Some of this data is publicly available.

The data will make it possible to say not just that a player hit a double or that he hit a hard line drive, but that the ball left the bat at a certain speed and launch angle and a certain number of degrees from the foul line. No scout or official scorer can contaminate those kinds of measures with subjectivity. On the other hand, a string of objective data is not inherently more useful than a flawed statistic, which may contain useful wisdom.

During the box-score panel discussion, Dean Oliver, ESPN’s sports analytics director, said that collecting information this way opens a new frontier.

“It’s an immense amount of data, but you have to know what to do with it,” said Oliver.

The winner of the conference’s research paper competition found one way to make new data useful. Using SportVU, a basketball database collected by the company STATS, a team from the University of Southern California’s computer science department studied rebounding a basketball from its absolute first concepts. The data shows the movement of all the players and the ball, including rebounds, passes and other game events.

The research team showed empirically what was only previously accessible from inference and experience. They were able to show that by the time almost all rebounds travel 14 feet from the hoop they also drop below eight feet of elevation — easy reaching distance for a basketball player. The researchers were able to compare shot distance with rebound distance and to show where strategic changes might change offensive rebounding success.

Rajiv Maheswaran, the researcher who presented the paper, compared the effort to find new insights about sports to astronomy. Once you start looking at the stars, he said, you make discoveries, which lead to new hypotheses and more research.

For more such insights, log into our website https://international-maths-challenge.com

Credit of the article to Chris Gorski, Inside Science News Service


Flight of the bumblebee decoded by mathematicians

© Dr Tom Ings

Bumblebees use complex flying patterns to avoid predators according to new research from Queen Mary, University of London.

Writing in the journal Physical Review Letters, Dr Rainer Klages from Queen Mary’s School of Mathematical Sciences, Professor Lars Chittka from the School of Biological and Chemical Sciences, and their teams, describe how they carried out a statistical analysis of the velocities of foraging bumblebees. They found that bumblebees respond to the presence of predators in a much more intricate way than was previously thought.

Bumblebees visit flowers to collect nectar, often visiting multiple flowers in a single patch. There is an ongoing debate as to whether they employ an ‘optimal foraging strategy’, and what such a theory may look like.

Dr Klages explains: “In mathematical theory we treat a bumblebee as a randomly moving object hitting randomly distributed targets. However, bumblebees in the wild are under the constant risk of predators, such as spiders, so the question we wanted to answer is how such a threat might modify their foraging behaviour.”

The team used experiments that track real bumblebees visiting replenishing nectar sources under threat from artificial spiders, which can be simulated with a trapping mechanism that grabs the bumblebee for two seconds.

They found that, in the absence of the spiders, the bumblebees foraged more systematically and travelled directly from flower to flower. When predators were present, however, the bumblebees turned around more often highlighting a more careful approach to avoid the spiders.

PhD student Friedrich Lenz, who did the key analysis, explains: “We learned that the bumblebees display the same statistics of velocities irrespective of whether predators are present or not. Surprisingly, however, the way the velocities change with time during a flight is characteristically different under predation threat.”

The team’s analysis indicates that, when foraging in the wild, factors such as bumblebee sensory perception, memory, and even the individuality of different bumblebees should be taken into account in addition to the presence of predators. All of this may cause deviations from predictions of more simplistic foraging theories.

For more such insights, log into our website https://international-maths-challenge.com

Credit of the article given to Queen Mary, University of London


Researchers create first large-scale model of human mobility that incorporates human nature

For more than half a century, many social scientists and urban geographers interested in modeling the movement of people and goods between cities, states or countries have relied on a statistical formula called the gravity law, which measures the “attraction” between two places. Introduced in its contemporary form by linguist George Zipf in 1946, the law is based on the assumption that the number of trips between two cities is dependent on population size and the distance between the cities. (The name comes from an analogy with Newton’s Law of Gravity, which describes the attraction of two objects based on mass and distance.)

Though widely used in empirical studies, the gravity model isn’t very accurate in making predictions. Researchers must retrofit data to the model by including variables specific to each study in order to force the results to match reality. And with much more data now being generated by new technologies such as cellphones and the Internet, researchers in many fields are eyeing the study of human mobility with a desire to increase its scientific rigor.

To this end, researchers from MIT, Northeastern University and Italy’s University of Padua have identified an underlying flaw in the gravity model: The distance between two cities is far less important than the population size in the area surrounding them. The team has now created a model that considers human motives rather than simply assuming that a larger city attracts commuters. They then tested their “radiation model” on five types of mobility studies and compared the results to existing data. In each case, the radiation model’s predictions were far more accurate than the gravity model’s, which are sometimes off by an order of magnitude.

“Using a multidisciplinary approach, we came up with a simple formula that works better in all situations and shows that population distribution is the key factor in determining mobility fluxes, not distance,” says Marta González, the Gilbert Winslow Career Development Assistant Professor in MIT’s Department of Civil and Environmental Engineering and Engineering Systems Division, and co-author of a paper published Feb. 26 in the online edition of Nature. “I wanted to see if we could find a way to make the gravity model work more accurately without having to change it to fit each situation.”

Physics professor Albert-László Barabási of Northeastern is lead author and principal investigator on the project. Filippo Simini of Northeastern and Amos Maritan of the University of Padua are co-authors.

“I think this paper is a major advance in our understanding of human behaviour,” says Dirk Brockmann, an associate professor of engineering sciences and applied mathematics at Northwestern University who was not involved in the research project. “The key value of the work is that they propose a real theory of mobility making a few basic assumptions, and this model is surprisingly consistent with empirical data.”

The gravity law states that the number of people in a city who will commute to a larger city is based on the population of the larger city. (The larger the population of the big city, the more trips the model predicts.) The number of trips will decrease as the distance between cities grows. One obvious problem with this model is that it will predict trips to a large city without taking into account that the population size of the smaller city places a finite limit on how many people can possibly travel.

The radiation model accounts for this and other limitations of the gravity model by focusing on the population of the surrounding area, which is defined by the circle whose center is the point of origin and whose radius is the distance to the point of attraction, usually a job. It assumes that job availability is proportional to the population size of the entire area and rates a potential job’s attractiveness based on population density and travel distance. (People are willing to accept longer commutes in sparsely populated areas that have fewer job opportunities.)

To demonstrate the radiation model’s accuracy in predicting the number of commuters, the researchers selected two pairs of counties in Utah and Alabama — each with a set of cities with comparable population sizes and distances between them. In this instance, the gravity model predicts that one person will commute between each set of cities. But according to census data, 44 people commuted in Utah and six in the sparsely populated area of Alabama. The radiation model predicts 66 commuters in Utah and two in Alabama, a result well within the acceptable limit of statistical error, González says.

The co-authors also tested the model on other indices of connectedness, including hourly trips measured by phone data, commuting between U.S. counties, migration between U.S. cities, intercity telephone calls made by 10 million anonymous users in a European country, and the shipment of goods by any mode of transportation among U.S. states and major metropolitan areas. In all cases, the model’s results matched existing data.

“What differentiates the radiation model from other phenomenological models is that Simini et al. assume that an individual’s migration or move to a new location is determined by what ‘is offered’ at the location — e.g., job opportunities — and that this employment potential is a function of the size of a location,” Brockmann says. “Unlike the gravity model and other models of the same nature, the radiation model is thus based on a plausible human motive. Gravity models just assume that people move to large cities with high probability and that also this movement probability decreases with distance; they are not based on an underlying first principle.”

For more such insights, log into our website https://international-maths-challenge.com

Credit of the article given to Denise Brehm, Massachusetts Institute of Technology


Hot And Bothered: The Uncertain Mathematics Of Global Warming

Uncertainty exists – but that’s no excuse for a lack of action.

These are painful times for those hoping to see an international consensus and substantive action on global warming.

In the US, Republican presidential front-runner Mitt Romney said in June 2011: “The world is getting warmer” and “humans have contributed” but in October 2011 he backtracked to: “My view is that we don’t know what’s causing climate change on this planet.”

His Republican challenger Rick Santorum added: “We have learned to be sceptical of ‘scientific’ claims, particularly those at war with our common sense” and Rick Perry, who suspended his campaign to become the Republican presidential candidate last month, stated flatly: “It’s all one contrived phony mess that is falling apart under its own weight.”

Meanwhile, the scientific consensus has moved in the opposite direction. In a study published in October 2011, 97% of climate scientists surveyed agreed global temperatures have risen over the past 100 years. Only 5% disagreed that human activity is a significant cause of global warming.

The study concluded in the following way: “We found disagreement over the future effects of climate change, but not over the existence of anthropogenic global warming.

“Indeed, it is possible that the growing public perception of scientific disagreement over the existence of anthropocentric warming, which was stimulated by press accounts of [the UK’s] ”Climategate“ is actually a misperception of the normal range of disagreements that may persist within a broad scientific consensus.”

More progress has been made in Europe, where the EU has established targets to reduce emissions by 20% (from 1990 levels) by 2020. The UK, which has been beset by similar denial movements, was nonetheless able to establish, as a legally binding target, an 80% reduction by 2050 and is a world leader on abatement.

In Australia, any prospect for consensus was lost when Tony Abbott used opposition to the Labor government’s proposed carbon market to replace Malcolm Turnbull as leader of the Federal Opposition in late 2009.

It used to be possible to hear right-wing politicians in Australia or the USA echo the Democratic congressman Henry Waxman who said last year:

“If my doctor told me I had cancer, I wouldn’t scour the country to find someone to tell me that I don’t need to worry about it.”

But such rationality has largely left the debate in both the US and Oz. In Australia, a reformulated carbon tax policy was enacted in November only after a highly partisan debate.

In Canada, the debate is a tad more balanced. The centre-right Liberal government in British Columbia passed the first carbon tax in North America in 2008, but the governing Federal Conservative party now offers a reliable “anti-Kyoto” partnership with Washington.

Overviews of the evidence for global warming, together with responses to common questions, are available from various sources, including:

  • Seven Answers to Climate Contrarian Nonsense, in Scientific American
  • Climate change: A Guide for the Perplexed, in New Scientist
  • Cooling the Warming Debate: Major New Analysis Confirms That Global Warming Is Real, in Science Daily
  • Remind me again: how does climate change work?, on The Conversation

It should be acknowledged in these analyses that all projections are based on mathematical models with a significant level of uncertainty regarding highly complex and only partially understood systems.

As 2011 Australian Nobel-Prize-winner Brian Schmidt explained while addressing a National Forum on Mathematical Education:

“Climate models have uncertainty and the earth has natural variation … which not only varies year to year, but correlates decade to decade and even century to century. It is really hard to design a figure that shows this in a fair way — our brain cannot deal with the correlations easily.

“But we do have mathematical ways of dealing with this problem. The Australian academy reports currently indicate that the models with the effects of CO₂ are with 90% statistical certainty better at explaining the data than those without.

“Most of us who work with uncertainty know that 90% statistical uncertainty cannot be easily shown within a figure — it is too hard to see …”

“ … Since predicting the exact effects of climate change is not yet possible, we have to live with uncertainty and take the consensus view that warming can cover a wide range of possibilities, and that the view might change as we learn more.”

But uncertainty is no excuse for inaction. The proposed counter-measures (e.g. infrastructure renewal and modernisation, large-scale solar and wind power, better soil remediation and water management, not to mention carbon taxation) are affordable and most can be justified on their own merits, while the worst-case scenario — do nothing while the oceans rise and the climate changes wildly — is unthinkable.

Some in the first world protest that any green energy efforts are dwarfed by expanding energy consumption in China and elsewhere. Sure, China’s future energy needs are prodigious, but China also now leads the world in green energy investment.

By blaiming others and focusing the debate on the level of human responsibility for warming and about the accuracy of predictions, the deniers have managed to derail long-term action in favour of short-term economic policies.

Who in the scientific community is promoting the denial of global warming? As it turns out, the leading figures in this movement have ties to conservative research institutes funded mostly by large corporations, and have a history of opposing the scientific consensus on issues such as tobacco and acid rain.

What’s more, those who lead the global warming denial movement – along with creationists, intelligent design writers and the “mathematicians” who flood our email inboxes with claims that pi is rational or other similar nonsense – are operating well outside the established boundaries of peer-reviewed science.

Austrian-born American physicist Fred Singer, arguably the leading figure of the denial movement, has only six peer-reviewed publications in the climate science field, and none since 1997.

After all, when issues such as these are “debated” in any setting other than a peer-reviewed journal or conference, one must ask: “If the author really has a solid argument, why isn’t he or she back in the office furiously writing up this material for submission to a leading journal, thereby assuring worldwide fame and glory, not to mention influence?”

In most cases, those who attempt to grab public attention through other means are themselves aware they are short-circuiting the normal process, and that they do not yet have the sort of solid data and airtight arguments that could withstand the withering scrutiny of scientific peer review.

When they press their views in public to a populace that does not understand how the scientific enterprise operates, they are being disingenuous.

With regards to claims scientists are engaged in a “conspiracy” to hide the “truth” on an issue such as global warming or evolution, one should ask how a secret “conspiracy” could be maintained in a worldwide, multicultural community of hundreds of thousands of competitive researchers.

As Benjamin Franklin wrote in his Poor Richard’s Almanac: “Three can keep a secret, provided two of them are dead.” Or as one of your present authors quipped, tongue-in-cheek, in response to a state legislator who was skeptical of evolution: “You have no idea how humiliating this is to me — there is a secret conspiracy among leading scientists, but no-one deemed me important enough to be included!”

There’s another way to think about such claims: we have tens-of-thousands of senior scientists in their late-fifties or early-sixties who have seen their retirement savings decimated by the recent stock market plunge. These are scientists who now wonder if the day will ever come when they are financially well-off-enough to do their research without the constant stress and distraction of applying for grants (the majority of which are never funded).

All one of these scientists has to do to garner both worldwide fame and considerable fortune (through book contracts, the lecture circuit and TV deals) is to call a news conference and expose “the truth”. So why isn’t this happening?

The system of peer-reviewed journals and conferences sponsored by major professional societies is the only proper forum for the presentation and debate of new ideas, in any field of science or mathematics.

It has been stunningly successful: errors have been uncovered, fraud has been rooted out and bogus scientific claims (such as the 1903 N-ray claim, the 1989 cold fusion claim, and the more-recent assertion of an autism-vaccination link) have been debunked.

This all occurs with a level of reliability and at a speed that is hard to imagine in other human endeavours. Those who attempt to short-circuit this system are doing potentially irreparable harm to the integrity of the system.

They may enrich themselves or their friends, but they are doing grievous damage to society at large.

For more such insights, log into www.international-maths-challenge.com.

*Credit for article given to Jonathan Borwein (Jon) and David H. Bailey*


Hot and bothered: the uncertain mathematics of global warming

These are painful times for those hoping to see an international consensus and substantive action on global warming.

In the US, Republican presidential front-runner Mitt Romney said in June 2011: “The world is getting warmer” and “humans have contributed” but in October 2011 he backtracked to: “My view is that we don’t know what’s causing climate change on this planet.”

His Republican challenger Rick Santorum added: “We have learned to be sceptical of ‘scientific’ claims, particularly those at war with our common sense” and Rick Perry, who suspended his campaign to become the Republican presidential candidate last month, stated flatly: “It’s all one contrived phony mess that is falling apart under its own weight.”

Meanwhile, the scientific consensus has moved in the opposite direction. In a study published in October 2011, 97% of climate scientists surveyed agreed global temperatures have risen over the past 100 years. Only 5% disagreed that human activity is a significant cause of global warming.

The study concluded in the following way: “We found disagreement over the future effects of climate change, but not over the existence of anthropogenic global warming.

“Indeed, it is possible that the growing public perception of scientific disagreement over the existence of anthropocentric warming, which was stimulated by press accounts of [the UK’s] ”Climategate“ is actually a misperception of the normal range of disagreements that may persist within a broad scientific consensus.”

More progress has been made in Europe, where the EU has established targets to reduce emissions by 20% (from 1990 levels) by 2020. The UK, which has been beset by similar denial movements, was nonetheless able to establish, as a legally binding target, an 80% reduction by 2050 and is a world leader on abatement.

In Australia, any prospect for consensus was lost when Tony Abbott used opposition to the Labor government’s proposed carbon market to replace Malcolm Turnbull as leader of the Federal Opposition in late 2009.

It used to be possible to hear right-wing politicians in Australia or the USA echo the Democratic congressman Henry Waxman who said last year:

“If my doctor told me I had cancer, I wouldn’t scour the country to find someone to tell me that I don’t need to worry about it.”

But such rationality has largely left the debate in both the US and Oz. In Australia, a reformulated carbon tax policy was enacted in November only after a highly partisan debate.

In Canada, the debate is a tad more balanced. The centre-right Liberal government in British Columbia passed the first carbon tax in North America in 2008, but the governing Federal Conservative party now offers a reliable “anti-Kyoto” partnership with Washington.

Overviews of the evidence for global warming, together with responses to common questions, are available from various sources, including:

  • Seven Answers to Climate Contrarian Nonsense, in Scientific American
  • Climate change: A Guide for the Perplexed, in New Scientist
  • Cooling the Warming Debate: Major New Analysis Confirms That Global Warming Is Real, in Science Daily
  • Remind me again: how does climate change work? on The Conversation

It should be acknowledged in these analyses that all projections are based on mathematical models with a significant level of uncertainty regarding highly complex and only partially understood systems.

As 2011 Australian Nobel-Prize-winner Brian Schmidt explained while addressing a National Forum on Mathematical Education:

“Climate models have uncertainty and the earth has natural variation … which not only varies year to year, but correlates decade to decade and even century to century. It is really hard to design a figure that shows this in a fair way — our brain cannot deal with the correlations easily.

“But we do have mathematical ways of dealing with this problem. The Australian academy reports currently indicate that the models with the effects of CO₂ are with 90% statistical certainty better at explaining the data than those without.

“Most of us who work with uncertainty know that 90% statistical uncertainty cannot be easily shown within a figure — it is too hard to see …”

“ … Since predicting the exact effects of climate change is not yet possible, we have to live with uncertainty and take the consensus view that warming can cover a wide range of possibilities, and that the view might change as we learn more.”

But uncertainty is no excuse for inaction. The proposed counter-measures (e.g. infrastructure renewal and modernisation, large-scale solar and wind power, better soil remediation and water management, not to mention carbon taxation) are affordable and most can be justified on their own merits, while the worst-case scenario — do nothing while the oceans rise and the climate changes wildly — is unthinkable.

Some in the first world protest that any green energy efforts are dwarfed by expanding energy consumption in China and elsewhere. Sure, China’s future energy needs are prodigious, but China also now leads the world in green energy investment.

By blaiming others and focusing the debate on the level of human responsibility for warming and about the accuracy of predictions, the deniers have managed to derail long-term action in favour of short-term economic policies.

Who in the scientific community is promoting the denial of global warming? As it turns out, the leading figures in this movement have ties to conservative research institutes funded mostly by large corporations, and have a history of opposing the scientific consensus on issues such as tobacco and acid rain.

What’s more, those who lead the global warming denial movement – along with creationists, intelligent design writers and the “mathematicians” who flood our email inboxes with claims that pi is rational or other similar nonsense – are operating well outside the established boundaries of peer-reviewed science.

Austrian-born American physicist Fred Singer, arguably the leading figure of the denial movement, has only six peer-reviewed publications in the climate science field, and none since 1997.

After all, when issues such as these are “debated” in any setting other than a peer-reviewed journal or conference, one must ask: “If the author really has a solid argument, why isn’t he or she back in the office furiously writing up this material for submission to a leading journal, thereby assuring worldwide fame and glory, not to mention influence?”

In most cases, those who attempt to grab public attention through other means are themselves aware they are short-circuiting the normal process, and that they do not yet have the sort of solid data and airtight arguments that could withstand the withering scrutiny of scientific peer review.

When they press their views in public to a populace that does not understand how the scientific enterprise operates, they are being disingenuous.

With regards to claims scientists are engaged in a “conspiracy” to hide the “truth” on an issue such as global warming or evolution, one should ask how a secret “conspiracy” could be maintained in a worldwide, multicultural community of hundreds of thousands of competitive researchers.

As Benjamin Franklin wrote in his Poor Richard’s Almanac: “Three can keep a secret, provided two of them are dead.” Or as one of your present authors quipped, tongue-in-cheek, in response to a state legislator who was skeptical of evolution: “You have no idea how humiliating this is to me — there is a secret conspiracy among leading scientists, but no-one deemed me important enough to be included!”

There’s another way to think about such claims: we have tens-of-thousands of senior scientists in their late-fifties or early-sixties who have seen their retirement savings decimated by the recent stock market plunge. These are scientists who now wonder if the day will ever come when they are financially well-off-enough to do their research without the constant stress and distraction of applying for grants (the majority of which are never funded).

All one of these scientists has to do to garner both worldwide fame and considerable fortune (through book contracts, the lecture circuit and TV deals) is to call a news conference and expose “the truth”. So why isn’t this happening?

The system of peer-reviewed journals and conferences sponsored by major professional societies is the only proper forum for the presentation and debate of new ideas, in any field of science or mathematics.

It has been stunningly successful: errors have been uncovered, fraud has been rooted out and bogus scientific claims (such as the 1903 N-ray claim, the 1989 cold fusion claim, and the more-recent assertion of an autism-vaccination link) have been debunked.

This all occurs with a level of reliability and at a speed that is hard to imagine in other human endeavours. Those who attempt to short-circuit this system are doing potentially irreparable harm to the integrity of the system.

They may enrich themselves or their friends, but they are doing grievous damage to society at large.

For more such insights, log into our website https://international-maths-challenge.com

Credit of the article given to Jonathan Borwein (Jon), University of Newcastle and David H. Bailey, University of California, Davis


Applying math to design new materials and processes for drug manufacturing

Richard Braatz. Photo: Dominick Reuter

Trial-and-error experimentation underlies many biomedical innovations. This classic method — define a problem, test a proposed solution, learn from failure and try again — is the main route by which scientists discover new biomaterials and drugs today. This approach is also used to design ways of manufacturing these new materials, but the process is immensely time-consuming, producing a successful therapeutic product and its manufacturing process only after years of experiments, at considerable expense.

Richard Braatz, the Edwin R. Gilliland Professor of Chemical Engineering at MIT, applies mathematics to streamline the development of pharmaceuticals. Trained as an applied mathematician, Braatz is developing mathematical models to help scientists quickly and accurately design processes for manufacturing drug compounds with desired characteristics. Through mathematical simulations, Braatz has designed a system that significantly speeds the design of drug-manufacturing processes; he is now looking to apply the same mathematical approach to designing new biomaterials and nanoscale devices.

“Nanotechnology is very heavily experimental,” Braatz says. “There are researchers who do computations to gain insights into the physics or chemistry of nanoscale systems, but do not apply these computations for their design or manufacture. I want to push systematic design methods to the nanoscale, and to other areas where such methods aren’t really developed yet, such as biomaterials.”

From farm to formulas

Braatz’s own academic path was anything but systematic. He spent most of his childhood on an Oregon farm owned by his grandfather. Braatz says he absorbed an engineer’s way of thinking early on from his father, an electrician, by examining his father’s handiwork on the farm and reading his electrical manuals.

Braatz also developed a serious work ethic. From the age of 10, he awoke early every morning — even on school days — to work on the farm. In high school, he picked up a night job at the local newspaper, processing and delivering thousands of newspapers to stores and the post office, sometimes until just before dawn.

After graduating from high school in 1984, Braatz headed to Alaska for the summer. A neighbour had told him that work paid well up north, and Braatz took a job at a fish-processing facility, driving forklifts and hauling 100-pound bags of fishmeal 16 hours a day. He returned each summer for four years, eventually working his way up to plant operator, saving enough money each summer to pay for the next year’s tuition at Oregon State University.

As an undergraduate, Braatz first planned to major in electrical engineering. But finding the introductory coursework unstimulating — given the knowledge he’d absorbed from his father — he cast about for another major.

“There was no Internet back then, so you couldn’t Google; web searches didn’t exist,” Braatz says. “So I went to the library and opened an encyclopedia, and said, ‘OK, what other engineering [is] there?’”

Chemical engineering caught his eye; he had always liked and excelled at chemistry in high school. While pursuing a degree in chemical engineering, Braatz filled the rest of his schedule with courses in mathematics.

After graduation, Braatz went on to the California Institute of Technology, where he earned both a master’s and a PhD in chemical engineering. In addition to his research, Braatz took numerous math and math-heavy courses in electrical engineering, applied mechanics, chemical engineering and chemistry. The combination of real applications and mathematical theory revealed a field of study Braatz had not previously considered: applied mathematics.

“This training was a very good background for learning how to derive mathematical solutions to research problems,” Braatz says.

A systems approach

Soon after receiving his PhD, Braatz accepted an assistant professorship at the University of Illinois at Urbana-Champaign (UIUC). There, as an applied mathematician, he worked with researchers to tackle problems in a variety of fields: computer science, materials science, and electrical, chemical and mechanical engineering.

He spent eight years on a project spurred by a talk he attended at UIUC. In that talk, a representative of Merck described a major challenge in the pharmaceutical industry: controlling the size of crystals in the manufacture of any given drug. (The size and consistency of crystals determine, in part, a drug’s properties and overall efficacy.)

Braatz learned that while drug-manufacturing machinery was often monitored by sensors, much of the resulting data went unanalysed. He pored over the sensors’ data, and developed mathematical models to gain an understanding of what the sensors reveal about each aspect of the drug-crystallization process. Over the years, his team devised an integrated series of algorithms that combined efficiently designed experiments with mathematical models to yield a desired crystal size from a given drug solution. They worked the algorithms into a system that automatically adjusts settings at each phase of the manufacturing process to produce an optimal crystal size, based on a “recipe” given by the algorithms.

“Sometimes the recipes are very weird,” Braatz says. “It might be a strange path you have to follow to manufacture the right crystals.”

The automated system, which has since been adopted by Merck and other pharmaceutical companies, provides a big improvement in efficiency, Braatz says, avoiding the time-consuming trial-and-error approach many drug manufacturers had relied on to design a crystallization process for a new drug.

In 2010, Braatz moved to MIT, where he is exploring mathematical applications in nanotechnology and tissue engineering — in particular, models to help design new drug-releasing materials. Such materials have the potential to deliver controlled, continuous therapies, but designing them currently takes years of trial-and-error experiments.

Braatz’s group is designing mathematical models to give researchers instructions, for example, on how to design materials that locally release drugs into a body’s cells at a desired rate. Braatz says approaching such a problem from a systematic perspective could potentially save years of time in the development of a biomedical material of high efficacy.

“Anything is a win if you could reduce those experiments from 10 years to several years,” Braatz says. “We’re talking hundreds of millions, billions of dollars. And the effect on people’s lives, you can’t put a price tag on that.”

For more such insights, log into our website https://international-maths-challenge.com

Credit of the article given to Jennifer Chu, Massachusetts Institute of Technology


Good at Sudoku? Here’s Some You’ll Never Complete

There’s far more to the popular maths puzzle than putting numbers in a box.

Last month, a team led by Gary McGuire from University College Dublin in Ireland made an announcement: they had proven you can’t have a solvable Sudoku puzzle with less than 17 numbers already filled in.

Unlike most mathematical announcements, this was quickly picked up by the popular scientific media. Within a few days, the new finding had been announced in Nature and other outlets.

So where did this problem come from and why is its resolution interesting?

As you probably know, the aim of a Sudoku puzzle is to complete a partially-filled nine-by-nine grid of numbers. There are some guidelines: the numbers one to nine must appear exactly once each in every row, column and three-by-three sub-grid.

As with a crossword, a valid Sudoku puzzle must have a unique solution. There’s only one way to go from the initial configuration (with some numbers already filled in) to a completed grid.

Newspapers often grade their puzzles as easy, medium or hard, which will depend on how easy it is at every stage of solving the puzzle to fill in the “next” number. While a puzzle with a huge number of initial clues will usually be easy, it is not necessarily the case that a puzzle with few initial clues is difficult.

Reckon you can complete a 17-clue Sudoku puzzle? (answer below) Gordon Royle

When Sudoku-mania swept the globe in the mid-2000s, many mathematicians, programmers and computer scientists – amateur and professional – started to investigate Sudoku itself. They were less interested in solving individual puzzles, and more focused on asking and answering mathematical and/or computational questions about the entire universe of Sudoku puzzles and solutions.

As a mathematician specialising in the area of combinatorics (which can very loosely be defined as the mathematics of counting configurations and patterns), I was drawn to combinatorial questions about Sudoku.

I was particularly interested in the question of the smallest number of clues possible in a valid puzzle (that is, a puzzle with a unique solution).

In early 2005, I found a handful of 17-clue puzzles on a long-since forgotten Japanese-language website. By slightly altering these initial puzzles, I found a few more, then more, and gradually built up a “library” of 17-clue Sudoku puzzles which I made available online at the time.

Other people started to send me their 17-clue puzzles and I added any new ones to the list until, after a few years, I had collected more than 49,000 different 17-clue Sudoku puzzles.

By this time, new ones were few and far between, and I was convinced we had found almost all of the 17-clue puzzles. I was also convinced there was no 16-clue puzzle. I thought that demonstrating this would either require some new theoretical insight or clever programming combined with massive computational power, or both.

Either way, I thought proving the non-existence of a 16-clue puzzle was likely to be too difficult a challenge.

They key to McGuire’s approach was to tackle the problem indirectly. The total number of completed puzzles (that is, completely filled-in grids) is astronomical – 5,472,730,538 – and trying to test each of these to see if any choice of 16 cells from the completed grid forms a valid puzzle is far too time-consuming.

Instead, McGuire and colleagues used a different, indirect approach.

An “unavoidable set” in a completed Sudoku grid is a subset of the clues whose entries can be rearranged to leave another valid completed Sudoku grid. For a puzzle to be uniquely completable, it must contain at least one entry from every unavoidable set.

If a completed grid contains the ten-clue configuration in the left picture, then any valid Sudoku puzzle must contain at least one of those ten clues. If it did not, then in any completed puzzle, those ten positions could either contain the left-hand configuration or the right-hand configuration and so the solution would not be unique.

Gordon Royle

While finding all the unavoidable sets in a given grid is difficult, it’s only necessary to find enough unavoidable sets to show that no 16 clues can “hit” them all. In the process of resolving this question, McGuire’s team developed new techniques for solving the “hitting set” problem.

It’s a problem that has many other applications – any situation in which a small set of resources must be allocated while still ensuring that all needs are met by at least one of the selected resources (i.e. “hit”) can be modelled as a hitting set problem.

Once the theory and software was in place, it was then a matter of running the programs for each of the 5.5 billion completed grids. As you can imagine, this required substantial computing power.

After 7 million core-CPU hours on a supercomputer (the equivalent of a single computer running for 7 million hours) and a year of actual elapsed time, the result was announced a few weeks ago, on New Year’s Day.

So is it correct?

The results of any huge computation should be evaluated with some caution, if not outright suspicion, especially when the answer is simply “no, doesn’t exist”, because there are many possible sources of error.

But in this case, I feel the result is far more likely to be correct than otherwise, and I expect it to be independently-verified before too long. In addition, McGuire’s team built on many different ideas, discussions and computer programs that were thrashed out between interested contributors to various online forums devoted to the mathematics of Sudoku. In this respect, many of the basic components of their work have already been thoroughly tested.

Solution to the 17-clue Sudoku puzzle, above. Gordon Royle

And so back to the question: why is the resolution of this problem interesting? And is it important?

Certainly, knowing that the smallest Sudoku puzzles have 17 clues is not in itself important. But the immense popularity of Sudoku meant that this question was popularised in a way that many similar questions have never been, and so it took on a special role as a “challenge question” testing the limits of human knowledge.

The school students to whom I often give outreach talks have no real concept of the limitations of computers and mathematics. In my past talks, these students were almost always astonished to know that the answer to such a simple question was just not known.

And now, in my future outreach talks, I will describe how online collaboration, theoretical development and significant computational power were combined to solve this problem, and how this process promises to play an increasing role in the future development of mathematics.


For more such insights, log into www.international-maths-challenge.com.

*Credit for article given to Gordon Royle*