The math behind the perfect free throw

Some 20 years ago, my colleague Dr. Chau Tran and I developed a way to simulate the trajectories of millions of basketballs on the computer.

We went to the coaches and assistant coaches at North Carolina State University, where we are based, and told them we had this uncommon ability to study basketball shots very carefully.

Their first question was simple: “What’s the best free throw?” Should the shooter aim towards the front of the hoop or the back? Does it depend on whether the shooter is short or tall?

Math offers a unique perspective. It speeds up the amount of time it takes to see the patterns behind the best shots. For the most part, we discovered things that the players and coaches already knew – but every so often, we came across a new insight.

Simulating millions of shots

From a mathematical viewpoint, basketball is a game of trajectories. These trajectories are unique in that the ball’s motion doesn’t change much when it’s flying through the air, but then rapidly changes over milliseconds when the ball collides with the the hoop or the backboard.

To simulate millions of trajectories without the code taking too long to run, we tried any trick we could think of. We figured out how to go from modestly changing motion to rapidly changing motion, such as when the ball bounces on the rim or off the backboard. We learned how to turn large numbers of trajectories into statistical probabilities. We even created fictitious trajectories in which the ball magically passes through all of the physical obstacles (hoop, backboard, back plate) except for one, to see where it collides first.

How a mathematician sees a free throw. Larry Silverberg, CC BY-SA


The free throw was the first shot that my colleague and I studied in detail. In close games, teams can win and lose at the free-throw line. What’s more, the free throw is uncontested, so perfection in the free throw can pay off big. Top teams tend to shoot the free shot well.

Our program could tell us what chances the shooter had in sinking a free throw – and help us figure out what he was doing right or wrong.

Breaking down the free throw

We studied the free throw for about five years.

One of the first things we learned from our simulations and by watching TV footage was that players with the same consistency can shoot free throws with anywhere from 75 to 90 percent accuracy. The difference was that the 90 percent players were being consistent at the right shot – the best trajectory.

The fate of a free throw is set the instant the ball leaves the player’s fingertips, so we looked closely at the “launch conditions” of the shot. The ball is located at some height above the floor. It has a rate at which it is spinning backwards (called backspin), and it has a launch speed and a launch angle. Since the shooter never launches the ball the same way, small differences account for a shooter’s consistency.

We found that about 3 hertz of backspin is the best amount; more than that does not help. It takes about 1 second for a ball to reach the basket, so 3 hertz equates to three revolutions in the air, from the instant the ball leaves the player’s hands to when it reaches the basket.

Next, assuming the player releases the ball at 7 feet above the ground, a launch angle of about 52 degrees is best. In that angle, the launch speed is the lowest, and the probability of the shot being successful is the greatest. At 52 degrees, the shooter can be off a degree or more either way without a large effect on the shot’s success.

However, launch speed is quite the opposite. It’s the hardest variable for a player to control. Release the ball too slowly and the shot is short; release it too fast and the shot is long. A player needs to memorize the motion of her entire body during release to impart the same speed consistently.

All else being the same, players who release from higher above the floor have a higher shooting percentage. That’s interesting, because our coaches at N.C. State and others I have talked say that taller players tend to shoot the free throw worse than shorter players do. It seems that the shorter players must try harder.

The last release condition was the most surprising: the aim point of the free throw. We found that the player should aim the ball to the back of the rim. Basically, the back of the rim is more forgiving than the front of the rim. At a release height of 7 feet, the gap between the ball and the back of the ring should be less than 2 inches. A small gap is best whether launching at low or high release heights.

Lessons learned

So what does this all mean for players out there aspiring to improve their free throw?

Our research suggests that players should aim the ball beyond the center of the rim. Launch the ball at a high angle and as high above the ground as possible. (The ball, at the highest point of its arc, should reach the top of the backboard.) Line up the ball to eliminate the side angle. And try to launch the ball with smooth body motion, to produce a consistent launch speed.

In the past few years, we’ve expanded our work to study where the best bank shots strike the backboard and developed a tool for anyone who wants to perfect it.

With tournament play underway, I’m reminded of how competitive the game has become, and how it has truly become a game of inches. As an old basketball player, like many of you, I enjoy watching the game – and, every so often, catching a glimpse of that perfect free throw.

For more insights like this, visit our website at www.international-maths-challenge.com.
Credit of the article given to Larry M. Silverberg


The genius at Guinness and his statistical legacy

This St Patrick’s Day, revellers around the world will crowd the streets seeking one of Ireland’s national drinks: a pint of Guinness. But besides this tasty stout, one of the most fundamental and commonly used tools of science also has its origins at the Guinness brewery.

Towards the end of the 19th century, Guinness was scaling up its operations, and was interested in applying a scientific approach to all aspects of Guinness production: from barley growth right through to the Guinness taste.

Before adopting a scientific approach, brewers at Guinness relied on subjective methods, such as the appearance and scent of hops, to assess produce quality.

Once scientific brewers were recruited, a more objective approach was taken. The first scientific brewer, Thomas Bennett Case, was hired in 1893 and he believed that the amount of soft resins in hops was related to the quality of Guinness. He was therefore keen to estimate the amount of soft resin in particular crops of hops.

The challenge facing Case was that he, like any scientist, could not measure everything at once. It was not possible for him to assess the amount of soft resin in every single one of the countless hop flowers (added by the thousands to enormous vats of soon-to-be Guinness) in his charge.

Instead, he took a sample of hops (11 measurements of 50 grams each) and calculated the average soft resin content. His hope was that the average soft resin content of his small sample could be used to estimate the soft resin content of the entire crop (what statisticians would call “the population”) of hops.

For comparison, a colleague took a further 14 measurements of 50 grams each from the same lot of hops. Case found a small difference in the average amount of soft resins between these samples.

He was stumped. Were these differences in hop content due to real differences across the whole hop crop, or were they due to random error introduced by using small sample sizes?

Size matters

At the time, statistics relied on what is called “large-sample theory”, which unsurprisingly requires large samples (150 or more) to work. Applying it to problems involving small samples (like those faced by Case at Guinness) was difficult.

William Sealy Gosset. Wikimedia

This was the problem that William Sealy Gosset, a recent graduate of chemistry and mathematics at Oxford University, was keen to address. Gosset began work as an apprentice brewer at the Guinness factory in Dublin in 1899.

In 1906, Gosset, now a self-taught statistician, went to study with Karl Pearson, a leading figure in statistics, at University College London.

Gosset was keen to adapt Pearson’s large-sample methods to deal with the small samples they used at Guinness. There, he developed his ideas and readied them for publication.

However, until the late 1930s, Guinness would not allow employees to publish under their own names for fear that other brewers would learn of their scientific approaches to beer. As a result, Gosset published his most important paper, The Probable Error of a Mean, under the pseudonym “Student” in the journal Biometrika in 1908.

The ultimate ‘Student’ author’s journal paper. Biometrika (screen grab)


This was the origin of Student’s t-test, a fundamental statistical method that is widely used to this day.

Student’s t-test

The problem that Case faced was that using small samples of hops introduces a new source of uncertainty into the analysis, leaving him less able to distinguish between real, true differences between two batches of hops and differences due to this uncertainty.

Gosset’s genius was to devise a way of accounting for this: the t-distribution. This mathematically defines the relationship between the size of sample and the amount of uncertainty this imposes.

Basically, when carrying out experiments, the t-distribution (and the famous t-test that depends upon it) allows beer brewers and scientists alike to account for the size of the sample they have used in their work, and then define just how confident they are in their findings.

Sticking with the brewers’ case, you would have information from the two samples, such as the average soft resin content of the hops and the spread of each measurement around the average of each sample.

Without going into too much detail, the t-test helps to determine whether there is evidence of a difference between the two averages based on the sample size (that is, the number of measurements taken from a particular hop crop). In the brewers’ case they were looking for zero difference between their two samples.

A lasting legacy

Gosset’s method did not draw the attention of the statistical community until another leading statistical figure, Ronald Aylmer Fisher, enthusiastically embraced the method and provided a mathematical proof.

Since that time, the t-test has been used to tackle a huge range of scientific problems, from the assessment of brain function in stroke patients , to the measurement of carbon and nitrogen content in coastal ocean-dwelling bacteria, to how the behaviour of coal miners may or may not lead to accidents (the consumption of Guinness by these miners was, perhaps unsurprisingly, not a focus of the study).

In fact, Student’s t-test has been employed in essentially every field of scientific endeavour: biology, physics, psychology, biometrics, economics and medicine.

It is a staple of undergraduate statistics taught across these disciplines, but few may be aware of Gosset’s role in creating the t-test and his beery reasons for doing so.

Gosset remained at Guinness throughout his life as Head Experimental Brewer, then Head of the Statistics Department he formed at Guinness, before his promotion to Head Brewer for the new Guinness brewery in London in 1935. He published several papers as “Student” but his true identity was only publicly revealed upon his death in 1937.

So, if you’re drinking a Guinness this St Patrick’s day, raise a glass to the little-known character who played a pivotal role in beer, statistics and indeed, modern science: William Sealy Gosset.

For more insights like this, visit our website at www.international-maths-challenge.com.
Credit of the article given to Karen Lamb, David Farmer


On his 250th birthday, Joseph Fourier’s math still makes a difference

March 21 marks the 250th birthday of one of the most influential mathematicians in history. He accompanied Napoleon on his expedition to Egypt, revolutionized science’s understanding of heat transfer, developed the mathematical tools used today to create CT and MRI scan images, and discovered the greenhouse effect.

His name was Joseph Fourier. He wrote of mathematics: “There cannot be a language more universal and more simple, more free from errors and obscurities … Mathematical analysis is as extensive as nature itself, and it defines all perceptible relations.” Fourier’s work continues to shape life today, especially for people like ourselves working in fields such as mathematics and radiology.

Fourier’s life

Mathematician and physicist Joseph Fourier. Wikimedia Commons

As a troubled orphan in France, Fourier was transformed by his first encounter with mathematics. Thanks to a local bishop who recognized his talent, Fourier received an education through Benedictine monks. As a college student, he so loved math that he collected discarded candle stumps so he could continue his studies after others had gone to bed.

As a young man, Fourier was soon swept up by the French Revolution. However, he became disenchanted by its excessive brutality, and his protests landed him in prison for part of 1794. After his release, he was appointed to the faculty of an engineering school. There he proved his genius by substituting for ill colleagues, teaching subjects ranging from physics to classics.

Traveling with Napoleon to Egypt in 1798, Fourier was appointed secretary of the Egyptian Institute, which Napoleon modeled on the Institute of France. When the British fleet stranded the French forces, he organized the manufacture of weapons and munitions to permit the French to continue fighting. Fourier returned to France after the British navy forced the French to surrender. Even in the midst of such difficult circumstances, he managed to publish a number of mathematical papers.

Heat transfer

One of the most important fruits of Fourier’s studies concerns heat.

Fourier’s law states that heat transfers through a material at a rate proportional to both the difference in temperature between different areas and to the area across which the transfer takes place. For example, people who are overheated can cool off quickly by getting to a cool place and exposing as much of their body to it as possible.

Fourier’s work enables scientists to predict the future distribution of heat. Heat is transferred through different materials at different rates. For example, brass has a high thermal conductivity. Air is poorly conductive, which is why it’s frequently used in insulation.

Remarkably, Fourier’s equation applies widely to matter, whether in the form of solid, liquid or gas. It powerfully shaped scientists’ understanding of both electricity and the process of diffusion. It also transformed scientists’ understanding of flow in nature generally – from water’s passage through porous rocks to the movement of blood through capillaries.

Fourier transform and CT

Today, when helping to care for patients, radiologists rely on another mathematical discovery of Fourier’s, now referred to as the “Fourier transform.”

In CT scans, doctors send X-ray beams through a patient from multiple different directions. Some X-rays emerge from the other side, where they can be measured, while others are blocked by structures within the body.

Modern medical imaging machines rely on Fourier’s transform. zlikovec/shutterstock.com

With many such measurements taken at many different angles, it becomes possible to determine the degree to which each tiny block of tissue blocked the beam. For example, bone blocks most of the X-rays, while the lungs block very little. Through a complex series of computations, it’s possible to reconstruct the measurements into two-dimensional images of a patient’s internal anatomy.

Thanks to Fourier and today’s powerful computers, doctors can create almost instantaneous images of the brain, the pulmonary arteries, the appendix and other parts of the body. This in turn makes it possible to confirm or rule out the presence of issues such as blood clots in the pulmonary arteries or inflammation of the appendix. It’s difficult to imagine practicing medicine today without such CT images.

Greenhouse effect

Fourier is generally regarded as the first scientist to notice what we today call the greenhouse effect.

His interest was piqued when he observed that a planet as far away from the sun as Earth should be considerably cooler. He hypothesized that something about the Earth – in particular, its atmosphere – must enable it to trap solar radiation that would otherwise simply radiate back out into space.

Fourier created a model of the Earth involving a box with a glass cover. Over time, the temperature in the box rose above that of the surrounding air, suggesting that the glass continually trapped heat. Because his model resembled a greenhouse in some respects, this phenomenon came to be called the “greenhouse effect.”

Later, scientist John Tyndall discovered that carbon dioxide can play the role of heat trapper.

Life on earth as we know it would not be possible without the greenhouse effect. However, today scientists tend to be more concerned about an excess of greenhouse gases. Mathematical models suggest that as carbon dioxide accumulates, heat may be trapped more quickly, resulting in elevated global average temperatures, melting polar ice caps and rising sea levels.

Fourier’s impact

Fourier received many honors during his lifetime, including election to the French Academy of Science.

Some believed, perhaps speciously, that Fourier’s attraction to heat may have hastened his death. He was known to climb into saunas in multiple layers of clothes, and his acquaintances claimed that he kept his rooms hotter than Hades. At any rate, in May 1830, he died of an aneurysm at the age of 63.

Today, Fourier’s name is inscribed on the Eiffel Tower. But more importantly, it is immortalized in Fourier’s law and the Fourier transform, enduring emblems of his belief that mathematics holds the key to the universe.

For more insights like this, visit our website at www.international-maths-challenge.com.
Credit of the article given to Richard Gunderman, David Gunderman


Measure Earth’s Circumference with a Shadow

Credit: The earth is massive, but you don’t need a massive ruler to measure its size. All you need are a few household items–and little bit of geometry! George Retseck

A geometry science project from Science Buddies

Introduction
If you wanted to measure the circumference of Earth, how long would your tape measure have to be? Would you need to walk the whole way around the world to find the answer? Do you think you can do it with just a meterstick in one location? Try this project to find out!

Before you begin, however, it is important to note this project will only work within about two weeks of either the spring or fall equinoxes (usually around March 20 and September 23, respectively).

Background
What is Earth’s circumference? In the age of modern technology this may seem like an easy question for scientists to answer with tools such as satellites and GPS—and it would be even easier for you to look up the answer online. It might seem like it would be impossible for you to measure the circumference of our planet using only a meterstick. The Greek mathematician Eratosthenes, however, was able to estimate Earth’s circumference more than 2,000 years ago, without the aid of any modern technology. How? He used a little knowledge about geometry!

At the time Eratosthenes was in the city of Alexandria in Egypt. He read that in a city named Syene south of Alexandria, on a particular day of the year at noon, the sun’s reflection was visible at the bottom of a deep well. This meant the sun had to be directly overhead. (Another way to think about this is that perfectly vertical objects would cast no shadow.) On that same day in Alexandria a vertical object did cast a shadow. Using geometry, he calculated the circumference of Earth based on a few things that he knew (and one he didn’t):

  • He knew there are 360 degrees in a circle.
  • He could measure the angle of the shadow cast by a tall object in Alexandria.
  • He knew the overland distance between Alexandria and Syene. (The two cities were close enough that the distance could be measured on foot.)
  • The only unknown in the equation is the circumference of Earth!

The resulting equation was:

Angle of shadow in Alexandria / 360 degrees = Distance between Alexandria and Syene / Circumference of Earth

In this project you will do this calculation yourself by measuring the angle formed by a meterstick’s shadow at your location. You will need to do the test near the fall or spring equinoxes, when the sun is directly overhead at Earth’s equator. Then you can look up the distance between your city and the equator and use the same equation Eratosthenes used to calculate Earth’s circumference. How close do you think your result will be to the “real” value?

There is a geometric rule about the angles formed by a line that intersects two parallel lines. Eratosthenes assumed the sun was far enough away from our planet that its rays were effectively parallel when they arrived at Earth. This told him the angle of the shadow he measured in Alexandria was equal to the angle between Alexandria and Syene, measured at Earth’s center. If this sounds confusing, don’t worry! It is much easier to visualize with a picture. See the references in the “More to explore” section for some helpful diagrams and a more detailed explanation of the geometry involved.

Materials

  • Sunny day on or near the spring or fall equinoxes (about March 20 or September 23, respectively)
  • Flat, level ground that will be in direct sunlight around noon
  • Meterstick
  • Volunteer to help hold the meterstick while you take measurements (Or, if you are doing the test alone, you can use a bucket of sand or dirt to insert one end of the meter stick to hold it upright.)
  • Stick or rock to mark the location of the shadow
  • Calculator
  • Protractor
  • Long piece of string
  • Optional: plumb bob (you can make one by tying a small weight to the end of a string) or post level to make sure the meter stick is vertical

Preparation

  • Look at your local weather forecast a few days in advance and pick a day where it looks like it will be mostly sunny around noon. (You have a window of several weeks to do this project, so don’t get discouraged if it turns out to be cloudy! You can try again.)
  • Look up the sunrise and sunset times for that day in your local newspaper or on a calendar, weather or astronomy Web site. You will need to calculate “solar noon,” the time exactly halfway between sunrise and sunset, which is when the sun will be directly overhead. This will probably not be exactly 12 o’clock noon.
  • Go outside and set up for your materials about 10 minutes before solar noon so you have everything ready.

Procedure

  • Set up your meter stick vertically, outside in a sunny spot just before solar noon.
  • If you have a volunteer to help, have them hold the meterstick. Otherwise, bury one end of the meterstick in a bucket of sand or dirt so it stays upright.
  • If you have a post level or plumb bob, use it to make sure the meterstick is perfectly vertical. Otherwise, do your best to eyeball it.
  • At solar noon, mark the end of the meterstick’s shadow on the ground with a stick or a rock.
  • Draw an imaginary line between the top of the meterstick and the tip of its shadow. Your goal is to measure the angle between this line and the meterstick. Have your volunteer stretch a piece of string between the top of the meterstick and the end of its shadow.
  • Use a protractor to measure the angle between the string and the meterstick in degrees. Write this angle down.
  • Look up the distance between your city and the equator.
  • Calculate the circumference of the Earth using this equation:

Circumference = 360 x distance between your city and the equator / angle of shadow that you measured

  • What value do you get? How close is your answer to the true circumference of Earth (see “Observations and results” section)?
  • Extra: Try repeating your test on different days before, on and after the equinox; or at different times before, at and after solar noon. How much does the accuracy of your answer change?
  • Extra: Ask a friend or family member in a different city to try the test on the same day and compare your results. Do you get the same answer?

Observations and results
In 200 B.C. Eratosthenes estimated Earth’s circumference at about 46,250 kilometers (28,735 miles). Today we know our planet’s circumference is roughly 40,000 kilometers (24,850 miles). Not bad for a more than 2,000-year-old estimate made with no modern technology! Depending on the error in your measurements—such as the exact day and time you did the test, how accurately you were able to measure the angle or length of the shadow and how accurately you measured the distance between your city and the equator—you should be able to calculate a value fairly close to 40,000 kilometers (within a few hundred or maybe a few thousand). All without leaving your own backyard!

For more insights like this, visit our website at www.international-maths-challenge.com.

Credit of the article given to Science Buddies & Ben Finio


Learning from Bertrand Russell in today’s tumultuous world

They come from all over the world to see, touch and read the originals of tens of thousands of letters, to study boxes of drafts and revisions of his ideas and mathematical equations, to understand his complex personal relationships and to explore the commitment to peace and opposition to nuclear weapons that landed him in jail more than once.

Visitors love to look at the wiry thinker’s easy chair and imagine what he must have been pondering as he sat there.

These, together with a Nobel Prize for Literature, a desk, a tweed suit and a trademark pipe, were the belongings of Bertrand Russell, modern philosopher, social critic, mathematician and anti-war crusader who died in 1970 just a couple of years short of his 100th birthday on May 18.

Canada’s McMaster University obtained Russell’s vast archives 50 years ago this year, and the parade of scholars who continue to use them affirms that his ideas are at least as relevant as ever — perhaps more so today, when the threat to world peace seems so grave.

How can the ideas of a man who started teaching at the London School of Economics in 1896 — and who corresponded with Jean-Paul Sartre, Ho Chi Minh, T.S. Eliot and so many others, and lived long enough to protest both the First World War and the Vietnam War — still be so meaningful?

Russell remains pertinent

A few years ago, I was home with my teenaged son, Michael. He was supposed to be working on an essay for a high school philosophy course, but I could hear the distinct sound of laughter coming from his room.

I asked him what was so funny, and was happily surprised by his answer: He was reading Bertrand Russell’s History of Western Philosophy and found Russell’s wry commentary very funny.

If I had ever needed affirmation that Russell remains pertinent, I certainly had it, though few would doubt the value of a life’s work that generated more than 4,000 publications on such disparate topics as truth, geometry, morality, politics and the future of humanity.

Not even imprisonment could stem Russell’s spirit or the flow of his ideas. He managed to write his Introduction to Mathematical Philosophy while incarcerated for pacifism during the First World War, and even sent the warden a copy to thank him for the opportunity.

Russell is seen in this photo taken in 1939 at UCLA, where he was working as a philosophy professor at the time. (Creative Commons)

Russell’s papers and ephemera are gathered in the McMaster library’s William Ready Division of Archives and Research Collections, where his desk and chair and more than 3,000 books from his personal library are shelved in the same order in which he kept them.

The fact that these archives ever reached McMaster is testament to the vision and audacity of the chief librarian of the time, William Ready, who, with the firm backing of McMaster’s president Harry Thode, brought the load of trunks, boxes and cabinets across the Atlantic from Wales after outbidding serious international competitors.

Opposed the Vietnam War

Ready’s chances at securing the archives had been boosted by Russell’s opposition to the U.S. involvement in the Vietnam War, which dampened the enthusiasm of potential American buyers.

Ready was a literary adventurer and his coup with the Russell archives came as he also managed to land Anthony Burgess’s typescript of A Clockwork Orange and extensive collections of rare books that today comprise an internationally renowned collection.

Thode, a world-renowned nuclear scientist, had recently secured a nuclear research reactor for McMaster’s campus and, as university president, was eager to balance that scientific triumph by securing a research asset of similar importance for the humanities.

Half a century later, the reactor continues to facilitate scientific discovery and to provide valuable medical isotopes while, across campus, the Russell archives remain a magnet for scholars the world over.

Russell student still tends to collection

Amazingly, the Russell archives and its supporting collections continue to be under the able and conscientious care of a man who had worked for Russell himself.

Ken Blackwell, a Canadian, was a young man when he went to work for Russell — a philosopher in his own right and a devoted student of Russell who landed a job organizing the Russell collection for eventual sale.

When Ready imported the collection, Blackwell came with it, and he stayed. Today, he likes to joke about emerging from one of the packing boxes. He spent the rest of his career on those papers and, in his retirement, continues to do so as a volunteer.

In addition to their own research value, Russell’s archives have helped McMaster draw other collections, including that of McMaster’s own peace advocate and cultural critic Henry Giroux, who carries Russell’s torch into new battles against ignorance, violence and unchecked corporate and political power.

For more insights like this, visit our website at www.international-maths-challenge.com.
Credit of the article given to Vivian Marie Lewis


Dialogic Teaching

Dialogue is a key part of all lively classrooms, but how do we ensure this dialogue is effective? How do we give students the tools they need to discuss mathematical ideas? What are the components of effective classroom dialogue? Let’s take a look at dialogic teaching and explore how it can encourage deeper mathematical learning.

What is dialogic teaching?

Dialogic teaching is grounded in active and meaningful dialogue between teacher and students. A dialogue is not a teacher standing in front of a class delivering a lesson – it is an active back and forth that promotes questioning and reasoning. The goal is to foster a collaborative and interactive learning environment where students actively engage in building their understanding of the subject.

Shyam Drury from Scitech explores the specifics of dialogic teaching in mathematics in this fantastic podcast  on the Maths in Schools Strategies for Explicit Teaching podcast series. Drury observes, ‘When teaching mathematics in a dialogical classroom, the authority in the room is not the teacher or the student, instead it is mathematical truth.’

Questioning

Questions are a part of every classroom, but what kind of questions encourage dialogue? Is it a matter of open-ended versus closed questions? Closed questions are important for checking comprehension, but they don’t promote dialogue. Open-ended questions promote dialogue, but discussions can easily get off track.

The key to constructing productive questions is to ensure that they promote focused dialogue. The mathematical idea you are teaching – and the desired learning outcome – should always direct the conversation and inform the questions you ask. This may include both open-ended and closed questions.

If you want to learn more about questioning, listen  to the fascinating conversation with Professor Helen Chick from the University of Tasmania as she explores the ‘how to’ of questions in teaching.

ow do you build a dialogic classroom?

Now we understand what dialogical teaching is, let’s explore how we put it into practice.

Mathematics teaching is largely based around an IRE dialogue pattern: initiate, respond, evaluate. For example:

  • Initiate: What’s 6 x 7?
  • Respond: 42
  • Evaluate: That’s right!

How do we extend this dialogue pattern? Instead of the conversation ending with the ‘evaluate’ response, ask your students a question. How did you come to that answer? Why did you use that method?

Bring in how and why questions to provoke thinking. How questions unpack and make more explicit a student’s approach to a mathematical problem and why questions promote reasoning.

How does it feel as a learner?

Dialogic teaching is only effectively within the right classroom culture. A learner needs to feel safe to engage, enquire and take risks.

Here are some tools to help create a safe space for dialogic teaching:

  • Provide opportunities for students to speak to each other in low-risk situations, such as peer-to-peer discussions or small-group discussions. This way, every student in the room is expressing their thinking, not just those who arrive at the answer first.
  • Place whiteboards around the room displaying what you want your class to tackle. When everyone is looking at the same piece of mathematics, it encourages working together.
  • Set up challenges that provide a framework for students to share ideas.

Dialogue leads to deeper understanding

When learners feel safe, dialogic teaching helps construct a shared understanding of the strategies and tools required for mathematical learning.

Encouraging dialogue helps students develop the language they need to unpack and explore mathematics.

If they can talk about, they can share it!

For more such insights, log into our website https://international-maths-challenge.com

Credit of the article given to The Mathematics Hub


Math shows how DNA twists, turns and unzips

DNA knot as seen under the electron microscope. Javier Arsuaga, CC BY-ND

If you’ve ever seen a picture of a DNA molecule, you probably saw it in its famous B-form: two strands coiling around each other in a right-handed fashion to form a double helix. But did you know that DNA can change its shape?

DNA molecules, which carry the genetic code of an organism, have to be tightly packed to fit inside a cell. However, every few hours, the cell produces a faithful copy of its genome in preparation for cell division. This replication process puts tremendous stress on the DNA and can change its shape in lethal ways.

As a mathematician and a biologist, I am interested in how mathematics can describe the many shapes of DNA, as well as cellular processes like DNA replication. The answers to these questions inspire new mathematics and possibly a better understanding of the molecule of life.

The shape of DNA

To understand the mathematics of the shape of DNA, you need to consider both its geometry and its topology. These are related but distinct concepts.

Geometry describes an object at a particular moment in time – frozen rigid in space, like a sculpture. In the cell, the DNA helix coils upon itself, or “supercoils.” The way DNA folds and coils encodes valuable geometric information that can be crucial to control the way genes are expressed.

Topology describes how an object deforms smoothly, as if made out of clay without making new holes or breaks. For example, imagine a rubber band tumbling around in a whirlpool. As the water swirls, the rubber band twists, stretches and shrinks. All of the shapes adopted by the band as it moves are topologically identical, but geometrically different.

These three objects have very different geometries, but are topologically the same – meaning that the objects can be bent or twisted from one shape into another. Mariel Vazquez, CC BY

Merely copying DNA creates a large number of shape-related problems, but textbook images rarely illustrate this topological conundrum.

During the cell cycle, each chromosome is replicated into two identical copies. In order for that to happen, the DNA helix must unwind, causing stress on the DNA. DNA responds to this stress by supercoiling, just like an old telephone cord. But the cell cannot tolerate too much supercoiling. If DNA contorts too much, the cell will suffer.

Sketch of a right handed DNA double helix (left). The opening of the helix, indicated by a triangle, causes the DNA to supercoil (right). A supercoil occurs when the axis of the helix, indicated in purple, coils upon itself. Mariel Vazquez, CC BY

A DNA molecule can be linear – as in the case of human chromosomes – or circular. Examples of circular DNA molecules include bacterial chromosomes and human mitochondrial DNA. If the DNA molecule is circular, then cellular processes such as replication may tie DNA into knots or links, like rings in a keychain. DNA knots and links can cause cells to malfunction or even die.

Stabilizing DNA

Consider the bacterium E. coli. Its genetic code is found in one single DNA chromosome. In E. coli and other bacteria, the DNA double helix closes into a circle, like a twisted rubber band.

Replication of the E. coli chromosome can happen in as short as 20 minutes in a test tube. But when a circular chromosome is replicated, the process yields two interlinked chromosomes. That is, the new chromosomes form two rings linked through each other. The new chromosomes must unlink before the cell divides into two cells. Otherwise they would either break on the way to their target cell, or one cell would inherit two interlinked copies of one chromosome and the other one would be missing the chromosome altogether.

The cell recruits enzymes to unlink the DNA. Enzymes called topoisomerases and recombinases act as scissors and glue for DNA. They can change the geometry and topology of DNA, thus maintaining a stable genome. In E. coli, topoisomerases work tirelessly during and after replication to maintain healthy levels of supercoiling and to safely unlink the chromosomes.

Replication of a circular DNA molecule. The arrows show the direction of replication (left). The new molecules interlink in this process (right). Mariel Vazquez, CC BY

When topoisomerases don’t work

When topoisomerases don’t work, the cell eventually dies. This makes them good targets for drug design. But cells have different types of topoisomerases and other enzymes such as recombinases that may be able to come to the rescue. For example, we showed that, in E. coli cells where the topoisomerases in charge of unlinking have been disabled, other enzymes called site-specific recombinases can untie replication links.

Both topoisomerases and site-specific recombinases bind double stranded DNA and can change its shape by introducing breaks. Type II topoisomerases introduce a break along the DNA molecule and transport another piece of DNA through the break before resealing it. Site-specific recombinases attach to two sites along the DNA, introduce one cut in each, then reconnect the ends.

My lab uses mathematics and computer simulations to understand how these enzymes unlink DNA molecules. While the local action is well understood on a biochemical level, how exactly enzymes simplify the topology of DNA is still a mystery.

In one of our studies, we focused on E. coli cells where the topoisomerases don’t workWe showed how to untie a replication link in the minimum number of steps.

The unlinking pathway of a 6-crossing replication link. This is the only pathway that simplifies the link at each step. Replication links can have any even number of crossings and similar unlinking pathways. Arsuaga-Vazquez lab, Author provided (no reuse)

In general, there can be many unlinking pathways. We use computer simulations to assign probabilities to each pathway. Our work indicates that, in the case of replication links, the simplest pathway is the one that enzymes most likely take.

Sophisticated mathematical methods can help explain how enzymes unlink DNA. Without mathematical modeling, researchers would be restricted to simplified models suggested by biological experiments.

For more insights like this, visit our website at www.international-maths-challenge.com.
Credit of the article given to Mariel Vazquez


Let’s teach students why math matters in the real world

“When will I ever use this?” It’s a question math and science teachers hear all the time from their high school students.

Teaching science, technology, engineering and math (STEM) skills is more important than ever, but it’s often difficult for students to understand the practical applications of such fundamental learning and how it will help them down the road.

Classroom activities should be relevant, meaningful and connected to students’ prior knowledge and experiences. Learning must be based on lived experiences within both formal and informal educational settings.

Increasingly, teacher educators are realizing that we must break away from traditional silos of courses, disciplines and formal schooling. Educators must lead by example and provide students with opportunities to explore interdisciplinary approaches to learning.

Creative thinking

The new British Columbia curriculum embraces these principles of learning. In the same spirit, I’m part of a new and unique Bachelor of Education program at Thompson Rivers University where teacher candidates are learning to teach STEM by actively engaging students. The program promotes cross-curricular and interdisciplinary approaches to learning and is tied to the provincial curriculum core competencies of communication, critical and creative thinking.

So how do you teach a subject like math differently in a way that can help students learn through creative thinking and experience, rather than rote memorization?

Let’s take, for example, Pi.

I often ask my teacher candidates: What is π? Many respond “3.14” and, if probed further, explain the meaning by merely stating an equation like A=πr² (where A is the area of a circle and r is the radius of a circle). Or they may tell me C=2πr (where C is the circumference of a circle).

A door handle in the shape of Pi at the National Museum of Mathematics in New York, (AP Photo/Seth Wenig)

Teaching through discovery

I encourage these teacher candidates to think differently and to help students discover mathematical concepts for themselves. What better way to teach students that π is the ratio of a circle’s circumference to its diameter than to have them trace any circle and then measure it with a piece of string?

They will soon learn that regardless of the size of the circle, the ratio of circumference to diameter will always be 22/7, an approximation of π.

Innovative educators can integrate history, geography, math and science lessons by teaching a thematic unit on ancient civilizations.

For example, the Egyptians succeeded in building great pyramids with incredible precision and accuracy. These magnificent architectural accomplishments have stood the test of time, remaining largely intact after centuries — a tribute to their construction.

The ancient Egyptians understood the significance of mathematics through the very beauty and symmetry of nature. They used geometry to solve everyday problems.

Tearing down silos

Increasingly, teacher educators are realizing that we must break away from traditional silos of courses, disciplines and formal schooling — exactly the opposite of the “back to basics” approach suggested by populist politicians like new Ontario Premier Doug Ford.

Students benefit from learning experiences that are meaningful, relevant and well-connected to their own experiences. For that to happen, the people teaching those students must be prepared to take on new attitudes of reflectiveness and inquisitiveness.

What is necessary is to follow in the footsteps of the great thinkers like Galileo and Newton, who questioned our perceptions of reality and sought answers from tactile experiences rather than textbooks or teachers.

For more insights like this, visit our website at www.international-maths-challenge.com.
Credit of the article given to Edward R. Howe


Inspired by Genius: How a Mathematician Found His Way

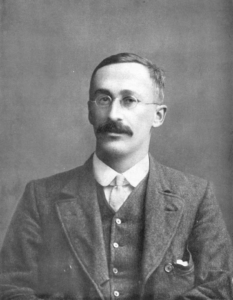
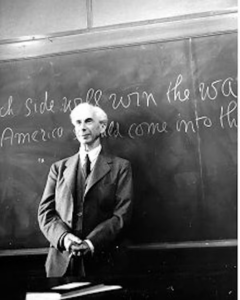
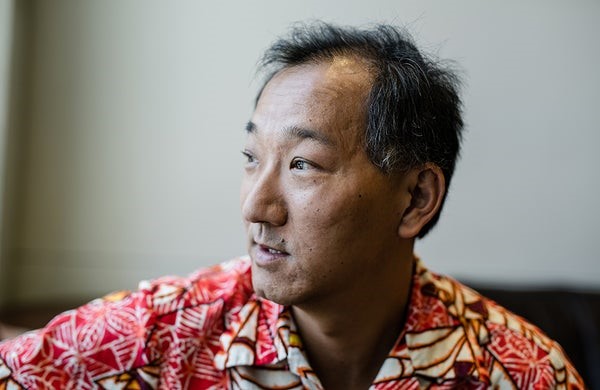
Credit: The mathematician Ken Ono in his office at Emory University in Atlanta. Raymond McCrea Jones for Quanta Magazine

The mathematician Ken Ono believes that the story of Srinivasa Ramanujan—mathematical savant and two-time college dropout—holds valuable lessons for how we find and reward hidden genius

For the first 27 years of his life, the mathematician Ken Ono was a screw-up, a disappointment and a failure. At least, that’s how he saw himself. The youngest son of first-generation Japanese immigrants to the United States, Ono grew up under relentless pressure to achieve academically. His parents set an unusually high bar. Ono’s father, an eminent mathematician who accepted an invitation from J. Robert Oppenheimer to join the Institute for Advanced Study in Princeton, N.J., expected his son to follow in his footsteps. Ono’s mother, meanwhile, was a quintessential “tiger parent,” discouraging any interests unrelated to the steady accumulation of scholarly credentials.

This intellectual crucible produced the desired results—Ono studied mathematics and launched a promising academic career—but at great emotional cost. As a teenager, Ono became so desperate to escape his parents’ expectations that he dropped out of high school. He later earned admission to the University of Chicago but had an apathetic attitude toward his studies, preferring to party with his fraternity brothers. He eventually discovered a genuine enthusiasm for mathematics, became a professor, and started a family, but fear of failure still weighed so heavily on Ono that he attempted suicide while attending an academic conference. Only after he joined the Institute for Advanced Study himself did Ono begin to make peace with his upbringing.

Through it all, Ono found inspiration in the story of Srinivasa Ramanujan, a mathematical prodigy born into poverty in late-19th-century colonial India. Ramanujan received very little formal schooling, yet he still produced thousands of independent mathematical results, some of which—like the Ramanujan theta function, which has found applications in string theory—are still intensely studied. But despite his genius, Ramanujan’s achievements didn’t come easily. He struggled to gain acceptance from Western mathematicians and dropped out of university twice before dying of illness at the age of 32.

While Ono, now 48, doesn’t compare himself to Ramanujan in terms of ability, he has built his career in part from Ramanujan’s insights. In 2014, Ono and his collaborators Michael Griffin and Ole Warnaar published a breakthrough result in algebraic number theory that generalized one of Ramanujan’s own results. Ono’s work, which is based on a pair of equations called the Rogers-Ramanujan identities, can be used to easily produce algebraic numbers (such as phi, better known as the “golden ratio”).

More recently, Ono served as an associate producer and mathematical consultant for The Man Who Knew Infinity, a recently released feature film about Ramanujan’s life. And his new memoir, My Search for Ramanujan: How I Learned to Count (co-authored with Amir D. Aczel), draws connections between Ramanujan’s life and Ono’s own circuitous path to mathematical and emotional fulfillment. “I wrote this book to show off my weaknesses, to show off my struggles,” Ono said. “People who are successful in their careers were not always successful from day one.”

Like Ramanujan, who benefited from years of mentorship by the British mathematician G.H. Hardy, Ono credits his own success to serendipitous encounters with teachers who helped his talents flourish. He now spends a great deal of time mentoring his own students at Emory University. Ono has also helped launch the Spirit of Ramanujan Math Talent Initiative, a venture that “strives to find undiscovered mathematicians around the world and match them with advancement opportunities in the field.”

Quanta Magazine spoke with Ono about finding his way as a mathematician and a mentor, and about Ramanujan’s inspiring brand of creativity. An edited and condensed version of the interview follows.

QUANTA MAGAZINE: What was so special about Ramanujan’s approach to doing mathematics?
KEN ONO: First, he was really a poet, not a problem solver. Most professional mathematicians, whether they’re in academia or industry, have problems that they’re aiming to solve. Somebody wants to prove the Riemann hypothesis, and sets out to do it. That’s how we think science should proceed, and in fact almost every scientist should work that way, because in reality science develops through the work of thousands of individuals slowly adding to a body of knowledge. But what you find in Ramanujan’s original notebooks is just formula after formula, and it’s not apparent where he’s going with his ideas. He was someone who could set down the paths of beginnings of important theories without knowing for sure why we would care about them as mathematicians of the future.

He’s credited with compiling thousands of identities—that is, equations that are true regardless of what values the variables take. Why is that important?
It is true that the vast majority of the contents of his notebooks are what you would call identities. Identities that relate continued fractions to other functions, expressions for integrals, expressions for hypergeometric functions, and expressions for objects that we call q-series.

But that would be a literal interpretation of his notebooks. In my opinion, that would be like taking a cookbook by Julia Child, reading the recipes and saying that it’s about assembling chemical compounds into something more complicated. Strictly speaking that would be true, but you would be missing out on what makes delicious recipes so important to us.

Ramanujan’s work came through flights of fancy. If he had been asked to explain why he did his work, he would probably say that he recorded formulas that he found beautiful, and they were beautiful because they revealed some unexpected phenomenon. And they’re important to us today because these special phenomena that Ramanujan identified, over and over again, have ended up becoming prototypes for big mathematical theories in the 20th and 21st centuries.

Here’s an example. In one of his published manuscripts, Ramanujan recorded a lot of elementary-looking results called congruences. In the 1960s, Jean-Pierre Serre, himself a Fields medalist, revisited some of these results, and in them he found glimpses of a theory that he named the theory of Galois representations. This theory of Galois representations is the language that Andrew Wiles used in the 1990s to prove Fermat’s last theorem.

There’s no “theory of Ramanujan,” but he anticipated mathematical structures that would be important to all of these other more contemporary works. He lived 80 years before his time.

How do you approach your own mathematical work—more as an artist, like Ramanujan, or with the aim of solving specific problems, like a scientist?
I’m definitely much more of a scientist. Science proceeds at a much faster rate than when I started in my career in the early 1990s, and I have to stop often to recognize the beauty in it and try not to be so caught up in the more professionalized side of how one does science. The grant getting, the publications, and all of that—I have to admit, I don’t like it.

What compelled you to juxtapose your own story with his?
Well, I almost didn’t write it. There are a lot of very personal things that I’ve never told anyone before. It wasn’t until I started writing this book that I was mature enough as a parent myself to try to understand the circumstances that led my parents to raise us the way they did. And as a professor at Emory, I see all these kids under tremendous pressure—rarely pressure that they understand the origin of. So many of these super-talented kids are just going through the motions, and aren’t passionate about their studies at all, and that’s terrible. I was like that too. I’d given up on ever trying to live up to my parents’ expectations, but somehow because I’ve had Ramanujan as a guardian angel, things have worked out well for me. It makes you a better teacher when you just tell people how hard it was for you.

This book and your story don’t fit the typical “great man of science” narrative.
I think you’ll find that’s much more common than people are willing to admit. I didn’t discover my passion for mathematics until my early 20s—that’s when [my doctoral adviser Basil] Gordon turned me on to mathematics at a time when I didn’t think anything was beautiful. I thought it was all about test scores, grades and trying to do as well as possible without putting in effort. Colleges are full of kids who think that way. How do you beat the system, right? I wasn’t beating the system. The system was beating me, and Gordon turned me around. When I’ve told people the story I’ve discovered that I’m really not alone.

That’s what I see in Ramanujan. He was a two-time college dropout whom my father looked up to as a hero—which made no sense to me when I was 16, because I was told I had to be a child prodigy. I was supposed to do my geometry problems during the summer sitting next to my dad while he did his research. I wasn’t even really allowed to go out and play, and then to just have my father tell me about Ramanujan out of the blue—it was beyond earth-shattering.

If you’d been interested in something conventionally “artistic,” like music, this kind of painful journey toward success would not seem so surprising. Why does it surprise us to hear about a mathematician having the same struggles?
For whatever reason, we live in a culture where we think that the abilities of our best scientists and our best mathematicians are somehow just God-given. That either you have this gift or you don’t, and it’s not related to help, to hard work, to luck. I think that’s part of the reason why, when we try to talk about mathematics to the public, so many people just immediately respond by saying, “Well, I was never very good at math. So I’m not really supposed to understand it or identify with it.” I might have had some mathematical talent passed through my father genetically, but that was by no means enough. You have to be passionate about a subject.

At the same time, I want it to be known that it’s totally OK to fail. In fact, you learn from your mistakes. We learn early on if that you want to be good at playing the violin, you’ve got to practice. If you want to be good at sports, you practice. But for some crazy reason, our culture assumes that if you’re good at math, you were just born with it, and that’s it. But you can be so good at math in so many different ways. I failed my [graduate-school] algebra qualifications! That doesn’t mean I can’t end up being a successful mathematician. But when I tell people I failed at this, nobody believes me.

But Ramanujan seems to be just that: a unique genius who appeared out of nowhere. What does that have to do with a regular person’s life?
You think no one can be like Ramanujan? Well, I disagree. I think we can search the world looking for a mathematical talent, just not by the usual metrics. I want teachers and parents to recognize that when you do see unusual talent, instead of demanding that these people have certain test scores, let’s find a way to help nurture them. Because I think humanity needs it. I think these are the lessons we learn from Ramanujan.

You’re leading the Spirit of Ramanujan Math Talent Initiative. What is this spirit? How do we recognize it?
First of all, it’s the idea that talent is often found in the most unforgiving and unpromising of circumstances. It’s the responsibility of mentors, teachers and parents first to recognize that talent, which is not always easy to do, and then to offer opportunities that nurture that talent.

There are no age limits, and I don’t want this to be a competition where you’re recognized for high test scores. I have no trouble finding people who can get an 800 on the math SAT. That’s easy. Those people don’t need to be identified. They’ve already self-identified. I’m searching for creativity.

That said, the spirit of Ramanujan does not require finding the next Ramanujan. We would be super lucky to do that, but if we make opportunities for 30 talented people around the world who are presently working in an intellectual desert, or are subjected to inelastic educational systems where they’re not allowed to flourish—or if we can provide an opportunity for someone to work with a scientist who could be their G.H. Hardy—then this initiative will be successful.

Do you wish you had been nurtured differently? Do you resent your parents?
I love my parents. We discussed the draft of the book for months last summer. They were very upset with me at first, because it was difficult for them to get past the first 30 pages, but now they embrace it. One reviewer actually saw the book as a love letter to my parents and to my mentors, because they taught me skills I needed.

If you had never joined the Institute for Advanced Study, would you still be struggling to reconcile your own path with your parents’ expectations?
I think I would still be searching for that recognition today if I hadn’t gotten there.

Both my parents will tell you that you only get to live once, so you might as well be the very, very best that you can be at whatever you choose. Which I don’t necessarily agree with, because if everyone lived that way, there would be nothing but a whole bunch of unhappy people in the world. But that’s how they brought us up. They taught me to be competitive. They taught me not to falsely believe I had done well when I hadn’t. They taught me standards, and those are important. But it’s true that if I hadn’t had the opportunity to work at the Institute, I’m not sure I would have been able to write this book. I might still be struggling with these things.

For more insights like this, visit our website at www.international-maths-challenge.com.

Credit of the article given to John Pavlus & Quanta Magazine


Has one of math’s greatest mysteries, the Riemann hypothesis, finally been solved?

Over the past few days, the mathematics world has been abuzz over the news that Sir Michael Atiyah, the famous Fields Medalist and Abel Prize winner, claims to have solved the Riemann hypothesis.

If his proof turns out to be correct, this would be one of the most important mathematical achievements in many years. In fact, this would be one of the biggest results in mathematics, comparable to the proof of Fermat’s Last Theorem from 1994 and the proof of the Poincare Conjecture from 2002.

Besides being one of the great unsolved problems in mathematics and therefore garnishing glory for the person who solves it, the Riemann hypothesis is one of the Clay Mathematics Institute’s “Million Dollar Problems.” A solution would certainly yield a pretty profitable haul: one million dollars.

The Riemann hypothesis has to do with the distribution of the prime numbers, those integers that can be divided only by themselves and one, like 3, 5, 7, 11 and so on. We know from the Greeks that there are infinitely many primes. What we don’t know is how they are distributed within the integers.

The problem originated in estimating the so-called “prime pi” function, an equation to find the number of primes less than a given number. But its modern reformulation, by German mathematician Bernhard Riemann in 1858, has to do with the location of the zeros of what is now known as the Riemann zeta function.

The technical statement of the Riemann hypothesis is “the zeros of the Riemann zeta function which lie in the critical strip must lie on the critical line.” Even understanding that statement involves graduate-level mathematics courses in complex analysis.

Most mathematicians believe that the Riemann hypothesis is indeed true. Calculations so far have not yielded any misbehaving zeros that do not lie in the critical line. However, there are infinitely many of these zeros to check, and so a computer calculation will not verify all that much. Only an abstract proof will do.

If, in fact, the Riemann hypothesis were not true, then mathematicians’ current thinking about the distribution of the prime numbers would be way off, and we would need to seriously rethink the primes.

The Riemann hypothesis has been examined for over a century and a half by some of the greatest names in mathematics and is not the sort of problem that an inexperienced math student can play around with in his or her spare time. Attempts at verifying it involve many very deep tools from complex analysis and are usually very serious ones done by some of the best names in mathematics.

Atiyah gave a lecture in Germany on Sept. 25 in which he presented an outline of his approach to verify the Riemann hypothesis. This outline is often the first announcement of the solution but should not be taken that the problem has been solved – far from it. For mathematicians like me, the “proof is in the pudding,” and there are many steps that need to be taken before the community will pronounce Atiyah’s solution as correct. First, he will have to circulate a manuscript detailing his solution. Then, there is the painstaking task of verifying his proof. This could take quite a lot of time, maybe months or even years.

Is Atiyah’s attempt at the Riemann hypothesis serious? Perhaps. His reputation is stellar, and he is certainly capable enough to pull it off. On the other hand, there have been several other serious attempts at this problem that did not pan out. At some point, Atiyah will need to circulate a manuscript that experts can check with a fine-tooth comb.

For more insights like this, visit our website at www.international-maths-challenge.com.
Credit of the article given to William Ross