Generalized splitting-ring number theoretic transform

Number theoretic transform (NTT) is widely recognized as the most efficient method for computing polynomial multiplication with high dimension and integral coefficients, due to its quasilinear complexity.

What is the relationship between the NTT variants that are constructed by splitting the original polynomials into groups of lower-degree sub-polynomials, such as K-NTT, H-NTT, and G3-NTT? Can they be seen as special cases of a certain algorithm under different parameterizations?

To solve the problems, a research team led by Yunlei Zhao published new research on 15 August 2024 in Frontiers of Computer Science.

The team proposed the first Generalized Splitting-Ring Number Theoretic Transform, referred to as GSR-NTT. Then, they investigated the relationship between K-NTT, H-NTT, and G3-NTT.

In the research, they investigate generalized splitting-ring polynomial multiplication based on the monic incremental polynomial variety, and they propose the first Generalized Splitting-Ring Number Theoretic Transform, referred to as GSR-NTT. They demonstrate that K-NTT, H-NTT, and G3-NTT can be regarded as special cases of GSR-NTT under different parameterizations.

They introduce a succinct methodology for complexity analysis, based on which GSR-NTT can derive its optimal parameter settings. They provide GSR-NTT other instantiations based on cyclic convolution-based polynomials and power-of-three cyclotomic polynomials.

They apply GSR-NTT to accelerate polynomial multiplication in the lattice-based scheme named NTTRU and single polynomial multiplication over power-of-three cyclotomic polynomial rings. The experimental results show that, for NTTRU, GSR-NTT achieves speed-ups of 24.7%, 37.6%, and 28.9% for the key generation, encapsulation, and decapsulation algorithms, respectively, leading to a total speed-up of 29.4%.

Future work can focus on implementing GSR-NTT on more platforms.

For more such insights, log into our website https://international-maths-challenge.com

Credit of the article to be given Frontiers Journals


Framework for solving parabolic partial differential equations could guide computer graphics and geometry processing

Caption:Part of a new algorithm developed at MIT solves the so-called Fokker-Planck equation, where heat diffuses in a linear way, but there are additional terms that drift in the same direction heat is spreading. In a straightforward application, the approach models how swirls would evolve over the surface of a triangulated sphere. Credit: Alex Shipps / MIT CSAIL and the researchers


Computer graphics and geometry processing research provide the tools needed to simulate physical phenomena like fire and flames, aiding the creation of visual effects in video games and movies as well as the fabrication of complex geometric shapes using tools like 3D printing.


Under the hood, mathematical problems called partial differential equations (PDEs) model these natural processes. Among the many PDEs used in physics and computer graphics, a class called second-order parabolic PDEs explain how phenomena can become smooth over time. The most famous example in this class is the heat equation, which predicts how heat diffuses along a surface or in a volume over time.


Researchers in geometry processing have designed numerous algorithms to solve these problems on curved surfaces, but their methods often apply only to linear problems or to a single PDE. A more general approach by researchers from MIT’s Computer Science and Artificial Intelligence Laboratory (CSAIL) tackles a general class of these potentially nonlinear problems.


In a paper recently published in the ACM Transactions on Graphics journal and presented at the SIGGRAPH conference, they describe an algorithm that solves different nonlinear parabolic PDEs on triangle meshes by splitting them into three simpler equations that can be solved with techniques graphics researchers already have in their software toolkit. This framework can help better analyse shapes and model complex dynamical processes.


“We provide a recipe: If you want to numerically solve a second-order parabolic PDE, you can follow a set of three steps,” says lead author Leticia Mattos Da Silva, an MIT Ph.D. student in electrical engineering and computer science (EECS) and CSAIL affiliate. “For each of the steps in this approach, you’re solving a simpler problem using simpler tools from geometry processing, but at the end, you get a solution to the more challenging second-order parabolic PDE.”


To accomplish this, Mattos Da Silva and her co-authors used Strang splitting, a technique that allows geometry processing researchers to break the PDE down into problems they know how to solve efficiently.


First, their algorithm advances a solution forward in time by solving the heat equation (also called the “diffusion equation”), which models how heat from a source spreads over a shape. Picture using a blow torch to warm up a metal plate—this equation describes how heat from that spot would diffuse over it. This step can be completed easily with linear algebra.


Now, imagine that the parabolic PDE has additional nonlinear behaviours that are not described by the spread of heat. This is where the second step of the algorithm comes in: it accounts for the nonlinear piece by solving a Hamilton-Jacobi (HJ) equation, a first-order nonlinear PDE.


While generic HJ equations can be hard to solve, Mattos Da Silva and co-authors prove that their splitting method applied to many important PDEs yields an HJ equation that can be solved via convex optimization algorithms. Convex optimization is a standard tool for which researchers in geometry processing already have efficient and reliable software. In the final step, the algorithm advances a solution forward in time using the heat equation again to advance the more complex second-order parabolic PDE forward in time.


Among other applications, the framework could help simulate fire and flames more efficiently. “There’s a huge pipeline that creates a video with flames being simulated, but at the heart of it is a PDE solver,” says Mattos Da Silva. For these pipelines, an essential step is solving the G-equation, a nonlinear parabolic PDE that models the front propagation of the flame and can be solved using the researchers’ framework.


The team’s algorithm can also solve the diffusion equation in the logarithmic domain, where it becomes nonlinear. Senior author Justin Solomon, associate professor of EECS and leader of the CSAIL Geometric Data Processing Group, had previously developed a state-of-the-art technique for optimal transport that requires taking the logarithm of the result of heat diffusion.


Mattos Da Silva’s framework provided more reliable computations by doing diffusion directly in the logarithmic domain. This enabled a more stable way, for example, to find a geometric notion of average among distributions on surface meshes like a model of a koala.


Even though their framework focuses on general, nonlinear problems, it can also be used to solve linear PDE. For instance, the method solves the Fokker-Planck equation, where heat diffuses in a linear way, but there are additional terms that drift in the same direction heat is spreading. In a straightforward application, the approach modeled how swirls would evolve over the surface of a triangulated sphere. The result resembles purple-and-brown latte art.

The researchers note that this project is a starting point for tackling the nonlinearity in other PDEs that appear in graphics and geometry processing head-on. For example, they focused on static surfaces but would like to apply their work to moving ones, too. Moreover, their framework solves problems involving a single parabolic PDE, but the team would also like to tackle problems involving coupled parabolic PDE. These types of problems arise in biology and chemistry, where the equation describing the evolution of each agent in a mixture, for example, is linked to the others’ equations.

Mattos Da Silva and Solomon wrote the paper with Oded Stein, assistant professor at the University of Southern California’s Viterbi School of Engineering.

For more such insights, log into our website https://international-maths-challenge.com

Credit of the article to be given Alex Shipps, Massachusetts Institute of Technology


Cold math, hot topic: Applied theory offers new insights into sea ice thermal conductivity

An upside-down sea ice slab showcasing brine channels that facilitate the drainage of liquid brine and support convection along the interface.

A new applied mathematical theory could enhance our understanding of how sea ice affects global climate, potentially improving the accuracy of climate predictions.

The authors of a new paper published in the Proceedings of the Royal Society A: Mathematical and Physical Sciences, offer new insights into how heat travels through sea ice, a crucial factor in regulating Earth’s polar climate.

Dr. Noa Kraitzman, Senior Lecturer in Applied Mathematics at Macquarie University and lead author of the study, says the research addresses a key gap in current climate modeling.

“Sea ice covers about 15% of the ocean’s surface during the coldest season when it’s at its vast majority,” Dr. Kraitzman says. “It’s a thin layer that separates the atmosphere and the ocean and is responsible for heat transfer between the two.”

Sea ice acts as an insulating blanket on the ocean, reflecting sunlight and moderating heat exchange. As global temperatures rise, understanding how sea ice behaves will become increasingly important for predicting climate change.

The study focuses on the thermal conductivity of sea ice, a critical parameter used in many global climate models. The movement of liquid brine within sea ice, which can potentially increase its heat transport, was not accounted for in previous models.

Dr. Kraitzman says the unique structure of sea ice, along with its sensitive dependence on temperature and salinity, means it is challenging to measure and predict its properties, specifically its thermal conductivity.

“When you look at sea ice on a small scale, what makes it interesting is its complex structure because it’s made up of ice, air bubbles, and brine inclusions.

“As the atmosphere above the ocean becomes extremely cold, below minus 30 degrees Celsius, while the ocean water remains at about minus two degrees, this creates a large temperature difference, and the water freezes from the top down.

“As the water freezes rapidly, it pushes out the salt, creating an ice matrix of purely frozen water which captures air bubbles and pockets of very salty water, called brine inclusions, surrounded by nearly pure ice.”

These dense brine inclusions are heavier than the fresh ocean water which results in convective flow within the ice, creating big “chimneys” where liquid salt flows out.

The research builds on earlier field work by Trodahl in 1999, which first suggested that fluid flow within sea ice might enhance its thermal conductivity. Dr. Kraitzman’s team has now provided mathematical proof of this phenomenon.

“Our mathematics definitely shows that such an enhancement should be expected once convective flow within the sea ice begins,” Dr. Kraitzman says.

The model also offers a way to relate the sea ice’s thermal properties to its temperature and salt content, allowing theoretical results to be compared with measurements.Specifically, it provides a tool to be used in large-scale climate models, potentially leading to more accurate predictions of future conditions in the polar regions. Sea ice in the Arctic has been declining rapidly in recent decades. This loss of ice can lead to a feedback loop: as more dark ocean water is exposed, it absorbs more sunlight, leading to further warming and ice loss.The loss of sea ice can affect weather patterns, ocean circulation, and marine ecosystems far beyond the polar regions.

Dr. Kraitzman says understanding the thermal conductivity of sea ice is important for predicting its future.

The researchers note that while their model provides a theoretical framework, more experimental work is needed to integrate these findings into large-scale climate models. The study was conducted by mathematicians from Macquarie University in Australia, the University of Utah and Dartmouth College, New Hampshire in the U.S.

For more such insights, log into our website https://international-maths-challenge.com

Credit of the article to be given Macquarie University


Mathematicians unlock the secrets of ouzo’s cloudy transformation

The ouzo phase diagram. The full figure legend can be found in the corresponding journal paper.

Mathematicians at Loughborough University have turned their attention to a fascinating observation that has intrigued scientists and cocktail enthusiasts alike: the mysterious way ouzo, a popular anise-flavored liquor, turns cloudy when water is added.

The researchers’ exploration of this seemingly simple phenomenon, known as the “Ouzo Effect,” has resulted in a new mathematical model that offers insights into the spontaneous formation of microscopic droplets and how they can remain suspended in a liquid for a long time.

Revealing the math taking place in the glass could have far-reaching implications beyond the world of beverages, such as the creation of new materials.

“Ouzo is essentially three things: alcohol, anise oil, and water,” explains Dr. David Sibley, an expert in mathematical modeling.

“When water is added, microscopic droplets form that are made mostly of oil, and these are a result of the anise oil separating from the alcohol-water mixture. This causes the drink to turn cloudy as the droplets scatter light.”

He continued, “This emulsification—the suspension of well-mixed oil droplets in the liquid—is something that requires a lot of energy in other systems and foods. For example, food emulsions such as mayonnaise and salad dressings require vigorous whisking to achieve a smooth and stable mixture. For ouzo, however, the emulsification happens spontaneously.

“What’s also surprising is how long these droplets, and the resulting cloudiness, remain stable in the mixture without separating, especially when compared to other food emulsions. If you’ve ever made an olive oil and balsamic vinegar dressing, you’ll notice that the two liquids start to separate after a short time, requiring more whisking to bring them back together. The ouzo-water emulsion remains stable for a much longer period.

“Understanding how and why this happens in ouzo could lead to the development of new materials, especially in fields such as in pharmaceuticals, cosmetics, and food products, where the stability and distribution of microscopic particles are critical.”

The Loughborough researchers, in collaboration with experts from the University of Edinburgh and Nottingham Trent University, have uncovered the mathematical principles that explain how the droplets and surrounding liquid—two distinct ‘phases’ within the mixture—form and can remain stable together for long periods.

By mixing alcohol, oil, and water in varying proportions, they were able to observe phase separation and measure key properties like surface tension.

They used this data and a statistical mechanical modeling method known as ‘classical density functional theory’ to develop their mathematical model.

This model has been used to calculate a phase diagram that details the stable combinations of the ouzo ingredients.

The research has been published in the journal Soft Matter and is featured on the front cover of the latest issue. The paper is titled “Experimental and theoretical bulk phase diagram and interfacial tension of ouzo.”

“You could say, what looks cloudy is now clearer,” said Professor Andrew Archer, the first author of the journal paper.

“What is also fun is that simple models like this can predict a lot—similar to recent, parallel research we did that reveals how long droplets we sneeze into the air can persist.

“As is often the case, ‘blue skies’ fundamental research can say something profound about an experience that occurs in regular life—like serving and drinking ouzo.”

For more such insights, log into our website https://international-maths-challenge.com

Credit of the article to be given  Meg Cox, Loughborough University


New research analyses ‘Finnegans Wake’ for novel spacing between punctuation marks

Sequences of consecutive breakpoint distances for “Gates of Paradise” and “Finnegans Wake” in the same scale. Credit: Stanisław Drożdż

Statistical analysis of classic literature has shown that the way punctuation breaks up text obeys certain universal mathematical relationships. James Joyce’s tome “Finnegans Wake,” however, famously breaks the rules of normal prose through its unusual, dreamlike stream of consciousness. New work in chaos theory, published in the journal Chaos, takes a closer look at how Joyce’s challenging novel stands out, mathematically.

Researchers have compared the distribution of punctuation marks in various experimental novels to determine the underlying order of “Finnegans Wake.” By statistically analysing the texts, the team has found that the tome exhibits an unusual but statistically identifiable structure.

“‘Finnegans Wake’ exhibits the type of narrative that makes it possible to continue longer strings of words without the need for punctuation breaks,” said author Stanisław Drożdż. “This may indicate that this type of narrative is less taxing on the human perceptual and respiratory systems or, equivalently, that it resonates better with them.”

As word sequences run longer without punctuation marks, the higher the probability that a punctuation mark appears next. Such a relationship is called a Weibull distribution. Weibull distributions apply to anything from human diseases to “The Gates of Paradise,” a Polish novel written almost entirely in a single sentence spanning nearly 40,000 words.

Enter “Finnegans Wake,” which weaves together puns, phrases, and portmanteaus from up to 70 languages into a dreamlike stream of consciousness. The book typifies Joyce’s later works, some of the only known examples to appear to not adhere to the Weibull distribution in punctuation.

The team broke down 10 experimental novels by word counts between punctuation marks. These sets of numbers were compiled into a singularity spectrum for each book that described how orderly sentences of different lengths are proportioned. “Finnegans Wake” has a notoriously broad range of sentence lengths, making for a wide spectrum.

While most punctuation distributions skew toward shorter word sequences, the wide singularity spectrum in “Finnegans Wake” was perfectly symmetrical, meaning sentence length variability follows an orderly curve.

This level of symmetry is a rare feat in the real world, implying a well-organized, complex hierarchical structure that aligns perfectly with a phenomenon known as multifractality, systems represented by fractals within fractals.

“‘Finnegans Wake’ appears to have the unique property that the probability of interrupting a sequence of words with a punctuation character decreases with the length of the sequence,” Drożdż said. “This makes the narrative more flexible to create perfect, long-range correlated cascading patterns that better reflect the functioning of nature.”

Drożdż hopes the work helps large language models better capture long-range correlations in text. The team next looks to apply their work in this domain.

For more such insights, log into our website https://international-maths-challenge.com

Credit of the article to be given   American Institute of Physics


Rubik’s Cube Solution Unlocked By Memorising 3915 Final Move Sequences

For the first time, a speedcuber has demonstrated a solution to the Rubik’s cube that combines the two final steps of the puzzle’s solution into one.

A Rubik’s cube solver has become the first person to show proof of successfully combining the final two steps of solving the mechanical puzzle into one move. The feat required the memorisation of thousands of possible sequences for the final step.

Most skilled speedcubers – people who compete to solve Rubik’s cubes with the most speed and efficiency – choose to solve the final layer of the cube with two separate moves that involve 57 possible sequences for the penultimate step and 21 possible sequences for the final move.

Combining those two separate actions into a single move requires a person to memorise 3915 possible sequences. These sequences were previously known to be possible, but nobody is reported to have successfully achieved this so-called “Full 1 Look Last Layer” (Full 1LLL) move until a speedcuber going by the online username “edmarter” shared a YouTube video demonstrating that accomplishment.

Edmarter says he decided to take up the challenge after seeing notable speedcubers try and fail. Over the course of about a year, he spent 10 hours each weekend and any free time during the week practising and memorising the necessary sequences, he told New Scientist. That often involved memorising 144 movement sequences in a single day.

All that effort paid off on 4 August 2022 when edmarter uploaded a video demonstrating the Full 1LLL over the course of 100 separate puzzle solves. He also posted his accomplishment to Reddit’s r/Cubers community.

His average solve time for each Rubik’s cube over the course of that video demonstration run was 14.79 seconds. He says he had an average solve time as low as 12.50 seconds during two practice runs before recording the video.

The Rubik’s cube community has reacted with overwhelming enthusiasm and awe. The top-voted comment on his Reddit post detailing the achievement simply reads: “This is absolutely insane.”

But he is not resting on his laurels. Next up, he plans to try practising some other methods for finishing the Rubik’s cube that have only previously been mastered by a handful of people.

For more such insights, log into www.international-maths-challenge.com.

*Credit for article given to Jeremy Hsu*


Those with the biggest biases choose first, according to new math study

Credit: Unsplash/CC0 Public Domain

In just a few months, voters across America will head to the polls to decide who will be the next U.S. president. A new study draws on mathematics to break down how humans make decisions like this one.

The researchers, including Zachary Kilpatrick, an applied mathematician at CU Boulder, developed mathematical tools known as models to simulate the deliberation process of groups of people with various biases. They found that decision-makers with strong, initial biases were typically the first ones to make a choice.

“If I want good quality feedback, maybe I should look to people who are a little bit more deliberate in their decision making,” said Kilpatrick, a co-author of the new study and associate professor in the Department of Applied Mathematics. “I know they’ve taken their due diligence in deciding.”

The researchers, led by Samatha Linn of the University of Utah, published their findings August 12 in the journal Physical Review E.

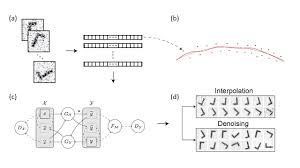
In the team’s models, mathematical decision-makers, or “agents,” gather information from the outside world until, ultimately, they make a choice between two options. That might include getting pizza or Thai food for dinner or coloring in the bubble for one candidate versus the other.

The team discovered that when agents started off with a big bias (say, they really wanted pizza), they also made their decisions really quickly—even if those decisions turned out to run contrary to the available evidence (the Thai restaurant got much better reviews). Those with smaller biases, in contrast, often took so long to deliberate that their initial preconceptions were washed away entirely.

The results are perhaps not surprising, depending on your thoughts about human nature. But they can help to reveal the mathematics behind how the brain works when it needs to make a quick choice in the heat of the moment—and maybe even more complicated decisions like who to vote for.

“It’s like standing on a street corner and deciding in a split second whether you should cross,” he said. “Simulating decision making gets a little harder when it’s something like, ‘Which college should I go to?'”

Pouring water

To understand how the team’s mathematical agents work, it helps to picture buckets. Kilpatrick and his colleagues typically begin their decision-making experiments by feeding their agents information over time, a bit like pouring water into a mop pail. In some cases, that evidence favours one decision (getting pizza for dinner), and in others, the opposite choice (Thai food). When the buckets fill to the brim, they tip over, and the agent makes its decision.

In their experiment, the researchers added a twist to that set up: They filled some of their buckets part way before the simulations began. Those agents, like many humans, were biased.

The team ran millions of simulations including anywhere from 10 to thousands of agents. The researchers were also able to predict the behaviour of the most and least biased agents by hand using pen, paper and some clever approximations.

A pattern began to emerge: The agents that started off with the biggest bias, or were mostly full of water to begin with, were the first to tip over—even when the preponderance of evidence suggested they should have chosen differently. Those agents who began with only small biases, in contrast, seemed to take time to weigh all of the available evidence, then make the best decision available.

“The slowest agent to make a decision tended to make decisions in a way very similar to a completely unbiased agent,” Kilpatrick said. “They pretty much behaved as if they started from scratch.”

Neighbourhood choices

He noted that the study had some limitations. In the team’s experiments, for example, none of the agents knew what the others were doing. Kilpatrick compared it to neighbours staying inside their homes during an election year, not talking about their choices or putting up yard signs. In reality, humans often change their decisions based on the actions of their friends and neighbours.

Kilpatrick hopes to run a similar set of experiences in which the agents can influence each other’s behaviours.

“You might speculate that if you had a large group coupled together, the first agent to make a decision could kick off a cascade of potentially wrong decisions,” he said.

Still, political pollsters may want to take note of the team’s results.

“The study could also be applied to group decision making in human organizations where there’s democratic voting, or even when people give their input in surveys,” Kilpatrick said. “You might want to look at folks carefully if they give fast responses.”

For more such insights, log into our website https://international-maths-challenge.com

Credit of the article given to Daniel Strain, University of Colorado at Boulder


Study uses topological data analysis to identify voting deserts

Credit: Unsplash/CC0 Public Domain

In past years, elections in the U.S. have been marked by stories of long waiting lines at the voting polls. Add other barriers, like long commutes and inadequate transportation, and voting can become inaccessible. But these voting deserts are difficult to quantify.

In a paper, “Persistent Homology for Resource Coverage: A Case Study of Access to Polling Sites” in SIAM Review, SFI External Professor Mason Porter (UCLA) and his students applied topological data analysis, which gives a set of mathematical tools that can quantify shape and structure in data, to the problem of quantifying voting deserts in LA County, Chicago, Atlanta, Jacksonville, New York City, and Salt Lake City.

Using a type of topological data analysis called persistent homology, Porter and his co-authors used estimates of average waiting times and commute times to examine where the voting deserts are located.

Applying persistent homology to a data set can reveal clusters and holes in that data, and it offers a way to measure how long those holes persist. The combination of waiting times and commute times in the data creates a pattern, with holes filling in as time passes.

The longer the hole takes to fill, the more inaccessible voting is to people in that area. “We are basically playing connect-the-dots in a more sophisticated way, trying to fill in what’s there,” says Porter.

Moving forward, Porter hopes to use this strategy to more accurately determine voting deserts. Finding voting deserts will hopefully be used to make voting more accessible, but it requires better-quality data than what was available to him and his students.

“This is a proof of concept,” Porter said. “We had to make some very severe approximations, in terms of what data we had access to.”

For more such insights, log into our website https://international-maths-challenge.com

Credit of the article to be given  Santa Fe Institute


A manifold fitting approach for high-dimensional data reduction beyond Euclidean space

Statisticians from the National University of Singapore (NUS) have introduced a new technique that accurately describes high-dimensional data using lower-dimensional smooth structures. This innovation marks a significant step forward in addressing the challenges of complex nonlinear dimension reduction.

Traditional data analysis methods often rely on Euclidean (linear) dependencies among features. While this approach simplifies data representation, it struggles to capture the underlying complex patterns in high-dimensional data, typically located close to low-dimensional manifolds.

To bridge this gap, manifold-learning techniques have emerged as a promising solution. However, existing methods, such as manifold embedding and denoising, have been limited by a lack of detailed geometric understanding and robust theoretical underpinnings.

The team, led by Associate Professor Zhigang Yao from the Department of Statistics and Data Science, NUS with his Ph.D. student Jiaji Su pioneered a novel method for effectively estimating low-dimensional manifolds hidden within high-dimensional data. This approach not only achieves cutting-edge estimation accuracy and convergence rates but also enhances computational efficiency through the utilization of deep Generative Adversarial Networks (GANs).

This work was conducted in collaboration with Professor Shing-Tung Yau from the Yau Mathematical Sciences Center (YMSC) at Tsinghua University. Part of the work comes from Prof. Yao’s collaboration with Prof. Yau during his sabbatical visit to the Center of Mathematical Sciences and Applications (CMSA) at Harvard University.

Their findings have been published as a methodology paper in the Proceedings of the National Academy of Sciences.

Prof. Yao delivered a 45-minute invited lecture on this research at the recent International Congress of Chinese Mathematicians (ICCM) held in Shanghai, Jan. 2–5, 2024.

Highlighting the significance of the work, Prof. Yao said, “By accurately fitting manifolds, we can reduce data dimensionality while preserving crucial information, including the underlying geometric structure. This represents a major leap in data analysis, enhancing both accuracy and efficiency. By providing a solution that overcomes the limitations of previous methods, our research paves the way for enhanced data analysis and offers valuable insights for diverse applications in the scientific community.”

Looking ahead, Yao’s research team is developing a new framework to process even more complex data, such as single-cell RNA sequence data, while continuing to collaborate with the YMSC team. This ongoing work promises to revolutionize the approach for the reduction and processing of complex datasets, potentially offering new insights into a range of scientific fields.

For more such insights, log into our website https://international-maths-challenge.com

Credit of the article given to National University of Singapore


Real equity in math education is about more than good grades and test scores

Math education outcomes in the United States have been unequal for decades. Learners in the top 10% socioeconomically tend to be about four grade levels ahead of learners in the bottom 10% – a statistic that has remained stubbornly persistent for 50 years.

To advance equity, policymakers and educators often focus on boosting test scores and grades and making advanced courses more widely available. Through this lens, equity means all students earn similar grades and progress to similar levels of math.

With more than three decades of experience as a researcher, math teacher and teacher educator, WEadvocate for expanding what equity means in mathematics education. WEbelieve policymakers and educators should focus less on test scores and grades and more on developing students’ confidence and ability to use math to make smart personal and professional decisions. This is mathematical power – and true equity.

What is ‘equity’ in math?

To understand the limitations of thinking about equity solely in terms of academic achievements, consider a student whom WEinterviewed during her freshman year of college.

Jasmine took Algebra 1 in ninth grade, followed by a summer online geometry course. This put her on a pathway to study calculus during her senior year in an AP class in which she earned an A. She graduated high school in the top 20% of her class and went to a highly selective liberal arts college. Now in her first year, she plans to study psychology.

Did Jasmine receive an equitable mathematics education? From an equity-as-achievement perspective, yes. But let’s take a closer look.

Jasmine experienced anxiety in her math classes during her junior and senior years in high school. Despite strong grades, she found herself “in a little bit of a panic” when faced with situations that require mathematical analysis. This included deciding the best loan options.

In college, Jasmine’s major required statistics. Her counselor and family encouraged her to take calculus over statistics in high school because calculus “looked better” for college applications. She wishes now she had studied statistics as a foundation for her major and for its usefulness outside of school. In her psychology classes, knowledge of statistics helps her better understand the landscape of disorders and to ask questions like, “How does gender impact this disorder?”

These outcomes suggest Jasmine did not receive an equitable mathematics education, because she did not develop mathematical power. Mathematical power is the know-how and confidence to use math to inform decisions and navigate the demands of daily life – whether personal, professional or civic. An equitable education would help her develop the confidence to use mathematics to make decisions in her personal life and realize her professional goals. Jasmine deserved more from her mathematics education.

The prevalence of inequitable math education

Experiences like Jasmine’s are unfortunately common. According to one large-scale study, only 37% of U.S. adults have mathematical skills that are useful for making routine financial and medical decisions.

A National Council on Education and the Economy report found that coursework for nine common majors, including nursing, required relatively few of the mainstream math topics taught in most high schools. A recent study found that teachers and parents perceive math education as “unengaging, outdated and disconnected from the real world.”

Looking at student experiences, national survey results show that large proportions of students experience anxiety about math class, low levels of confidence in math, or both. Students from historically marginalized groups experience this anxiety at higher rates than their peers. This can frustrate their postsecondary pursuits and negatively affect their lives.

How to make math education more equitable

In 2023, WEcollaborated with other educators from Connecticut’s professional math education associations to author an equity position statement. The position statement, which was endorsed by the Connecticut State Board of Education, outlines three commitments to transform mathematics education.

  1. Foster positive math identities: The first commitment is to foster positive math identities, which includes students’ confidence levels and their beliefs about math and their ability to learn it. Many students have a very negative relationship with mathematics. This commitment is particularly important for students of color and language learners to counteract the impact of stereotypes about who can be successful in mathematics.

A growing body of material exists to help teachers and schools promote positive math identities. For example, writing a math autobiography can help students see the role of math in their lives. They can also reflect on their identity as a “math person.” Teachers should also acknowledge students’ strengths and encourage them to share their own ideas as a way to empower them.

  1. Modernize math content: The second commitment is to modernize the mathematical content that school districts offer to students. For example, a high school mathematics pathway for students interested in health care professions might include algebra, math for medical professionals and advanced statistics. With these skills, students will be better prepared to calculate drug dosages, communicate results and risk factors to patients, interpret reports and research, and catch potentially life-threatening errors.
  2. Align state policies and requirements:The third commitment is to align state policies and school districts in their definition of mathematical proficiency and the requirements for achieving it. In 2018, for instance, eight states had a high school math graduation requirement insufficient for admission to the public universities in the same state. Other states’ requirements exceed the admission requirements. Aligning state and district definitions of math proficiency clears up confusion for students and eliminates unnecessary barriers.

What’s next?

As long as educators and policymakers focus solely on equalizing test scores and enrollment in advanced courses, WEbelieve true equity will remain elusive. Mathematical power – the ability and confidence to use math to make smart personal and professional decisions – needs to be the goal.

No one adjustment to the U.S. math education system will immediately result in students gaining mathematical power. But by focusing on students’ identities and designing math courses that align with their career and life goals, WEbelieve schools, universities and state leaders can create a more expansive and equitable math education system.

For more such insights, log into our website https://international-maths-challenge.com

Credit of the article given to Megan Staples, The Conversation