Fields Medal 2022: Work On Prime Numbers And Spheres Wins Maths Prize

Mathematicians who have studied the most efficient way to pack spheres in eight-dimensional space and the spacing of prime numbers are among this year’s recipients of the highest award in mathematics, the Fields medal.

Mathematicians who have studied the most efficient way to pack spheres in eight-dimensional space and the spacing of prime numbers are among this year’s recipients of the highest award in mathematics, the Fields medal.

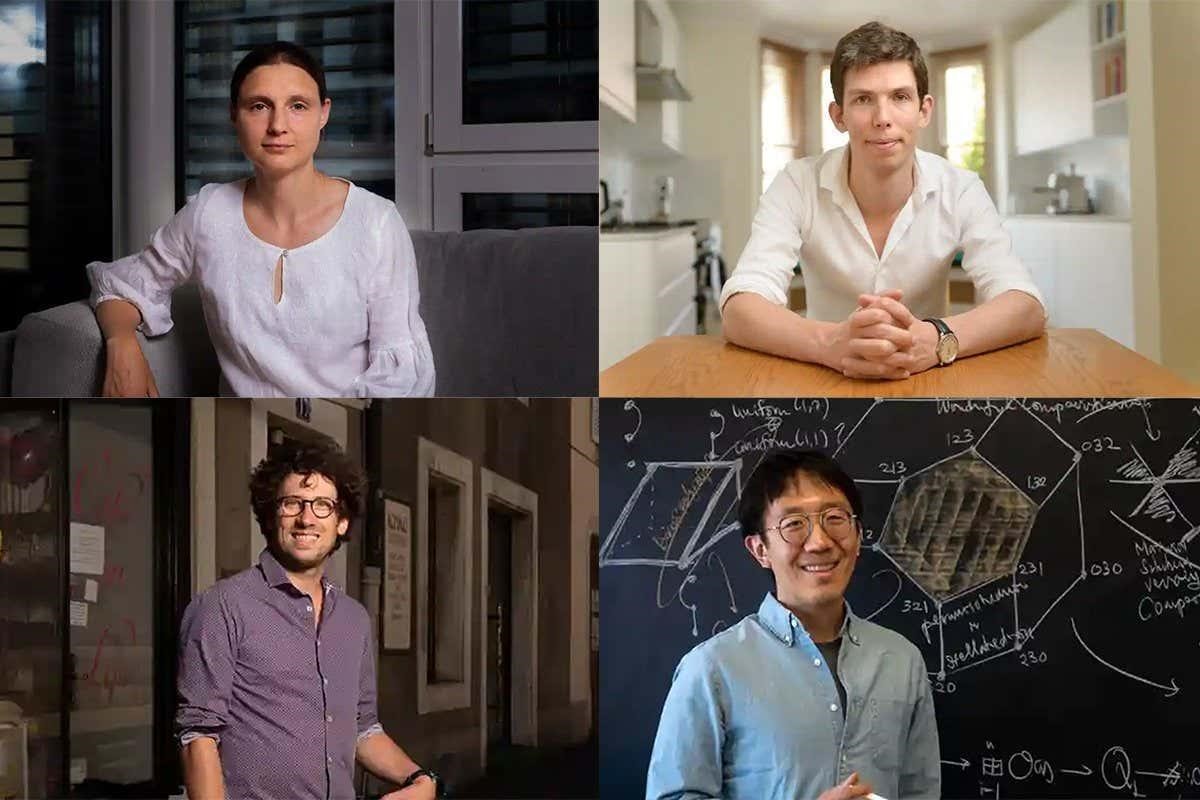
The winners for 2022 are James Maynard at the University of Oxford; Maryna Viazovska at the Swiss Federal Institute of Technology in Lausanne (EPFL); Hugo Duminil-Copin at the University of Geneva, Switzerland; and June Huh at Princeton University in New Jersey.

Kyiv-born Viazovska is only the second female recipient among the 64 mathematicians to have received the award.

“Sphere packing is a very natural geometric problem. You have a big box, and you have an infinite collection of equal balls, and you’re trying to put as many balls into the box as you can,” says Viazovska. Her contribution was to provide an explicit formula to prove the most efficient stacking pattern for spheres in eight dimensions – a problem she says took 13 years to solve.

Maynard’s work involved understanding the gaps between prime numbers, while Duminil-Copin’s contribution was in the theory of phase transitions – such as water turning to ice, or evaporating into steam – in statistical physics.

June Huh, who dropped out of high school aged 16 to become a poet, was recognised for a range of work including the innovative use of geometry in the field of combinatorics, the mathematics of counting and arranging.

The medal, which is considered to be as prestigious as the Nobel prize, is given to two, three or four mathematicians under the age of 40 every four years.

The awards were first given out in 1936 and are named in honour of Canadian mathematician John Charles Fields. This year’s awards were due to be presented at the International Congress of Mathematicians in Saint Petersburg, Russia, but the ceremony was relocated to Helsinki, Finland.

For more such insights, log into www.international-maths-challenge.com.

*Credit for article given to Matthew Sparkes*


Researchers investigate the veracity of ‘six degrees of separation’

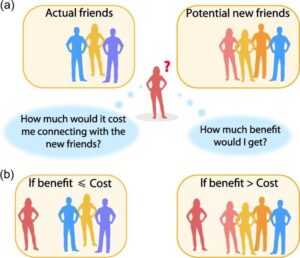
Do you know someone who knows someone? We have all played this game, often to be amazed that despite the extreme scale of human society, random people can be linked through very small chains of acquaintances—typically, around six. Recently, a group of researchers from across the globe discovered that this magic of six degrees can be explained mathematically. The intriguing phenomenon, they show, is linked to another social experience we all know too well—the struggle of cost vs. benefit in establishing new social ties.

In 1967, a farmer in Omaha, Nebraska received a peculiar letter in his mailbox. The sender was Prof. Stanley Milgram, of Harvard University, and the intended recipient was one of his peers. “If you happen to know this person,” the message read, “please forward this letter to him.”

Of course, the chances of such a direct acquaintance across such a vast social and geographical distance—from Boston to Omaha—were extremely slim, and therefore, the letter further requested that if the recipient didn’t know the intended addressee, they should forward the letter to someone who might.

This letter was one of about 300 identical packages sent with similar instructions. The 300 independent letters began circulating across the United States in pursuit of a social pathway linking “Joe” from the farmlands of middle America with the academic hub of the East Coast. Not all letters made it through, but the ones that did recorded, for the first time experimentally, the familiar social paths—a friend of a friend of a friend—that connect American society.

Quite surprisingly, the paths were found to be extremely short. In a society of hundreds of millions of individuals, the experiment found that it only takes about six handshakes to bridge between two random people. Indeed, Milgram’s experiment confirmed what many of us sense intuitively, that we live in a small world, divided by a mere six degrees of separation.

As groundbreaking as it was, Milgram’s experiment was also shaky. For example, it did not count the letters that didn’t reach their final destination. Most letters never reached their destination in Boston. The few letters that actually did arrived through six steps on average. His findings, however, were reaffirmed in a series of more systematic studies: for example, the millions of users of Facebook are on average five to six clicks apart from one another. Similar distances were also measured across 24,000 email users, actor networks, scientific collaboration networks, the Microsoft Messenger network and many others. Six degrees kept coming up.

Hence, social networks of vastly different scale and context tend to feature extremely short pathways. And most importantly, they seem to universally favour the magic number of six. But why?

A recent paper published in Physical Review X by collaborators from Israel, Spain, Italy, Russia, Slovenia and Chile, shows that simple human behaviour—weighing the costs and benefits of social ties—may uncover the roots of this intriguing phenomenon.

Consider individuals in a social network. Naturally, they wish to gain prominence by navigating the network and seeking strategic ties. The objective is not simply to pursue a large number of connections, but to obtain the right connections—ones that place the individual in a central network position. For example, seeking a junction that bridges between many pathways, and hence funnels much of the flow of information in the network.

Of course, such centrality in the network, while offering extremely valuable social capital, does not come for free. Friendship has a cost. It requires constant maintenance.

As a result, the research shows, social networks, whether on or offline, are a dynamic beehive of individuals constantly playing the cost-benefit game, severing connections on the one hand, and establishing new ones on the other. It’s a constant buzz driven by the ambition for social centrality. At the end, when this tug-of-war reaches an equilibrium, all individuals have secured their position in the network, a position that best balances between their drive for prominence and their limited budget for new friendships.

“When we did the math,” says Prof. Baruch Barzel, one of the paper’s lead authors, “we discovered an amazing result: this process always ends with social paths centered around the number six. This is quite surprising. We need to understand that each individual in the network acts independently, without any knowledge or intention about the network as a whole. But still, this self-driven game shapes the structure of the entire network. It leads to the small world phenomenon, and to the recurring pattern of six degrees,” adds Prof. Barzel.

The short paths characterizing social networks are not merely a curiosity. They are a defining feature of the network’s behaviour. Our ability to spread information, ideas and fads that sweep through society is deeply ingrained in the fact that it only requires a few hops to link between seemingly unrelated individuals.

Of course, not only do ideas spread through social connections. Viruses and other pathogens use them, as well. The grave consequences of this social connectedness were witnessed firsthand with the rapid spread of the COVID pandemic that demonstrated to us all the power of six degrees. Indeed, within six infection cycles, a virus can cross the globe.

“But on the upside,” adds Prof. Barzel, “this collaboration is a great example of how six degrees can play in our favour. How else would a team from six countries around the world come together? This is truly six degrees in action!”

For more such insights, log into our website https://international-maths-challenge.com

Credit of the article given to Bar-Ilan University


Here’s the best way to shuffle a pack of cards – with a little help from some maths

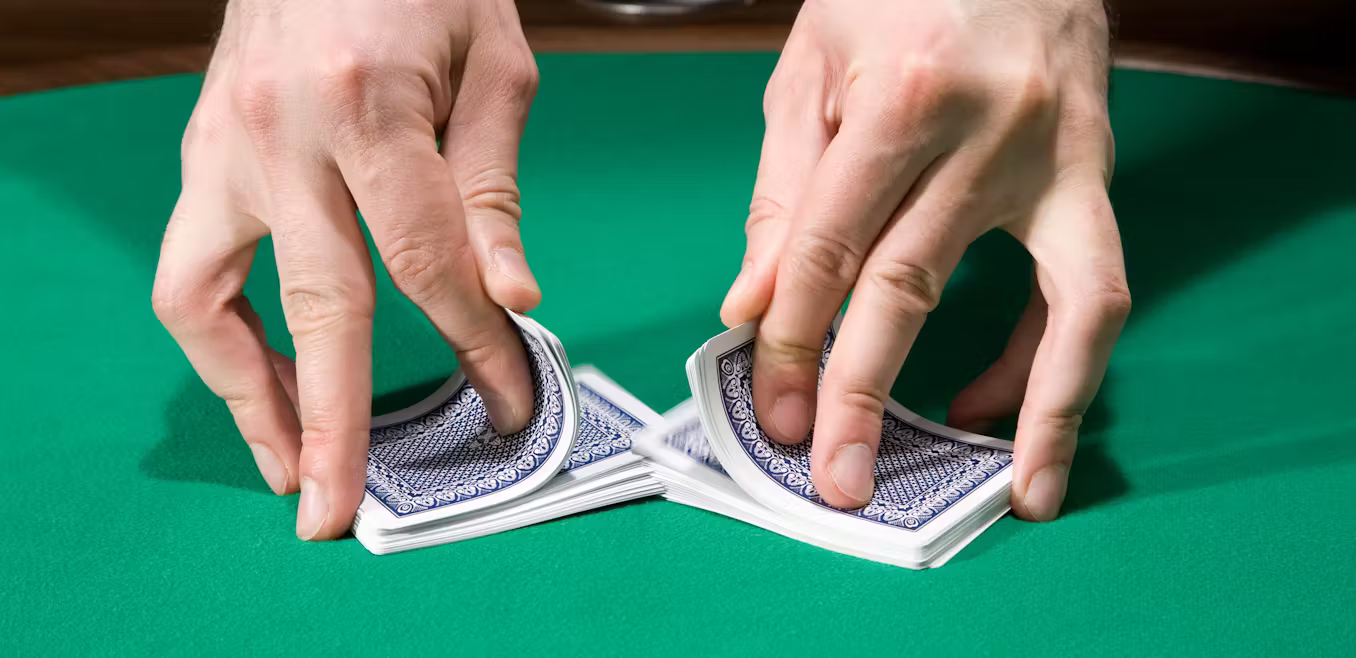
Shuffling a pack of cards isn’t as easy as you think, not if you want to truly randomise the cards. Most people will give a pack a few shuffles with the overhand or riffle methods (where the pack is split and the two halves are interweaved). But research has shown this isn’t enough to produce a sufficiently random order to make sure the card game being played is completely fair and to prevent people cheating.

As I wrote in a recent article about card counting, not having an effective shuffling mechanism can be a serious problem for casinos:

Players have used shuffle tracking, where blocks of cards are tracked so that you have some idea when they will appear. If you are given the option to cut the pack, you try and cut the pack near where you think the block of cards you are tracking is so that you can bet accordingly. A variant on this is to track aces as, if you know when one is likely to appear, you have a distinct advantage over the casino.

So how can you make sure your cards are well and truly shuffled?

To work out how many ways there are of arranging a standard 52-card deck, we multiply 52 by all the numbers that come before it (52 x 51 x 50 … 3 x 2 x 1). This is referred to as “52 factorial” and is usually written as “52!” by mathematicians. The answer is so big it’s easier to write it using scientific notation as 8.0658175e+67, which means it’s a number beginning with 8, followed by 67 more digits.

To put this into some sort of context, if you dealt one million hands of cards every second, it would take you 20 sexdecillion, or 20,000,000,000,000,000,000,000,000,000,000,000,000,000,000,000,000,000, years to deal the same number of hands as there are ways to arrange a deck of cards.

You would think that it would be easy to get a random order from that many permutations. In fact, every arrangement is, in a sense, random. Even one where the cards are ordered by suit and then rank could be considered random. It is only the interpretation we put on this order that would make most people not consider it random. This is the same as the idea that the lottery is less likely to throw up the numbers one to six, whereas in reality this combination is just as probable as any other.

In theory, you could shuffle a deck so that the cards emerged in number order (all the aces, followed by all the twos, followed by all the threes and so on), with each set of numbers in the same suit order (say spades, hearts, diamonds and clubs). Most people would not consider this random, but it is just as likely to appear as any other specific arrangement of cards (very unlikely). This is an extreme example but you could come up with an arrangement that would be seen as random when playing bridge because it offered the players no advantage, but wouldn’t be random for poker because it produced consistently strong hands.

But what would a casino consider random? Mathematicians have developed several ways of measuring how random something is. Variation distance and separation distance are two measures calculated by mathematical formulas. They have a value of 1 for a deck of cards in perfect order (sorted by numbers and suits) and lower values for more mixed arrangements. When the values are less than 0.5, the deck is considered randomly shuffled. More simply, if you can guess too many cards in a shuffled deck, then the deck is not well shuffled.

Persi Diaconis is a mathematician who has been studying card shuffling for over 25 years. Together with and Dave Bayer, he worked out that to produce a mathematically random pack, you need to use a riffle shuffle seven times if you’re using the variation distance measure, or 11 times using the separation distance. The overhand shuffle, by comparison, requires 10,000 shuffles to achieve randomness.

“The usual shuffling produces a card order that is far from random,” Diaconis has said. “Most people shuffle cards three or four times. Five times is considered excessive”.

But five is still lower than the number required for an effective shuffle. Even dealers in casinos rarely shuffle the required seven times. The situation is worse when more than one deck is used, as is the case in blackjack. If you are shuffling two decks, you should shuffle nine times and for six decks you need to shuffle twelve times.

Many casinos now use automatic shuffling machines. This not only speeds up the games but also means that shuffles can be more random, as the machines can shuffle for longer than the dealers. These shuffling machines also stop issues such as card counting and card tracking.

But even these machines are not enough. In another study, Diaconis and his colleagues were asked by a casino to look at a new design of a card shuffling machine that the casino had built. The researchers found that the machine was not sufficiently random, as they simply did not shuffle enough times. But using the machine twice would resolve the problem.

So next time you’re at a casino, take a look at how many times the dealers shuffle. The cards may not be as random as you think they are, which could be to your advantage.

For more insights like this, visit our website at www.international-maths-challenge.com.
Credit of the article given to Graham Kendall


AI Translates Maths Problems Into Code To Make Them Easier To Solve

An artificial intelligence that can turn mathematical concepts written in English into a formal proving language for computers could make problems easier for other AIs to solve.

Maths can be difficult for a computer to understand

An artificial intelligence can translate maths problems written in plain English to formal code, making them easier for computers to solve in a crucial step towards building a machine capable of discovering new maths.

Computers have been used to verify mathematical proofs for some time, but they can only do it if the problems have been prepared in a specifically designed proving language, rather than for the mix of mathematical notation and written text used by mathematicians. This process, known as formalisation, can take years of work for just a single proof, so only a small fraction of mathematical knowledge has been formalised and then proved by a machine.

Yuhuai Wu at Google and his colleagues used a neural network called Codex created by AI research company OpenAI. It has been trained on large amounts of text and programming data from the web and can be used by programmers to generate workable code.

Proving languages share similarities with programming languages, so the team decided to see if Codex could formalise a bank of 12,500 secondary school maths competition problems. It was able to translate a quarter of all problems into a format that was compatible with a formal proof solver program called Isabelle. Many of the unsuccessful translations were the result of the system not understanding certain mathematical concepts, says Wu. “If you show the model with an example that explains that concept, the model can then quickly pick it up.”

To test the effectiveness of this auto-formalisation process, the team then applied Codex to a set of problems that had already been formalised by humans. Codex generated its own formal versions of these problems, and the team used another AI called MiniF2F to solve both versions.

The auto-formalised problems improved MiniF2F’s success rate from 29 per cent to 35 per cent, suggesting that Codex was better at formalising these problems than the humans were.

It is a modest improvement, but Wu says the team’s work is only a proof of concept. “If the goal is to train a machine that is capable of doing the same level of mathematics as the best humans, then auto-formalisation seems to be a very crucial path towards it,” says Wu.

Improving the success rate further would allow AIs to compete with human mathematicians, says team member Albert Jiang at the University of Cambridge. “If we get to 100 per cent, we will definitely be creating an artificial intelligence agent that’s able to win an International Maths Olympiad gold medal,” he says, referring to the top prize in a leading maths competition.

While the immediate goal is to improve the auto-formalisation models, and automated proving machines, there could be larger implications. Eventually, says Wu, the models could uncover areas of mathematics currently unknown to humans.

The capacity for reasoning in such a machine could also make it well-suited for verification tasks in a wide range of fields. “You can verify whether a piece of software is doing exactly what you asked it to do, or you can verify hardware chips, so it has applications in financial trading algorithms and hardware design,” says Jiang.

It is an exciting development for using machines to find new mathematics, says Yang-Hui He at the London Institute for Mathematical Sciences, but the real challenge will be in using the model on mathematical research, much of which is written in LaTeX, a typesetting system. “We only use LaTeX because it types nicely, but it’s a natural language in some sense, it has its own rules,” says He.

Users can define their own functions and symbols in LaTeX that might only be used in a single mathematical paper, which could be tricky for a neural network to tackle that has only been trained on the plain text, says He.

For more such insights, log into www.international-maths-challenge.com.

*Credit for article given to Alex Wilkins*


What Are the Chances?

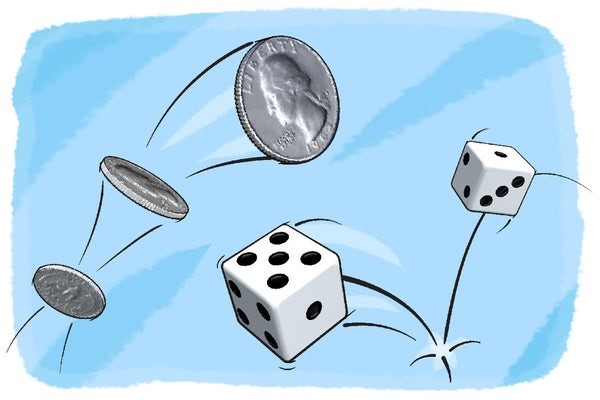
Credit: Heads or tails: Is it a 50-50 chance? Crunch some numbers and flip some coins to find out! George Retseck

A probabilistic science project from Science Buddies

Introduction
Have you ever heard anyone say the chance of something happening is “50–50”? What does that actually mean? This phrase has something to do with probability. Probability tells you how likely it is that an event will occur. This means that for certain events you can actually calculate how likely it is that they will happen. In this activity, you will do these calculations and then test them to see whether they hold true for reality!

Background
Probability allows us to quantify the likelihood an event will occur. You might be familiar with words we use to talk about probability, such as “certain,” “likely,” “unlikely,” “impossible,” and so on. You probably also know that the probability of an event happening spans from impossible, which means that this event will not happen under any circumstance, to certainty, which means that an event will happen without a doubt. In mathematics, these extreme probabilities are expressed as 0 (impossible) and 1 (certain). This means a probability number is always a number from 0 to 1. Probability can also be written as a percentage, which is a number from 0 to 100 percent. The higher the probability number or percentage of an event, the more likely is it that the event will occur.

The probability of a certain event occurring depends on how many possible outcomes the event has. If an event has only one possible outcome, the probability for this outcome is always 1 (or 100 percent). If there is more than one possible outcome, however, this changes. A simple example is the coin toss. If you toss a coin, there are two possible outcomes (heads or tails). As long as the coin was not manipulated, the theoretical probabilities of both outcomes are the same–they are equally probable. The sum of all possible outcomes is always 1 (or 100 percent) because it is certain that one of the possible outcomes will happen. This means that for the coin toss, the theoretical probability of either heads or tails is 0.5 (or 50 percent).

It gets more complicated with a six-sided die. In this case if you roll the die, there are 6 possible outcomes (1, 2, 3, 4, 5 or 6). Can you figure out what the theoretical probability for each number is? It is 1/6 or 0.17 (or 17 percent). In this activity, you will put your probability calculations to the test. The interesting part about probabilities is that knowing the theoretical likelihood of a certain outcome doesn’t necessarily tell you anything about the experimental probabilities when you actually try it out (except when the probability is 0 or 1). For example, outcomes with very low theoretical probabilities do actually occur in reality, although they are very unlikely. So how do your theoretical probabilities match your experimental results? You will find out by tossing a coin and rolling a die in this activity.

Materials

  • Coin
  • Six-sided die
  • Paper
  • Pen or pencil

Preparation

  • Prepare a tally sheet to count how many times the coin has landed on heads or tails.
  • Prepare a second tally sheet to count how often you have rolled each number with the die.

Procedure

  • Calculate the theoretical probability for a coin to land on heads or tails, respectively. Write the probabilities in fraction form. What is the theoretical probability for each side? 
  • Now get ready to toss your coin. Out of the 10 tosses, how often do you expect to get heads or tails?
  • Toss the coin 10 times. After each toss, record if you got heads or tails in your tally sheet.
  • Count how often you got heads and how often you got tails. Write your results in fraction form. For example, 3 tails out of 10 tosses would be 3/10 or 0.3. (The denominator will always be the number of times you toss the coin, and the numerator will be the outcome you are measuring, such as the number of times the coin lands on tails.) You could also express the same results looking at heads landings for the same 10 tosses. So that would be 7 heads out of 10 tosses: 7/10 or 0.7. Do your results match your expectations?
  • Do another 10 coin tosses. Do you expect the same results? Why or why not?
  • Compare your results from the second round with the ones from the first round. Are they the same? Why or why not?
  • Continue tossing the coin. This time toss it 30 times in a row. Record your results for each toss in your tally sheet. What results do you expect this time?
  • Look at your results from the 30 coin tosses and convert them into fraction form. How are they different from your previous results for the 10 coin tosses?
  • Count how many heads and tails you got for your total coin tosses so far, which should be 50. Again, write your results in fraction form (with the number of tosses as the denominator (50) and the result you are tallying as the numerator). Does your experimental probability match your theoretical probability from the first step? (An easy way to convert this fraction into a percentage is to multiply the denominator and the numerator each by 2, so 50 x 2 = 100. And after you multiply your numerator by 2, you will have a number that is out of 100—and a percentage.)
  • Calculate the theoretical probability for rolling each number on a six-sided die. Write the probabilities in fraction form. What is the theoretical probability for each number?
  • Take the dice and roll it 10 times. After each roll, record which number you got in your tally sheet. Out of the 10 rolls, how often do you expect to get each number?
  • After 10 rolls, compare your results (written in fraction form) with your predictions. How close are they?
  • Do another 10 rolls with the dice, recording the result of each roll. Do your results change?
  • Now roll the dice 30 times in a row (recording the result after each roll). How often did you roll each number this time?
  • Count how often you rolled each number in all combined 50 rolls. Write your results in fraction form. Does your experimental probability match your theoretical probability? (Use the same formula you used for the coin toss, multiplying the denominator and the numerator each by 2 to get the percentage.)
  • Compare your calculated probability numbers with your actual data for both activities (coin and dice). What do your combined results tell you about probability?
  • Extra: Increase the number of coin tosses and dice rolls even further. How do your results compare with the calculated probabilities with increasing number of events (tosses or rolls)? 
  • Extra: Look up how probabilities can be represented by probability trees. Can you draw a probability tree for the coin toss and dice roll?
  • Extra: If you are interested in more advanced probability calculations, find out how you can calculate the probability of a recurring event, for example: How likely it is that you would get two heads in a row when tossing a coin? 

Observations and Results
Calculating the probabilities for tossing a coin is fairly straightforward. A coin toss has only two possible outcomes: heads or tails. Both outcomes are equally likely. This means that the theoretical probability to get either heads or tails is 0.5 (or 50 percent). The probabilities of all possible outcomes should add up to 1 (or 100 percent), which it does. When you tossed the coin 10 times, however, you most likely did not get five heads and five tails. In reality, your results might have been 4 heads and 6 tails (or another non-5-and-5 result). These numbers would be your experimental probabilities. In this example, they are 4 out of 10 (0.4) for heads and 6 out of 10 (0.6) for tails. When you repeated the 10 coin tosses, you probably ended up with a different result in the second round. The same was probably true for the 30 coin tosses. Even when you added up all 50 coin tosses, you most likely did not end up in a perfectly even probability for heads and tails. Your experimental probabilities thus probably didn’t match your calculated (theoretical) probabilities.

You likely observed a similar phenomenon when rolling the dice. Although the theoretical probability for each number is 1 out of 6 (1/6 or 0.17), in reality your experimental probabilities probably looked different. Instead of rolling each number 17 percent out of your total rolls, you might have rolled them more or less often.

If you continued tossing the coin or rolling the dice, you probably have observed that the more trials (coin tosses or dice rolls) you did, the closer the experimental probability was to the theoretical probability. Overall these results mean that even if you know the theoretical probabilities for each possible outcome, you can never know what the actual experimental probabilities will be if there is more than one outcome for an event. After all, a theoretical probability is just predicting how the chances are that an event or a specific outcome occurs—it won’t tell you what will actually happen!

For more insights like this, visit our website at www.international-maths-challenge.com.

Credit of the article given to Science Buddies & Svenja Lohner


Nothing matters: how the invention of zero helped create modern mathematics

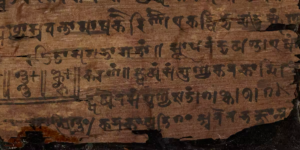
A small dot on an old piece of birch bark marks one of the biggest events in the history of mathematics. The bark is actually part of an ancient Indian mathematical document known as the Bakhshali manuscript. And the dot is the first known recorded use of the number zero. What’s more, researchers from the University of Oxford recently discovered the document is 500 years older than was previously estimated, dating to the third or fourth century – a breakthrough discovery.

Today, it’s difficult to imagine how you could have mathematics without zero. In a positional number system, such as the decimal system we use now, the location of a digit is really important. Indeed, the real difference between 100 and 1,000,000 is where the digit 1 is located, with the symbol 0 serving as a punctuation mark.

Yet for thousands of years we did without it. The Sumerians of 5,000BC employed a positional system but without a 0. In some rudimentary form, a symbol or a space was used to distinguish between, for example, 204 and 20000004. But that symbol was never used at the end of a number, so the difference between 5 and 500 had to be determined by context.

What’s more, 0 at the end of a number makes multiplying and dividing by 10 easy, as it does with adding numbers like 9 and 1 together. The invention of zero immensely simplified computations, freeing mathematicians to develop vital mathematical disciplines such as algebra and calculus, and eventually the basis for computers.

Zero’s late arrival was partly a reflection of the negative views some cultures held for the concept of nothing. Western philosophy is plagued with grave misconceptions about nothingness and the mystical powers of language. The fifth century BC Greek thinker Parmenides proclaimed that nothing cannot exist, since to speak of something is to speak of something that exists. This Parmenidean approach kept prominent historical figures busy for a long while.

After the advent of Christianity, religious leaders in Europe argued that since God is in everything that exists, anything that represents nothing must be satanic. In an attempt to save humanity from the devil, they promptly banished zero from existence, though merchants continued secretly to use it.

By contrast, in Buddhism the concept of nothingness is not only devoid of any demonic possessions but is actually a central idea worthy of much study en route to nirvana. With such a mindset, having a mathematical representation for nothing was, well, nothing to fret over. In fact, the English word “zero” is originally derived from the Hindi “sunyata”, which means nothingness and is a central concept in Buddhism.

The Bakhshali manuscript. Bodleian Libraries

So after zero finally emerged in ancient India, it took almost 1,000 years to set root in Europe, much longer than in China or the Middle East. In 1200 AD, the Italian mathematician Fibonacci, who brought the decimal system to Europe, wrote that:

The method of the Indians surpasses any known method to compute. It’s a marvellous method. They do their computations using nine figures and the symbol zero.

This superior method of computation, clearly reminiscent of our modern one, freed mathematicians from tediously simple calculations, and enabled them to tackle more complicated problems and study the general properties of numbers. For example, it led to the work of the seventh century Indian mathematician and astronomer Brahmagupta, considered to be the beginning of modern algebra.

Algorithms and calculus

The Indian method is so powerful because it means you can draw up simple rules for doing calculations. Just imagine trying to explain long addition without a symbol for zero. There would be too many exceptions to any rule. The ninth century Persian mathematician Al-Khwarizmi was the first to meticulously note and exploit these arithmetic instructions, which would eventually make the abacus obsolete.

Such mechanical sets of instructions illustrated that portions of mathematics could be automated. And this would eventually lead to the development of modern computers. In fact, the word “algorithm” to describe a set of simple instructions is derived from the name “Al-Khwarizmi”.

The invention of zero also created a new, more accurate way to describe fractions. Adding zeros at the end of a number increases its magnitude, with the help of a decimal point, adding zeros at the beginning decreases its magnitude. Placing infinitely many digits to the right of the decimal point corresponds to infinite precision. That kind of precision was exactly what 17th century thinkers Isaac Newton and Gottfried Leibniz needed to develop calculus, the study of continuous change.

And so algebra, algorithms, and calculus, three pillars of modern mathematics, are all the result of a notation for nothing. Mathematics is a science of invisible entities that we can only understand by writing them down. India, by adding zero to the positional number system, unleashed the true power of numbers, advancing mathematics from infancy to adolescence, and from rudimentary toward its current sophistication.

For more insights like this, visit our website at www.international-maths-challenge.com.
Credit of the article given to Ittay Weiss


Five ways ancient India changed the world – with maths

It should come as no surprise that the first recorded use of the number zero, recently discovered to be made as early as the 3rd or 4th century, happened in India. Mathematics on the Indian subcontinent has a rich history going back over 3,000 years and thrived for centuries before similar advances were made in Europe, with its influence meanwhile spreading to China and the Middle East.

As well as giving us the concept of zero, Indian mathematicians made seminal contributions to the study of trigonometry, algebra, arithmetic and negative numbers among other areas. Perhaps most significantly, the decimal system that we still employ worldwide today was first seen in India.

The number system

As far back as 1200 BC, mathematical knowledge was being written down as part of a large body of knowledge known as the Vedas. In these texts, numbers were commonly expressed as combinations of powers of ten. For example, 365 might be expressed as three hundreds (3×10²), six tens (6×10¹) and five units (5×10⁰), though each power of ten was represented with a name rather than a set of symbols. It is reasonable to believe that this representation using powers of ten played a crucial role in the development of the decimal-place value system in India.

Brahmi numerals. Wikimedia

From the third century BC, we also have written evidence of the Brahmi numerals, the precursors to the modern, Indian or Hindu-Arabic numeral system that most of the world uses today. Once zero was introduced, almost all of the mathematical mechanics would be in place to enable ancient Indians to study higher mathematics.

The concept of zero

Zero itself has a much longer history. The recently dated first recorded zeros, in what is known as the Bakhshali manuscript, were simple placeholders – a tool to distinguish 100 from 10. Similar marks had already been seen in the Babylonian and Mayan cultures in the early centuries AD and arguably in Sumerian mathematics as early as 3000-2000 BC.

But only in India did the placeholder symbol for nothing progress to become a number in its own right. The advent of the concept of zero allowed numbers to be written efficiently and reliably. In turn, this allowed for effective record-keeping that meant important financial calculations could be checked retroactively, ensuring the honest actions of all involved. Zero was a significant step on the route to the democratisation of mathematics.

These accessible mechanical tools for working with mathematical concepts, in combination with a strong and open scholastic and scientific culture, meant that, by around 600AD, all the ingredients were in place for an explosion of mathematical discoveries in India. In comparison, these sorts of tools were not popularised in the West until the early 13th century, though Fibonnacci’s book liber abaci.

Solutions of quadratic equations

In the seventh century, the first written evidence of the rules for working with zero were formalised in the Brahmasputha Siddhanta. In his seminal text, the astronomer Brahmagupta introduced rules for solving quadratic equations (so beloved of secondary school mathematics students) and for computing square roots.

Rules for negative numbers

Brahmagupta also demonstrated rules for working with negative numbers. He referred to positive numbers as fortunes and negative numbers as debts. He wrote down rules that have been interpreted by translators as: “A fortune subtracted from zero is a debt,” and “a debt subtracted from zero is a fortune”.

This latter statement is the same as the rule we learn in school, that if you subtract a negative number, it is the same as adding a positive number. Brahmagupta also knew that “The product of a debt and a fortune is a debt” – a positive number multiplied by a negative is a negative.

For the large part, European mathematicians were reluctant to accept negative numbers as meaningful. Many took the view that negative numbers were absurd. They reasoned that numbers were developed for counting and questioned what you could count with negative numbers. Indian and Chinese mathematicians recognised early on that one answer to this question was debts.

For example, in a primitive farming context, if one farmer owes another farmer 7 cows, then effectively the first farmer has -7 cows. If the first farmer goes out to buy some animals to repay his debt, he has to buy 7 cows and give them to the second farmer in order to bring his cow tally back to 0. From then on, every cow he buys goes to his positive total.

Basis for calculus

This reluctance to adopt negative numbers, and indeed zero, held European mathematics back for many years. Gottfried Wilhelm Leibniz was one of the first Europeans to use zero and the negatives in a systematic way in his development of calculus in the late 17th century. Calculus is used to measure rates of changes and is important in almost every branch of science, notably underpinning many key discoveries in modern physics.

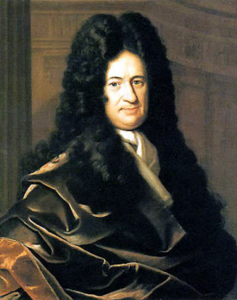
Leibniz: Beaten to it by 500 years.

But Indian mathematician Bhāskara had already discovered many of Leibniz’s ideas over 500 years earlier. Bhāskara, also made major contributions to algebra, arithmetic, geometry and trigonometry. He provided many results, for example on the solutions of certain “Doiphantine” equations, that would not be rediscovered in Europe for centuries.

The Kerala school of astronomy and mathematics, founded by Madhava of Sangamagrama in the 1300s, was responsible for many firsts in mathematics, including the use of mathematical induction and some early calculus-related results. Although no systematic rules for calculus were developed by the Kerala school, its proponents first conceived of many of the results that would later be repeated in Europe including Taylor series expansions, infinitessimals and differentiation.

The leap, made in India, that transformed zero from a simple placeholder to a number in its own right indicates the mathematically enlightened culture that was flourishing on the subcontinent at a time when Europe was stuck in the dark ages. Although its reputation suffers from the Eurocentric bias, the subcontinent has a strong mathematical heritage, which it continues into the 21st century by providing key players at the forefront of every branch of mathematics.

For more insights like this, visit our website at www.international-maths-challenge.com.
Credit of the article given to Christian Yates


Thinking about How and Why We Prove

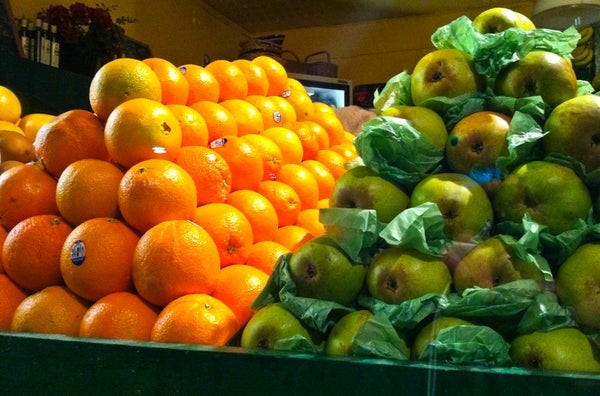
Credit: Evelyn Lamb

Stacking oranges leads to computer-assisted mathematics. But does it feel like mathematics?

Earlier this month, I attended the Joint Mathematics Meetings in Seattle. One of the reasons I enjoy going to the JMM is that I can get a feel for what is going on in parts of mathematics that I’m not terribly familiar with. This year, I attended two talks in a session called “mathematical information in the digital age,” that got me thinking about what mathematicians do.

First, a confession: I went to the session because I like oranges. The first talk was by Thomas Hales, who is probably best known for his proof of the Kepler conjecture. In short, the conjecture says that the way grocers stack oranges is indeed the most efficient way to do it. The proof was a long case-by-case exhaustion, and Hales was not satisfied with a referee report that said the referee was 99% sure the proof was correct. So he did what any* mathematician would do: he took more than a decade to write and verify a formal computer proof of the result. I attended the talk because I figured there’s a small chance that any talk that mentions the Kepler conjecture might have oranges for the audience.

Hales’ talk was called simply “Formal Proofs.” These are not proofs that are written using stuffy language, with every single step written out, but proofs that can be input into a computer and verified all the way down to the foundations of mathematics, whichever foundations one chooses.

Hales began his talk with some examples of less-than-formal proofs, starting with a passage from William Thurston in which he used the phrase “subdivide and jiggle,” clearly not a rigorous way to describe mathematics. (Incidentally, Thurston also did mathematics with oranges. He would ask students to peel oranges to better understand 2- and 3-dimensional geometry.)

Although I never met Thurston, I am one of his many mathematical descendants. his approach to mathematics, particularly his emphasis on intuition and imagination, has permeated the culture in my extended mathematical family and has had a great deal of influence on how I think about mathematics. That is why it was so refreshing for me to go to a talk where intuition wasn’t a primary focus.

Hales was certainly not insinuating that Thurston was a bad mathematician. Thurston was only the first mathematician he used as an example of less-than-rigorously stated mathematics. A few slides later he mentioned the Bourbaki book on set theory. Yes, even that paragon of formal mathematics sucked dry of every drop of intuition, is not really full of formal proofs.

Hales’ talk was a nice overview of the formal proof programs out there, some mathematical results that have been proved formally (including some that were already known), and a nice introduction to where the field is going. I’m particularly interested in learning more about the QED manifesto and FABSTRACTS, a service that would formalize the abstracts of mathematical papers, a much more tractable goal than formalizing an entire paper.

The most amusing moment of the talk, at least to me, was a question from someone in the audience about the possibility of using a formal proof assistant to verify Mochizuki’s proof of the abc conjecture. Hales replied that with the current technology, you do need to understand the proof as you enter it, so there aren’t many people who can do it. The logical response: why doesn’t Mochizuki do it himself? Let’s just say I’m not holding my breath.

The second talk I attended in the session was Michael Shulman’s called “From the nLab to the HoTT book.” He talked about both the nLab, a wiki for category theory, and the writing of the Homotopy Type Theory “research textbook,” a 600-page tome put together during an IAS semester about homotopy type theory, an alternative to set theory as a foundational system for mathematics. The theme of Shulman’s talk was “one size does not fit all,” either in the way people collaborate (contrasting the wiki and the textbook) or even in the foundations of mathematics (type theory versus set theory).

I don’t know if it was intended, but I thought Shulman’s talk was an interesting counterpoint to Hales,’ most relevantly to me in the way it answered one of the questions Hales posed: why don’t more mathematicians use proof assistants? Beyond the fact that proof assistants are currently too unwieldy for many of us, Shulman’s answer was that we do mathematics for understanding, not just truth. He said what I was thinking during Hales’ talk, which was that to many mathematicians, using a formal proof assistant does not “feel like” mathematics. I am not claiming moral high ground here. It is actually something of a surprise to me that the prospect of being able to find and verify new truths more quickly is not more important to me.

You never know what you’re going to get when you wander into a talk that is well outside your mathematical comfort zone. In my case, I didn’t end up with any oranges, but I got some interesting new-ti-me perspectives about how and why we prove.

*almost no

For more insights like this, visit our website at www.international-maths-challenge.com.

Credit of the article given to Evelyn Lamb


The Mathematics of Cake Cutting

Credit: OLENA SHMAHALO Quanta Magazine

Computer scientists have come up with an algorithm that can fairly divide a cake among any number of people

Two young computer scientists have figured out how to fairly divide cake among any number of people, setting to rest a problem mathematicians have struggled with for decades. Their work has startled many researchers who believed that such a fair-division protocol was probably impossible.

Cake-cutting is a metaphor for a wide range of real-world problems that involve dividing some continuous object, whether it’s cake or, say, a tract of land, among people who value its features differently—one person yearning for chocolate frosting, for example, while another has his eye on the buttercream flowers. People have known at least since biblical times that there’s a way to divide such an object between two people so that neither person envies the other: one person cuts the cake into two slices that she values equally, and the other person gets to choose her favorite slice. In the book of Genesis, Abraham (then known as Abram) and Lot used this “I cut, you choose” procedure to divide land, with Abraham deciding where to divide and Lot choosing between Jordan and Canaan.

Around 1960, mathematicians devised an algorithm that can produce a similarly “envy-free” cake division for three players. But until now, the best they had come up with for more than three players was a procedure created in 1995 by political scientist Steven Brams of New York University and mathematician Alan Taylor of Union College in Schenectady, New York, which is guaranteed to produce an envy-free division, but it is “unbounded,” meaning that it might need to run for a million steps, or a billion, or any large number, depending on the players’ cake preferences.

Brams and Taylor’s algorithm was hailed as a breakthrough at the time, but “the fact that it wasn’t bounded I think was a huge shortcoming,” said Ariel Procaccia, a computer scientist at Carnegie Mellon University and one of the creators of Spliddit, a free online tool that provides fair-division algorithms for tasks like dividing chores or rent among roommates.

Over the past 50 years, many mathematicians and computer scientists, including Procaccia, had convinced themselves that there was probably no bounded, envy-free algorithm for dividing cake among n players.

“This is the very problem that got me into the subject of fair division,” said Walter Stromquist, a mathematics professor at Bryn Mawr College in Pennsylvania who proved some of the seminal results on cake cutting in 1980. “I have thought all my life that I would come back to it when I had time and prove that this particular extension of the result was impossible.”

But in April, two computer scientists defied expectations by posting a paper online describing an envy-free cake-cutting algorithm whose running time depends only on the number of players, not on their individual preferences. One of the pair—27-year-old Simon Mackenzie, a postdoctoral researcher at Carnegie Mellon—will present the pair’s findings on Oct. 10 at the 57th annual IEEE Symposium on Foundations of Computer Science, one of computer science’s pre-eminent conferences.

The algorithm is extraordinarily complex: Dividing a cake among n players can require as many as n^n^n^n^n^n steps and a roughly equivalent number of cuts. Even for just a handful of players, this number is greater than the number of atoms in the universe. But the researchers already have ideas for making the algorithm much simpler and faster, said the other half of the team, Haris Aziz, a 35-year-old computer scientist at the University of New South Wales and Data61, a data research group in Australia.

For the people who study the theory of fair division, this is “definitely the biggest result in decades,” Procaccia said.

Pieces of Cake

Aziz and Mackenzie’s new algorithm builds on an elegant procedure that mathematicians John Selfridge and John Conway independently came up with around 1960 for dividing a cake among three people.

If Alice, Bob and Charlie want to share a cake, the algorithm starts by having Charlie cut the cake into three slices that are equally valuable from his perspective. Alice and Bob are each asked to point to their favorite slices, and if they like different slices, we’re done—they each take their favorite, Charlie takes the remaining slice, and everyone goes home happy.

If Alice and Bob have the same favorite, then Bob is asked to trim a little cake off that slice so that what remains is equal in value to his second-favorite slice; the trimmed bit is set aside for later. Now Alice gets to choose her favorite piece from among the three slices, and then Bob gets to choose, with the requirement that if Alice didn’t choose the trimmed slice, he must take it. Charlie gets the third slice.

At this stage, none of the players envy each other. Alice is happy since she got to choose first; Bob is happy since he got one of his two equally preferred top choices; and Charlie is happy because he got one of his three original pieces, all of which are equal in his eyes.

But there’s still the trimmed bit to be divided. What makes it possible to divide this bit without creating still more trimmings, and getting into an infinite cycle of trimming and choosing, is the fact that Charlie is more than merely satisfied with the cake he has gotten so far; he would not feel cheated even if the player with the trimmed slice gets all the cake that’s waiting to be allocated, since the trimmed slice plus the trimming equals one of the original slices. Aziz and Mackenzie describe this relationship by saying that Charlie “dominates” the player who got the trimmed slice.

Now if, for example, Alice was the one who got the trimmed slice, the algorithm proceeds as follows: Bob cuts the trimmings into three pieces that he values equally, and then first Alice gets to choose a piece, then Charlie, then Bob. Everyone is happy: Alice because she got to choose first, Charlie because he gets a slice he likes better than Bob’s (and he didn’t care how much Alice took), and Bob because the three slices are equal in his view.

Brams and Taylor used the notion of domination (without calling it that) in designing their 1995 algorithm, but they couldn’t push the idea far enough to get a bounded algorithm. For the next 20 years, neither could anyone else. “I don’t think it’s for lack of trying,” Procaccia said.

Rookie Cake-Cutters

When Aziz and Mackenzie decided to tackle the problem a couple of years ago, they were comparative newcomers to the cake-cutting problem. “We did not have as much background as people who have been intensely working on it would have,” Aziz said. “Although that is mostly a disadvantage, in this case it was somewhat of an advantage, because we were not thinking in the same way.

Aziz and Mackenzie wet their feet by studying the three-player problem from scratch, and their analysis eventually led them to find a bounded envy-free algorithm for the four-player case, which they posted online last year.

They couldn’t immediately see how to extend their algorithm to more than four players, but they dived feverishly into the problem. “After we submitted our paper for the four-agent case, we were really keen that we should try it before someone much more experienced, much more clever would generalize it to the n-agent case,” Aziz said. After about a year, their efforts succeeded.

As with the Selfridge-Conway algorithm, Aziz and Mackenzie’s complicated protocol repeatedly asks individual players to cut cake into n equal pieces, then asks other players to make trims and choose pieces of cake. But the algorithm also carries out other steps, such as periodically exchanging portions of players’ cake stashes in a carefully controlled way, with an eye toward increasing the number of domination relationships between players.

These domination relationships allow Aziz and Mackenzie to reduce the complexity of the problem: If, for example, three players dominate all the others, those three can be sent away with their slices of cake—they’ll be happy no matter who gets the remaining trimmings. Now there are fewer players to worry about, and after a bounded number of such steps, everyone has been satisfied and all the cake given out.

“Seeing, in retrospect, how complicated the algorithm is, it’s not surprising that it took a long time before somebody found one,” Procaccia said. But Aziz and Mackenzie already think that they can simplify their algorithm considerably, to one that doesn’t need the cake exchanges and takes fewer than n^n^n steps. They are currently writing up these new results, Aziz said.

Even a simpler such algorithm would be unlikely to have practical implications, Brams cautioned, since the cake portions that players receive would typically include many tiny crumbs from different parts of the cake—not a feasible approach if you’re dividing something like a tract of land.

But for mathematicians and computer scientists who study cake cutting, the new result “resets the subject,” Stromquist said.

Now that researchers know it’s possible to fairly divide cake in a bounded number of steps, the next goal, Procaccia said, is to understand the huge gulf between Aziz and Mackenzie’s upper bound and the existing lower bound on the number of cuts needed to divide a cake.

Procaccia had previously proved that an envy-free cake-cutting algorithm will require at least about n2 steps—but that bound is minuscule compared to n^n^n^n^n^n or even n^n^n.

Researchers now have to figure out how to close this gap, Aziz said. “I think there can be progress in both directions.”

For more insights like this, visit our website at www.international-maths-challenge.com.

Credit of the article given to Erica Klarreich & Quanta Magazine


A newly discovered prime number makes its debut

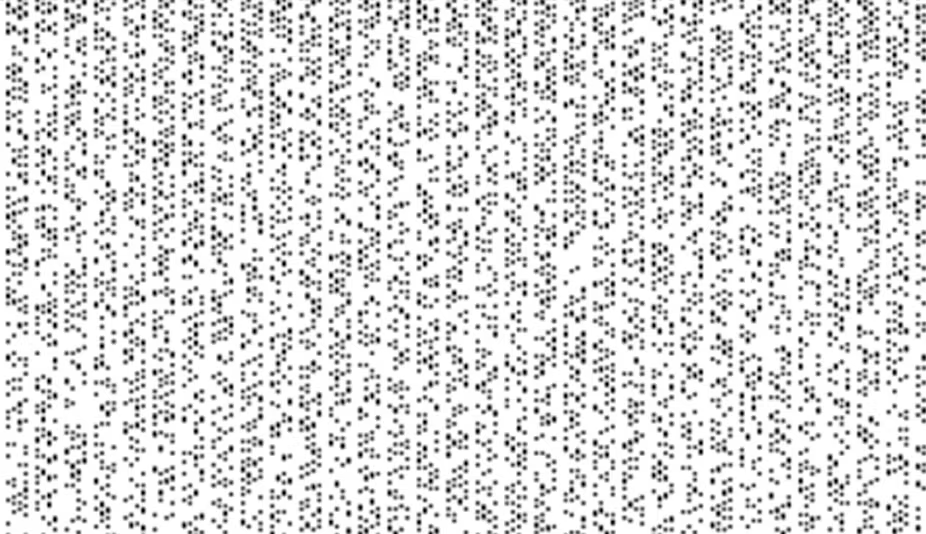
The distribution of prime numbers from 1 to 76,800, from left to right and top to bottom. A black pixel means that the number is first, while a white pixel means that it is not.

On December 26, 2017, J. Pace, G. Woltman, S. Kurowski, A. Blosser, and their co-authors announced the discovery of a new prime number): 2⁷⁷²³²⁹¹⁷-1. It’s an excellent opportunity to take a small tour through the wonderful world of prime numbers to see how this result was achieved and why it is so interesting.

prime number is one that is divisible only by itself and the number 1, that is, essentially a number that has no divisor. Some speak of prime numbers as the atoms of the mathematical universe, others as precious stones.

US stamp featuring the prime number 2¹¹²¹³-1. Author provided, CC BY

It is to Euclid that we owe the first two definitions of a prime number:

  • Any number is the unique product of prime factors.
  • They are infinite in number. The demonstration of this result is regarded as the first proof by absurdity: Suppose there is only a finite number of prime numbers, so they are all smaller than an integer n. Any integer greater than n would therefore be divisible by a prime number less than n. However, the number (2 * 3 * … * n) + 1 is not divisible by any integer from 2 to n since the remainder of the division is always 1 – a contradiction of the preceding sentence.

Eratosthenes, who lived from -276 to -194, proposed a process that allows us to find all prime numbers less than a given natural number N. The process consists of eliminating from a table integers from 2 to N that are multiples of those numbers. By deleting all the multiples, there remain only integers that are not multiples of any integer, and so are prime numbers. The search for efficient algorithms is an active research topic – for example for the Lucas-Lehmer test.

After the Greek era, there was a long dark period that lasted until the end of the 16th century and the arrival of French theologian and mathematician Marin Mersenne (1588-1648). He was an advocate of Catholic orthodoxy, yet also believed that religion must welcome any updated truth. He was a Cartesian and translator of Galileo.

Mersenne was looking for a formula that would generate all the prime numbers. In particular, he studied the numbers Mp = 2p-1, where p is prime. These numbers are now called Mersenne numbers or Mersenne primes. In 1644 he wrote that Mp is prime for p = 2, 3, 5, 7, 13, 17, 19, 31, 67, 127, 257, and compound – in other words, non-prime – for the other 44 lower p values at 257. These definition actually commits five errors: M61, M89 and M107 are prime, while M67 and M257 are not.

The new prime number discovered at the very end of 2017 corresponds to M77232917. It has 23,249,425 digits – almost a million digits more than the previous record-holding prime. If the number were contained by a document written in the font Times New Roman with a point size of 10 and standard page margins, it would fill 3,845 pages.

The official date of discovery of a prime number is the day that someone declares the result. This is in keeping with tradition: M4253 is reputed not to have one because in 1961 the American mathematician Alexander Hurwitz read a printer output from the end forward, and found M4423 a few seconds before seeing M4253. The previous Mersenne number also had a complicated history: the computer reported the result to the server on September 17, 2015, but a bug blocked the email. The prime number remained unnoticed until January 7, 2016.

Quantum cryptography

We often refer to the use of prime numbers in cryptography, but they’re too big to be really useful. (There is hope that quantum cryptography will change things.) Historically, Mersenne’s search for prime numbers has been used as a test for computer hardware. In 2016, the premium95 community discovered a flaw in Intel’s Skylake CPU as well as many PCs. This prime number was found as part of the Great Internet Mersenne Prime Search Project (GIMPS).

2⁷⁷²³²⁹¹⁷-1 is the 50th Mersenne prime and if the challenge to discover the 51st tempts you, the verification program is available to all – and there’s even a $3,000 prize.

For more insights like this, visit our website at www.international-maths-challenge.com.
Credit of the article given to Avner Bar-Hen