What influences the choices we make, and what role does the behaviour of others have on these choices? These questions underlie many aspects of human behaviour, including the products we buy, fashion trends, and even the breed of pet we choose as our companion.
Now, a new Stanford study that used population and statistical models to analyse the frequency of specific moves in 3.45 million chess games helps reveal the factors that influence chess players’ decisions. The researchers’ analysis of chess games revealed three types of biases described by the field of cultural evolution, which uses ideas from biology to explain how behaviours are passed from person to person. Specifically, they found evidence of players copying winning moves (success bias), choosing atypical moves (anti-conformity bias), and copying moves by celebrity players (prestige bias).
The study summarizing their results was published Nov. 15 in the Proceedings of the Royal Society B: Biological Sciences.
“We are all subject to biases,” said Marcus Feldman, the Burnet C. and Mildred Finley Wohlford Professor in the Stanford School of Humanities and Sciences and senior author. “Most biases are acquired from our parents or learned from our teachers, peers, or relatives.”
Feldman, a professor of biology, co-founded the field of cultural evolution 50 years ago with the late Luca Cavalli-Sforza, professor of genetics at Stanford School of Medicine, as a framework for studying changes in human behaviour that can be learned and transmitted between people. In the past, many studies of cultural evolution were theoretical because large datasets of cultural behaviour didn’t exist. But now they do.
The way chess is played has evolved over time too.
“Over the last several hundred years, paintings of chess playing show a change from crowded disorganized scenes to the quiet concentration we associate with the game today,” said Noah Rosenberg, the Stanford Professor in Population Genetics and Society in H&S.
“In the 18th century, players subscribed to a knightly sort of behaviour,” said Egor Lappo, lead author and a graduate student in Rosenberg’s lab. “Even if a move obviously led to a win, if it could be interpreted as cowardly, the player would reject it. Today, this is no longer the case.”
“The thesis of the paper is that when an expert player makes a move, many factors could influence move choice,” Rosenberg said. “The baseline is to choose a move randomly among the moves played recently by other expert players. Any deviations from this random choice are known in the field of cultural evolution as cultural biases.”
“In the mid-century players eschewed the Queen’s Gambit,” Feldman said. “There didn’t seem to be anything rational about this choice. In a large database of chess games by master-level players, the players’ biases can change over time, and that makes chess an ideal subject to use to explore cultural evolution.”
Playing the game
Chess is often called a game of perfect information because all pieces and their positions are clearly visible to both players. Yet simply knowing the present location of all pieces won’t win a chess game. Games are won by visualizing the future positions of pieces, and players develop this skill by studying the moves made by top chess players in different situations.
Fortunately for chess players (and researchers), the moves and game outcomes of top-level chess matches are recorded in books and, more recently, online chess databases.
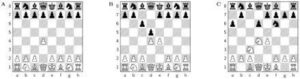
In chess, two players take turns moving white (player 1) and black (player 2) pieces on a board checkered with 64 positions. The player with the white pieces makes the first move, each piece type (e.g., knight, pawn) moves a specific way, and (except for a special move called castling) each player moves one piece each turn.
There are few move options in the opening (beginning) of a chess game, and players often stick to tried-and-true sequences of moves, called lines, which are frequently given names like Ruy Lopez and the Frankenstein-Dracula Variation. The opening lines of master and grandmaster (top-level) players are often memorized by other players for use in their own games.
The researchers considered chess matches of master-level players between 1971 and 2019, millions of which have been digitized and are publicly available for analysis by enthusiasts.
“We used a population genetics model that treats all chess games played in a year as a population,” Lappo said. “The population of games in the following year is produced by players picking moves from the previous year to play in their own games.”
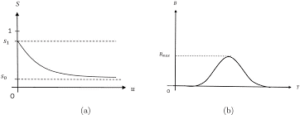
To search for possible cultural biases in the dataset of chess moves and games, the researchers used mathematical models to describe patterns that correspond to each kind of bias. Then they used statistical methods to see if the data matched (“fit”) the patterns corresponding to those cultural biases.
A value consistent with players choosing randomly from the moves played the year before indicated there was no cultural bias. This was the average “baseline” strategy. Success bias (copying winning moves) corresponded to values that were played by winning players in the previous year. Prestige bias (copying celebrity moves) corresponded to values that matched the frequencies of lines and moves played by the top 50 players in the previous year. Anti-conformity bias (unpopular moves) corresponded to choosing moves played infrequently in the previous year.
In the paper, the researchers focused on three frequently played moves at different depths of the opening to explore possible biases in early game play—the Queen’s Pawn opening, the Caro-Kann opening, and the Najdorf Sicilian opening.
Before the Queen’s Gambit was cool
For a game that is synonymous with strategy, relatively little is known about the factors that could affect a player’s choice of strategy. This study revealed evidence of cultural biases in the openings of master-level games played between 1971 and 2019.
In the Queen’s Pawn opening, players sometimes choose outlandish moves to rattle their opponents (anti-conformity bias). In the Caro-Kann opening, the study found that players mimic moves associated with winning chess games more often than expected by chance (success bias). And in the Najdorf Sicilian, players copy moves played by top players in famous games (prestige bias).
“The way people get their information about chess games changed between 1971 and 2019,” Rosenberg said. “It is easier now for players to see recent games of master- and grandmaster-level players.”
“The data also show that over time it is increasingly hard for the player with white pieces to make use of their first-move advantage,” Lappo said.
Many of the results align with ideas that are common knowledge among chess players, such as the concept that playing well-known lines is generally preferable to in-the-moment strategies in the opening. The researchers suggest that their statistical approach could be applied to other games and cultural trends in areas where long-term data on choices exist.
“This dataset makes questions related to the theory of cultural evolution useful and applicable in a way that wasn’t possible before,” Feldman said. “The big questions are what behaviour is transmitted, how is it transmitted, and to whom is it transmitted. With respect to the moves we analysed, Egor has the answers, and that is very satisfying.”
For more such insights, log into our website https://international-maths-challenge.com
Credit of the article given to Holly Alyssa MacCormick, Stanford University