When children start school, they learn how to recite their numbers (“one, two, three…”) and how to write them (1, 2, 3…). Learning about what those numbers mean is even more challenging, and this becomes trickier yet when numbers have more than one digit — such as 42 and 608.
It turns out that the meaning of such “multidigit” numbers cannot be gleaned from simply looking at them or by performing calculations with them. Our number system has many hidden meanings that are not transparent, making it difficult for children to comprehend it.
In collaboration with elementary teachers, the Mathematics Teaching and Learning Lab at Concordia University explores tools that can support young children’s understanding of multidigit numbers.
We investigate the impact of using concrete objects (like bundling straws into groups of 10). We also investigate the use of visual tools, such as number lines and charts, or words to represent numbers (the word for 40 is “forty”) and written notation (for example, 42).
Our recent research examined whether the “hundreds chart” — 10 by 10 grids containing numbers from one to 100, with each row in the chart containing numbers in groups of 10 — could be useful for teaching children about counting by 10, something foundational for understanding how numbers work.

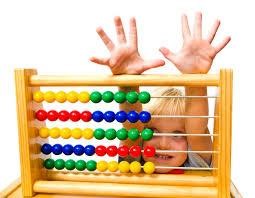
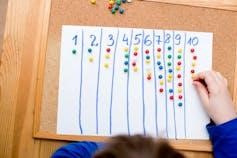
When children start learning about numbers, they do not naturally see tens and ones in a number like 42. (Shutterstock)
What’s in a number?
Most adults know that the placement of the “4” and “2” in 42 means four tens and two ones, respectively.
But when young children start learning about numbers, they do not naturally see 10s and ones in a number like 42. They think the number represents 42 things counted from one to 42 without distinguishing between the meaning of the digits “4” and “2.” Over time, through counting and other activities, children see the four as a collection of 40 ones.
This realization is not sufficient, however, for learning more advanced topics in math.
An important next step is to see that 42 is made up of four distinct groups of 10 and two ones, and that the four 10s can be counted as if they were ones (for example, 42 is one, two, three, four 10s and one, two, “ones”).
Ultimately, one of the most challenging aspects of understanding numbers is that groups of ten and ones are different kinds of units.
Numbers can be arranged in different ways
The numbers in hundreds charts can be arranged in different ways. A top-down hundreds chart has the digit “1” in the top-left corner and 100 in the bottom-right corner.
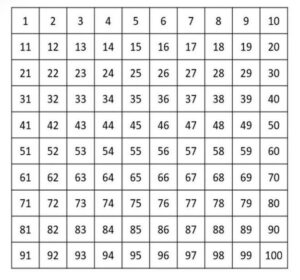
A top-down hundreds chart. (Vera Wagner), Author provided (no reuse)
The numbers increase by 10 moving downward one row at a time, like going from 24 to 34 using one hop down, for instance. A second type of chart is the “bottom-up” chart, which has the numbers increasing in the opposite direction.
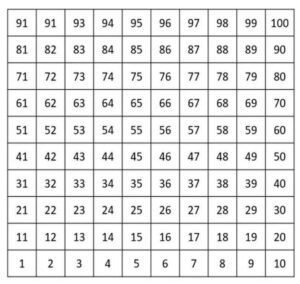
A bottom-up hundreds chart. (Vera Wagner), Author provided (no reuse)
Counting by 10s
Children can move from one number to another in the chart to solve problems. Considering 24 + 20, for example, children could start on 24 and move 20 spaces to land on 44.
Another way would be to move up (or down, depending on the chart) two rows (for example, counting “one,” “two”) until they land on 44. This second method shows a developing understanding of multidigit numbers being composed of distinct groups of 10, which is critical for an advanced knowledge of the number system.
For her master’s research at Concordia University, Vera Wagner, one of the authors of this story, thought children might find it more intuitive to solve problems with the bottom-up chart, where the numbers get larger with upward movement.
After all, plants grow taller and liquid rises in a glass as it is filled. Because of such familiar experiences, she thought children would move by tens more frequently in the bottom-up chart than in the top-down chart.
Study with kindergarteners, Grade 1 students
To examine this hypothesis, we worked with 47 kindergarten and first grade students in Canada and the United States. All the children but one spoke English at home. In addition to English, 14 also spoke French, four spoke Spanish, one spoke Russian, one spoke Arabic, one spoke Mandarin and one communicated to some extent in ASL at home.
We assigned all child participants in the study an online version of either a top-down or bottom-up hundreds chart, programmed by research assistant André Loiselle, to solve arithmetic word problems.
What we found surprised us: children counted by tens more often with the top-down chart than the bottom-up one. This was the exact opposite of what we thought they might do!
This finding suggests that the top-down chart fosters children’s counting by tens as if they were ones (that is, up or down one row at a time), an important step in their mathematical development. Children using the bottom-up chart were more likely to confuse the digits and move in the wrong direction.
Tools can impact learning
Tools used in the math classroom can impact children’s learning. (Shutterstock)
Our research suggests that the types of tools used in the math classroom can impact children’s learning in different ways.
One advantage of the top-down chart could be the corresponding
Our research suggests that the types of tools used in the math classroom can impact children’s learning in different ways.
One advantage of the top-down chart could be the corresponding left-to-right and downward movement that matches the direction in which children learn to read in English and French, the official languages of instruction in the schools in our study. Children who learn to read in a different direction (for example, from right to left, as in Arabic) may interact with some math tools differently from children whose first language is English or French.
The role of cultural experiences in math learning opens up questions about the design of teaching tools for the classroom, and the relevance of culturally responsive mathematics teaching. Future research could seek to directly examine the relation between reading direction and the use of the hundreds chart.
For more such insights, log into our website https://international-maths-challenge.com
Credit of the article given to The Conversation