The science of the casino: why the house always wins in the long run

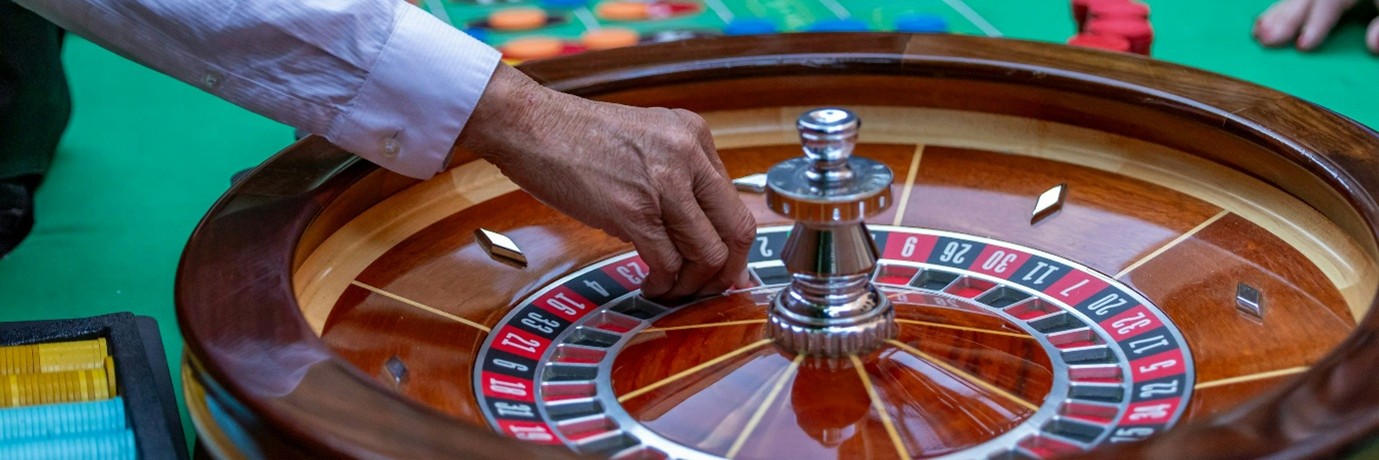
Leo Visions / Unsplash

You’ve probably heard the phrase “the house always wins” when it comes to casino gambling. But what does it actually mean?

After all, people do hit jackpots, and casino games are supposed to be fair – so what guarantees the casino still comes out ahead?

The answer lies in a simple but powerful mathematical idea called “the house edge”: a small, systematic statistical advantage built into every casino game. It’s the invisible force that ensures the numbers will always tilt toward the house in the long run.

So, let’s unpack the science behind that edge: how it’s constructed, and how it plays out over repeated bets.

Roulette: the clearest place to see the house edge at work

Roulette looks like one of the fairest games in the casino. A spinning wheel with numbered pockets, half coloured red and half coloured black, and a single ball sent careening around the outside to eventually land in one pocket at random. If you bet the ball will land in a red pocket (or a black one), it feels like a 50–50 gamble.

But the real odds are a little bit different. In most Australian casinos you’ll find 38 pockets on the roulette wheel: 18 red, 18 black, and two “zero” pockets marked 0 and 00. (In Europe roulette wheels have 37 pockets, with only a single 0.)

The zero pockets are what creates the house edge. The casino pays out as if the odds were 50–50 – if you get the colour right, you get back double the amount you bet. But in reality, on a wheel with two zero pockets your chance of winning is 47.37%.

When you bet on a colour, the house has a 5.26% edge – meaning gamblers lose about five cents per dollar on average. A single-zero wheel is slightly kinder at 2.7%.

You don’t see the house edge in the course of a few spins. But casinos don’t rely on a few spins. Over thousands of bets, the law of large numbers takes over. This is a fundamental idea in probability that implies the more times you repeat a game with fixed odds, the closer your results get to the true mathematical average. The short-term ups and downs flatten out, and the house edge asserts itself with near certainty.

The law of large numbers is why casinos aren’t bothered by who wins this spin, or even tonight. They care about what happens over the next million bets.

The Gamblers’ Ruin problem

Another way to see why the house always wins is through the so-called Gambler’s Ruin problem.

The problem asks what happens if a player with a limited bankroll keeps betting against an opponent with effectively unlimited money (even in a fair game).

The mathematical answer is blunt: the gambler will eventually go broke.

In other words, even if the odds are perfectly even, the side with finite resources loses in the long run simply because random fluctuations will push them to zero at some point. Once you hit zero, the game stops, while the house is still standing.

Casinos, of course, stack the odds even further by giving themselves a small edge on every bet. That tiny disadvantage, combined with the fact the house never runs out of money, makes ruin mathematically inevitable.

The more bets you make, the worse your chances

Say you walk into a casino with a simple goal. You want to win $100, and you plan to quit as soon as you hit that target.

Your approach is to play roulette, betting $1 at a time on either red or black.

How much money do you need to bring to have a decent chance of reaching your $100 goal? A thousand dollars? A million? A billion?

Here’s the surprising truth: no amount of money is enough.

If you keep making $1 bets in a game with a house edge, you are practically certain to go broke before getting $100 ahead of where you started, even if you arrive with a fortune.

In fact, the probability of gaining $100 before losing $100 million with this strategy is less than 1 in 37,000.

You could walk in with life-changing wealth and still almost certainly never hit your modest $100 goal.

Betting bigger may give you a fighting chance

So how do you create a real chance of success? You must either lower your target or change your strategy entirely.

If your target were only $10, you’d suddenly have over a 50% chance of going home happy, even if you started with just $25. A smaller goal means fewer bets, which means less opportunity for the house edge to grind you down.

Or you can flip the logic of Gambler’s Ruin: instead of making hundreds of small, disadvantageous bets, you can make one big bet.

If you put $100 on red all at once, your chance of success jumps to roughly 47%. This is far higher than the near-zero chance of trying to grind your way up with $1 bets.

The long-run strategy is mathematically doomed, while the short-run strategy at least gives you a fighting chance.

A small house edge adds up

Roulette is the clearest place to see the house edge, but the same structure runs through every casino game. Each one builds in a varying degree of statistical tilt or bias.

Some games, like roulette, have fixed, rule-based house edges that don’t change from one player to the next. But others, like blackjack, have a variable house edge that depends on how the game is played. But no game is exempt from the underlying structure.

Small edges don’t stay small when you expose yourself to thousands of bets. In the long run, the variance fades, and the outcome converges to the house’s advantage with almost certainty.

That’s why the house always wins. Because mathematics never takes a night off.

For more such insights, log into www.international-maths-challenge.com.

*Credit for article given to Milad Haghani*


4 creative ways to engage children in STEM over the summer: Tips to foster curiosity and problem-solving at home

Families and caregivers can boost children’s confidence and interest in science, technology, engineering and mathematics while school is out for summer. heshphoto/Getty Images

The Trump administration is reshaping the pursuit of science through federal cuts to research grants and the Department of Education. This will have real consequences for students interested in science, technology, engineering and mathematics, or STEM learning.

One of those consequences is the elimination of learning opportunities such as robotics camps and access to advanced math courses for K-12 students.

As a result, families and caregivers are more essential than ever in supporting children’s learning.

Based on my research, I offer four ways to support children’s summer learning in ways that feel playful and engaging but still foster their interest, confidence and skills in STEM.

Find a problem

To support STEM learning outside of school, encourage children to find and solve problems. kali9/Getty Images

Look for “problems” in or around your home to engineer a solution for. Engineering a solution could include brainstorming ideas, drawing a sketch, creating a prototype or a first draft, testing and improving the prototype and communicating about the invention.

For example, one family in our research created an upside-down soap dispenser for the following problem: “the way it’s designed” − specifically, the straw − “it doesn’t even reach the bottom of the container. So there’s a lot of soap sitting at the bottom.”

To identify a problem and engage in the engineering design process, families are encouraged to use common materials. The materials may include cardboard boxes, cotton balls, construction paper, pine cones and rocks.

Our research found that when children engage in engineering in the home environment with caregivers, parents and siblings, they communicate about and apply science and math concepts that are often “hidden” in their actions.

For instance, when building a paper roller coaster for a marble, children think about how the height will affect the speed of the marble. In math, this relates to the relationship between two variables, or the idea that one thing, such as height, impacts another, the speed. In science, they are applying concepts of kinetic energy and potential energy. The higher the starting point, the more potential energy is converted into kinetic energy, which makes the marble move faster.

In addition, children are learning what it means to be an engineer through their actions and experience. Families and caregivers play a role in supporting their creative thinking and willingness to work through challenging problems.

Spark curiosity

Spontaneous learning moments can lead to deep engagement and learning of STEM concepts. cglade/Getty Images

Open up a space for exploration around STEM concepts driven by their interests.

Currently, my research with STEM professionals who were homeschooled talk about the power of learning sparked by curiosity.

One participant stated, “At one time, I got really into ladybugs, well Asian Beatles I guess. It was when we had like hundreds in our house. I was like, what is happening? So, I wanted to figure out like why they were there, and then the difference between ladybugs and Asian beetles because people kept saying, these aren’t actually ladybugs.”

Researchers label this serendipitous science engagement, or even spontaneous math moments. The moments lead to deep engagement and learning of STEM concepts. This may also be a chance to learn things with your child.

 Facilitate thinking

In my research, being uncertain about STEM concepts may lead to children exploring and considering different ideas. One concept in particular − playful uncertainties − is when parents and caregivers know the answer to a child’s uncertainties but act as if they do not know.

For example, suppose your child asks, “How can we measure the distance between St. Louis, Missouri, and Nashville, Tennessee, on this map?” You might respond, “I don’t know. What do you think?” This gives children the chance to share their ideas before a parent or caregiver guides them toward a response.

Bring STEM to life

Overhearing or participating in budget talks can help children develop math skills and financial literacy. SeizaVisuals/Getty Images

Turn ordinary moments into curious conversations.

“This recipe is for four people, but we have 11 people coming to dinner. What should we do?”

In a recent interview, one participant described how much they learned from listening in on financial conversations, seeing how decisions got made about money, and watching how bills were handled. They were developing financial literacy and math skills.

As they noted, “By the time I got to high school, I had a very good basis on what I’m doing and how to do it and function as a person in society.”

Globally, individuals lack financial literacy, which can lead to negative outcomes in the future when it comes to topics such as retirement planning and debt.

Why is this important?

Research shows that talking with friends and family about STEM concepts supports how children see themselves as learners and their later success in STEM fields, even if they do not pursue a career in STEM.

My research also shows how family STEM participation gives children opportunities to explore STEM ideas in ways that go beyond what they typically experience in school.

In my view, these kinds of STEM experiences don’t compete with what children learn in school − they strengthen and support it.

For more such insights, log into www.international-maths-challenge.com.

*Credit for article given to Amber M. Simpson*


Mandelbrot’s fractals are not only gorgeous – they taught mathematicians how to model the real world

At the beginning of my third year at university studying mathematics, I spotted an announcement. A visiting professor from Canada would be giving a mini-course of ten lectures on a subject called complex dynamics.

It happened to be a difficult time for me. On paper, I was a very good student with an average of over 90%, but in reality I was feeling very uncertain. It was time for us to choose a branch of mathematics in which to specialise, but I hadn’t connected to any of the subjects so far; they all felt too technical and dry

So I decided to take a chance on the mini-course. As soon as it started, I was captured by the startling beauty of the patterns that emerged from the mathematics. These were a relatively recent discovery, we learned; nothing like them had existed before the 1980s.

They were thanks to the maverick French-American mathematician Benoit Mandelbrot, who came up with them in an attempt to visualise this field – with help from some powerful computers at the IBM TJ Watson Research Center in upstate New York.

A fractal – the term he derived from the Latin word fractus, meaning “broken” or “fragmented” – is a geometric shape that can be divided into smaller parts which are each a scaled copy of the whole. They are a visual representation of the fact that even a process with the simplest mathematical model can demonstrate complex and intricate behaviour at all scales.

Benoit Mandelbrot (1924-2010). Wikimedia, CC BY-SA

How the fractals are created

The system used by Mandelbrot was as follows: you choose a number (z), square it and then add another number (c). Then repeat over and over, keeping c the same while using the sum total from the previous calculation as z each time.

Starting, for example, with z=0 and c=1, the first calculation would be 0² + 1 = 1. By making z=1 for the next calculation, it’s 1² + 1 = 2, and so on.

To get a sense of what comes next, you can plot the value of c on a line and colour code it depending on how many iterations in the series it takes for the sum total to exceed 4 (the reason it’s 4 is because anything larger will quickly grow towards an infinitely large number in subsequent iterations). For example, you might use blue if the series never exceeds 4, red if it gets there after 1-5 iterations, black if it takes 6-9 iterations, and so on.

The Mandelbrot set is actually more complicated because you don’t plot c on a line but on a plane with x and y axes. This involves introducing several more mathematical concepts where c is a complex number and the y axis refers to imaginary values. If you want more on these, watch the video below. By plotting lots of different values of c on the plane, you derive the fractals.

This idea of visualisation from Mandelbrot, who would have turned 100 this month, led mathematicians to accept the role of pictures in experimental mathematics. It has also led to a huge amount of research. On five out of eight occasions since 1994, the Fields medal – among the highest accolades in mathematics – has been awarded for work related to his conjectures.

Mandelbrot in the real world

For centuries, mathematicians had to live with the uncomfortable thought that their existing tools – known as Euclidean geometry – were not really suitable for modelling and understanding the real world. They all produced smooth curves, but nature is not like that.

For example, one can sketch the shape of the British coastline with a few continuous strokes. But once you zoom in, you can see lots of small irregularities that were previously invisible. The same holds true for the beds of the rivers, mountains and the branches of trees, among many others.

When mathematicians tried to model the surface of anything, these small imperfections were always in the way. To make their work fit reality, they had to introduce additional elements which superimposed “noise” on top. But these were ugly and absurd, compensating for their inadequacies by creating an illusion.

Mandelbrot’s revolutionary philosophy, presented in his 1982 manifesto, The Fractal Geometry of Nature, argued that scientific methods could be adapted to study vast classes of irregular phenomena like these. He was the first to realise that, scattered around the research literature, often in obscure sources, were the germs of a coherent framework that would allow mathematical models to go beyond the comfort of Euclidean geometry, and tackle the irregularities without relying on a superimposed mechanism.

Tree branches are one of any number of natural phenomena that mathematicians struggled to model. Mariia Romanyk

This made his theory applicable to a wide range of improbably diverse fields. For example, it is used to model cloud formation in meteorology, and price fluctuations in the stock market. Other fields in which it has application include statistical physics, cosmology, geophysics, computer graphics and physiology.

Mandelbrot’s life story was just as jagged as his discovery. He was born to a Jewish-Lithuanian family in Warsaw in 1924. Sensing the approaching trouble, the family first moved to Paris in 1936, then to a small town in the south of France.

In 1945 he was admitted to the most prestigious university in France, the École Normale Supérieure in Paris, but stayed only for a day. He dropped out to move to the less prestigious École Polytechnique, which suited him better.

Following an MSc in aerodynamics at California Institute of Technology and a PhD in mathematics at the University of Paris, Mandelbrot spent most of his active scientific life in an IBM industrial laboratory. Only in 1987 was he appointed Abraham Robinson Adjunct Professor of Mathematical Sciences at Yale, where he stayed until his death in 2010.

It is no exaggeration to say that Mandelbrot is one of the greatest masterminds of our era. Thanks to his work, visual images of fractals have become symbolic for mathematical research as a whole. The community recognised his contribution by naming one of the most famous fractals the Mandelbrot set.

In the epilogue of a 1995 documentary about his discovery, The Colours of Infinity, we see Benoit addressing the camera:

I’ve spent most of my life unpacking the ideas that became fractal geometry. This has been exciting and enjoyable, most times. But it also has been lonely. For years few shared my views. Yet the ghost of the idea of fractals continued to beguile me, so I kept looking through the long, dry years.

So find the thing you love. It doesn’t so much matter what it is. Find the thing you love and throw yourself into it. I found a new geometry; you’ll find something else. Whatever you find will be yours.

For more such insights, log into www.international-maths-challenge.com.

*Credit for article given to Polina Vytnova*


A 41-million-digit prime number is the biggest ever found – but mathematicians’ search for perfection will continue

Imagine a number made up of a vast string of ones: 1111111…111. Specifically, 136,279,841 ones in a row. If we stacked up that many sheets of paper, the resulting tower would stretch into the stratosphere.

If we write this number in a computer in binary form (using only ones and zeroes), it would fill up only about 16 megabytes, no more than a short video clip. Converting to the more familiar way of writing numbers in decimal, this number – it starts out 8,816,943,275… and ends …076,706,219,486,871,551 – would have more than 41 million digits. It would fill 20,000 pages in a book.

Another way to write this number is 2136,279,841 – 1. There are a few special things about it.

First, it’s a prime number (meaning it is only divisible by itself and one). Second, it’s what is called a Mersenne prime (we’ll get to what that means). And third, it is to date the largest prime number ever discovered in a mathematical quest with a history going back more than 2,000 years.

The discovery

The discovery that this number (known as M136279841 for short) is a prime was made on October 12 by Luke Durant, a 36-year-old researcher from San Jose, California. Durant is one of thousands of people working as part of a long-running volunteer prime-hunting effort called the Great Internet Mersenne Prime Search, or GIMPS.

A prime number that is one less than some power of two (or what mathematicians write as 2 p – 1) is called a Mersenne prime, after the French monk Marin Mersenne, who investigated them more than 350 years ago. The first few Mersenne primes are 3, 7, 31 and 127.

The long hunt for Mersenne primes

Mersenne prime numbers have the form 2 p – 1. It would be impossible to visualise the actual numbers as the largest are millions of digits long, but we can plot the exponents – the number of times 2 is multiplied by itself.

Durant made his discovery through a combination of mathematical algorithms, practical engineering, and massive computational power. Where large primes have previously been found using traditional computer processors (CPUs), this discovery is the first to use a different kind of processor called a GPU.

GPUs were originally designed to speed up the rendering of graphics and video, and more recently have been repurposed to mine cryptocurrency and to power AI.

Durant, a former employee of leading GPU maker NVIDIA, used powerful GPUs in the cloud to create a kind of “cloud supercomputer” spanning 17 countries. The lucky GPU was an NVIDIA A100 processor located in Dublin, Ireland.

Primes and perfect numbers

Beyond the thrill of discovery, this advance continues a storyline that goes back millennia. One reason mathematicians are fascinated by Mersenne primes is that they are linked to so-called “perfect” numbers.

A number is perfect if, when you add together all the numbers that properly divide it, they add up to the number itself. For example, six is a perfect number because 6 = 2 × 3 = 1 + 2 + 3. Likewise, 28 = 4 × 7 = 1 + 2 + 4 + 7 + 14.

For every Mersenne prime, there is also an even perfect number. (In one of the oldest unfinished problems in mathematics, it is not known whether there are any odd perfect numbers.)

Perfect numbers have fascinated humans throughout history. For example, the early Hebrews as well as Saint Augustine considered six to be a truly perfect number, as God fashioned the Earth in precisely six days (resting on the seventh).

Practical primes

The study of prime numbers is not just a historical curiosity. Number theory is also essential to modern cryptography. For example, the security of many websites relies upon the inherent difficulty in finding the prime factors of large numbers.

The numbers used in so-called public-key cryptography (of the kind that secures most online activity, for example) are generally only a few hundred decimal digits, which is tiny compared with M136279841.

Nevertheless, the benefits of basic research in number theory – studying the distribution of prime numbers, developing algorithms for testing whether numbers are prime, and finding factors of composite numbers – often have downstream implications in helping to maintain privacy and security in our digital communication.

An endless search

Mersenne primes are rare indeed: the new record is more than 16 million digits larger than the previous one, and is only the 52nd ever discovered.

We know there are infinitely many prime numbers. This was proven by the Greek mathematician Euclid more than 2,000 years ago: if there were only a finite number of primes, we could multiply them all together and add one. The result would not be divisible by any of the primes we have already found, so there must always be at least one more out there.

But we don’t know whether there are infinitely many Mersenne primes – though it has been conjectured that there are. Unfortunately, they are too scarce for our techniques to detect.

For now, the new prime serves as a milestone in human curiosity and a reminder that even in an age dominated by technology, some of the deeper, tantalising secrets in the mathematical universe remain out of reach. The challenge remains, inviting mathematicians and enthusiasts alike to find the hidden patterns in the infinite tapestry of numbers.

And so the (mathematical) search for perfection will continue.

For more such insights, log into www.international-maths-challenge.com.

*Credit for article given to John Voight*


Three letters, one number, a knife and a stone bridge: how a graffitied equation changed mathematical history

On October 16 1843, the Irish mathematician William Rowan Hamilton had an epiphany during a walk alongside Dublin’s Royal Canal. He was so excited he took out his penknife and carved his discovery right then and there on Broome Bridge.

It is the most famous graffiti in mathematical history, but it looks rather unassuming:

i ² = j ² = k ² = ijk = –1

Yet Hamilton’s revelation changed the way mathematicians represent information. And this, in turn, made myriad technical applications simpler – from calculating forces when designing a bridge, an MRI machine or a wind turbine, to programming search engines and orienting a rover on Mars. So, what does this famous graffiti mean?

Rotating objects

The mathematical problem Hamilton was trying to solve was how to represent the relationship between different directions in three-dimensional space. Direction is important in describing forces and velocities, but Hamilton was also interested in 3D rotations.

Mathematicians already knew how to represent the position of an object with coordinates such as x, y and z, but figuring out what happened to these coordinates when you rotated the object required complicated spherical geometry. Hamilton wanted a simpler method.

He was inspired by a remarkable way of representing two-dimensional rotations. The trick was to use what are called “complex numbers”, which have a “real” part and an “imaginary” part. The imaginary part is a multiple of the number i, “the square root of minus one”, which is defined by the equation i ² = –1.

By the early 1800s several mathematicians, including Jean Argand and John Warren, had discovered that a complex number can be represented by a point on a plane. Warren had also shown it was mathematically quite simple to rotate a line through 90° in this new complex plane, like turning a clock hand back from 12.15pm to 12 noon. For this is what happens when you multiply a number by i.

When a complex number is represented as a point on a plane, multiplying the number by i amounts to rotating the corresponding line by 90° anticlockwise. The Conversation, CC BY

Hamilton was mightily impressed by this connection between complex numbers and geometry, and set about trying to do it in three dimensions. He imagined a 3D complex plane, with a second imaginary axis in the direction of a second imaginary number j, perpendicular to the other two axes.

It took him many arduous months to realise that if he wanted to extend the 2D rotational wizardry of multiplication by i he needed four-dimensional complex numbers, with a third imaginary number, k.

In this 4D mathematical space, the k-axis would be perpendicular to the other three. Not only would k be defined by k ² = –1, its definition also needed k = ij = –ji. (Combining these two equations for k gives ijk = –1.)

Putting all this together gives i ² = j ² = k ² = ijk = –1, the revelation that hit Hamilton like a bolt of lightning at Broome Bridge.

Quaternions and vectors

Hamilton called his 4D numbers “quaternions”, and he used them to calculate geometrical rotations in 3D space. This is the kind of rotation used today to move a robot, say, or orient a satellite.

But most of the practical magic comes into it when you consider just the imaginary part of a quaternion. For this is what Hamilton named a “vector”.

A vector encodes two kinds of information at once, most famously the magnitude and direction of a spatial quantity such as force, velocity or relative position. For instance, to represent an object’s position (x, y, z) relative to the “origin” (the zero point of the position axes), Hamilton visualised an arrow pointing from the origin to the object’s location. The arrow represents the “position vector” x i + y j + z k.

This vector’s “components” are the numbers x, y and z – the distance the arrow extends along each of the three axes. (Other vectors would have different components, depending on their magnitudes and units.)

A vector (r) is like an arrow from the point O to the point with coordinates (x, y, z). The Conversation, CC BY

Half a century later, the eccentric English telegrapher Oliver Heaviside helped inaugurate modern vector analysis by replacing Hamilton’s imaginary framework i, j, k with real unit vectors, i, j, k. But either way, the vector’s components stay the same – and therefore the arrow, and the basic rules for multiplying vectors, remain the same, too.

Hamilton defined two ways to multiply vectors together. One produces a number (this is today called the scalar or dot product), and the other produces a vector (known as the vector or cross product). These multiplications crop up today in a multitude of applications, such as the formula for the electromagnetic force that underpins all our electronic devices.

A single mathematical object

Unbeknown to Hamilton, the French mathematician Olinde Rodrigues had come up with a version of these products just three years earlier, in his own work on rotations. But to call Rodrigues’ multiplications the products of vectors is hindsight. It is Hamilton who linked the separate components into a single quantity, the vector.

Everyone else, from Isaac Newton to Rodrigues, had no concept of a single mathematical object unifying the components of a position or a force. (Actually, there was one person who had a similar idea: a self-taught German mathematician named Hermann Grassmann, who independently invented a less transparent vectorial system at the same time as Hamilton.

Hamilton also developed a compact notation to make his equations concise and elegant. He used a Greek letter to denote a quaternion or vector, but today, following Heaviside, it is common to use a boldface Latin letter.

This compact notation changed the way mathematicians represent physical quantities in 3D space.

Take, for example, one of Maxwell’s equations relating the electric and magnetic fields:

∇×E= –∂B/∂t

With just a handful of symbols (we won’t get into the physical meanings of ∂/∂t and ∇ ×), this shows how an electric field vector (E) spreads through space in response to changes in a magnetic field vector (B).

Without vector notation, this would be written as three separate equations (one for each component of B and E) – each one a tangle of coordinates, multiplications and subtractions.

The expanded form of the equation. As you can see, vector notation makes life much simpler. The Conversation, CC BY

The power of perseverance

I chose one of Maxwell’s equations as an example because the quirky Scot James Clerk Maxwell was the first major physicist to recognise the power of compact vector symbolism. Unfortunately, Hamilton didn’t live to see Maxwell’s endorsement. But he never gave up his belief in his new way of representing physical quantities.

Hamilton’s perseverance in the face of mainstream rejection really moved me, when I was researching my book on vectors. He hoped that one day – “never mind when” – he might be thanked for his discovery, but this was not vanity. It was excitement at the possible applications he envisaged.

A plaque on Dublin’s Broome Bridge commemorate’s Hamilton’s flash of insight. Cone83 / Wikimedia, CC BY-SA

He would be over the moon that vectors are so widely used today, and that they can represent digital as well as physical information. But he’d be especially pleased that in programming rotations, quaternions are still often the best choice – as NASA and computer graphics programmers know.

In recognition of Hamilton’s achievements, maths buffs retrace his famous walk every October 16 to celebrate Hamilton Day. But we all use the technological fruits of that unassuming graffiti every single day.

For more such insights, log into www.international-maths-challenge.com.

*Credit for article given to Robyn Arianrhod*


Want to solve a complex problem? Applied math can help

Applied mathematicians use math to model real-world situations. Ariel Skelley/DigitalVision via Getty Images

You can probably think of a time when you’ve used math to solve an everyday problem, such as calculating a tip at a restaurant or determining the square footage of a room. But what role does math play in solving complex problems such as curing a disease?

In my job as an applied mathematician, I use mathematical tools to study and solve complex problems in biology. I have worked on problems involving gene and neural networks such as interactions between cells and decision-making. To do this, I create descriptions of a real-world situation in mathematical language. The act of turning a situation into a mathematical representation is called modeling.

Translating real situations into mathematical terms

If you ever solved an arithmetic problem about the speed of trains or cost of groceries, that’s an example of mathematical modeling. But for more difficult questions, even just writing the real-world scenario as a math problem can be complicated. This process requires a lot of creativity and understanding of the problem at hand and is often the result of applied mathematicians working with scientists in other disciplines.

Applied mathematicians collaborate with scientists in other fields to answer a wide variety of questions. Hinterhaus Productions/DigitalVision via Getty Images

As an example, we could represent a game of Sudoku as a mathematical model. In Sudoku, the player fills empty boxes in a puzzle with numbers between 1 and 9 subject to some rules, such as no repeated numbers in any row or column.

The puzzle begins with some prefilled boxes, and the goal is to figure out which numbers go in the rest of the boxes.

Imagine that a variable, say x, represents the number that goes in one of those empty boxes. We can guarantee that x is between 1 and 9 by saying that x solves the equation (x-1)(x-2) … (x-9)=0. This equation is true only when one of the factors on the left side is zero. Each of the factors on the left side is zero only when x is a number between 1 and 9; for example, (x-1)=0 when x=1. This equation encodes a fact about our game of Sudoku, and we can encode the other features of the game similarly. The resulting model of Sudoku will be a set of equations with 81 variables, one for each box in the puzzle.

Another situation we might model is the concentration of a drug, say aspirin, in a person’s bloodstream. In this case, we would be interested in how the concentration changes as we ingest aspirin and the body metabolizes it. Just like with Sudoku, one can create a set of equations that describe how the concentration of aspirin evolves over time and how additional ingestion affects the dynamics of this medication. In contrast to Sudoku, however, the variables that represent concentrations are not static but rather change over time.

Sudoku is an example of a situation that can be modeled mathematically. Peter Dazeley/The Image Bank via Getty Images

But the act of modeling is not always so straightforward. How would we model diseases such as cancer? Is it enough to model the size and shape of a tumor, or do we need to model every single blood vessel inside the tumor? Every single cell? Every single chemical in each cell? There is much that is unknown about cancer, so how can we model such unknown features? Is it even possible?

Applied mathematicians have to find a balance between models that are realistic enough to be useful and simple enough to be implemented. Building these models may take several years, but in collaboration with experimental scientists, the act of trying to find a model often provides novel insight into the real-world problem.

Mathematical models help find real solutions

After writing a mathematical problem to represent a situation, the second step in the modeling process is to solve the problem.

For Sudoku, we need to solve a collection of equations with 81 variables. For the aspirin example, we need to solve an equation that describes the rate of change of concentrations. This is where all the math that has been and is still being invented comes into play. Areas of pure math such as algebra, analysis, combinatorics and many others can be used – in some cases combined – to solve the complex math problems arising from applications of math to the real world.

The third step of the modeling process consists of translating the mathematical solution into the solution to the applied problem. In the case of Sudoku, the solution to the equations tells us which number should go in each box to solve the puzzle. In the case of aspirin, the solution would be a set of curves that tell us the aspirin concentration in the digestive system and bloodstream. This is how applied mathematics works.

When creating a model isn’t enough

Or is it? While this three-step process is the ideal process of applied math, reality is more complicated. Once I reach the second step where I want the solution of the math problem, very often, if not most of the time, it turns out that no one knows how to solve the math problem in the model. In some cases, the math to study the problem doesn’t even exist.

For example, it is difficult to analyze models of cancer because the interactions between genes, proteins and chemicals are not as straightforward as the relationships between boxes in a game of Sudoku. The main difficulty is that these interactions are “nonlinear,” meaning that the effect of two inputs is not simply the sum of the individual effects. To address this, I have been working on novel ways to study nonlinear systems, such as Boolean network theory and polynomial algebra. With this and traditional approaches, my colleagues and I have studied questions in areas such as decision-making, gene networks, cellular differentiation and limb regeneration.

When approaching unsolved applied math problems, the distinction between applied and pure mathematics often vanishes. Areas that were considered at one time too abstract have been exactly what is needed for modern problems. This highlights the importance of math for all of us; current areas of pure mathematics can become the applied mathematics of tomorrow and be the tools needed for complex, real-world problems.

For more such insights, log into www.international-maths-challenge.com.

*Credit for article given to Alan Veliz-Cuba*


Mathematical modelling explores the statistical mysteries of successfully scheduling a meeting

Phase Transition. The probability for the poll to fail, 𝜋0, plotted as a function of p, the fraction of time slots that each respondent is available. Credit: The European Physical Journal B (2024). DOI: 10.1140/epjb/s10051-024-00742-z

In a world where organizing a simple meeting can feel like herding cats, new research from Case Western Reserve University reveals just how challenging finding a suitable meeting time becomes as the number of participants grows.

The study, published in the European Physical Journal B, dives into the mathematical complexities of this common task, offering new insights into why scheduling often feels so impossible.

“If you like to think the worst about people, then this study might be for you,” quipped researcher Harsh Mathur, professor of physics in the College of Arts and Sciences at CWRU. “But this is about more than Doodle polls. We started off by wanting to answer this question about polls, but it turns out there is more to the story.”

Researchers used mathematical modeling to calculate the likelihood of successfully scheduling a meeting based on several factors: the number of participants (m), the number of possible meeting times (τ) and the number of times each participant is unavailable (r).

What they found was that as the number of participants grows, the probability of scheduling a successful meeting decreases sharply.

Specifically, the probability drops significantly when more than five people are involved—especially if participant availability remains consistent.

“We wanted to know the odds,” Mathur said. “The science of probability actually started with people studying gambling, but it applies just as well to something like scheduling meetings. Our research shows that as the number of participants grows, the number of potential meeting times that need to be polled increases exponentially.

“The project had started half in jest but this exponential behaviour got our attention. It showed that scheduling meetings is a difficult problem, on par with some of the great problems in computer science.”

Interestingly, researchers found a parallel between scheduling difficulties and physical phenomena. They observed that as the probability of a participant rejecting a proposed meeting time increase, there’s a critical point where the likelihood of successfully scheduling the meeting drops sharply.

It’s a phenomenon similar to what is known as “phase transitions” in physics, Mathur said, such as ice melting into water.

“Understanding phase transitions mathematically is a triumph of physics,” he said. “It’s fascinating how something as mundane as scheduling can mirror the complexity of phase transitions.”

Mathur also noted the study’s broader implications, from casual scenarios like sharing appetizers at a restaurant to more complex settings like drafting climate policy reports, where agreement among many is needed.

“Consensus-building is hard,” Mathur said. “Like phase transitions, it’s complex. But that’s also where the beauty of mathematics lies—it gives us tools to understand and quantify these challenges.”

Mathur said the study contributes insights into the complexities of group coordination and decision-making, with potential applications across various fields.

For more such insights, log into our website https://international-maths-challenge.com

Credit of the article given to Case Western Reserve University


Mathematicians model a puzzling breakdown in cooperative behaviour

A model developed by evolutionary mathematicians in Canada and Europe shows that as cooperation becomes easier, it can unexpectedly break down. The researchers at the University of British Columbia and Hungarian Research Network used computational spatial models to arrange individuals from the two species on separate lattices facing one another. Credit: Christoph Hauert and György Szabó

Darwin was puzzled by cooperation in nature—it ran directly against natural selection and the notion of survival of the fittest. But over the past decades, evolutionary mathematicians have used game theory to better understand why mutual cooperation persists when evolution should favour self-serving cheaters.

At a basic level, cooperation flourishes when the costs to cooperation are low or the benefits large. When cooperation becomes too costly, it disappears—at least in the realm of pure mathematics. Symbiotic relationships between species—like those between pollinators and plants–are more complex but follow similar patterns.

But new modeling published today in PNAS Nexus adds a wrinkle to that theory, indicating that cooperative behaviour between species may break down in situations where, theoretically at least, it should flourish.

“As we began to improve the conditions for cooperation in our model, the frequency of mutually beneficial behaviour in both species increases, as expected,” says Dr. Christoph Hauert, a mathematician at the University of British Columbia who studies evolutionary dynamics.

“But as the frequency of cooperation in our simulation gets higher—closer to 50%—suddenly there’s a split. More cooperators pool in one species and fewer in the other—and this asymmetry continues to get stronger as the conditions for cooperation get more benign.”

While this “symmetry breaking of cooperation” between two populations has been modeled by mathematicians before, this is the first model that enables individuals in each group to interact and join forces in a more natural way.

Dr. Hauert and colleague Dr. György Szabó from the Hungarian Research Network used computational spatial models to arrange individuals from the two species on separate lattices facing one another. This enables cooperators to form clusters and reduce their exposure to (and exploitation by) cheaters by more frequently interacting with other cooperators.

“Because we chose symmetric interactions, the level of cooperation is the same in both populations,” says Dr. Hauert. “Clusters can still form and protect cooperators but now they need to be synchronized across lattices because that’s where the interactions occur.”

“The odd symmetry breaking in cooperation shows parallels to phase transitions in magnetic materials and highlights the success of approaches developed in statistical and solid state physics,” says Dr. Szabó.

“At the same time the model sheds light on spikes in dramatic changes in behaviour that can significantly affect the interactions in complex living systems.”

For more such insights, log into our website https://international-maths-challenge.com

Credit of the article given to University of British Columbia


Different mathematical solving methods can affect how information is memorized

When solving a mathematical problem, it is possible to appeal to the ordinal property of numbers, i.e. the fact

The way we memorize information—a mathematical problem statement, for example—reveals the way we process it. A team from the University of Geneva (UNIGE), in collaboration with CY Cergy Paris University (CYU) and Bourgogne University (uB), has shown how different solving methods can alter the way information is memorized and even create false memories.

By identifying learners’ unconscious deductions, this study opens up new perspectives for mathematics teaching. These results are published in the Journal of Experimental Psychology: Learning, Memory, and Cognition.

Remembering information goes through several stages: perception, encoding—the way it is processed to become an easily accessible memory trace—and retrieval (or reactivation). At each stage, errors can occur, sometimes leading to the formation of false memories.

Scientists from the UNIGE, CYU and Bourgogne University set out to determine whether solving arithmetic problems could generate such memories and whether they could be influenced by the nature of the problems.

Unconscious deductions create false memories

When solving a mathematical problem, it is possible to call upon either the ordinal property of numbers, i.e., the fact that they are ordered, or their cardinal property, i.e., the fact that they designate specific quantities. This can lead to different solving strategies and, when memorized, to different encoding.

In concrete terms, the representation of a problem involving the calculation of durations or differences in heights (ordinal problem) can sometimes allow unconscious deductions to be made, leading to a more direct solution. This is in contrast to the representation of a problem involving the calculation of weights or prices (cardinal problem), which can lead to additional steps in the reasoning, such as the intermediate calculation of subsets.

The scientists therefore hypothesized that, as a result of spontaneous deductions, participants would unconsciously modify their memories of ordinal problem statements, but not those of cardinal problems.

To test this, a total of 67 adults were asked to solve arithmetic problems of both types, and then to recall the wording in order to test their memories. The scientists found that in the majority of cases (83%), the statements were correctly recalled for cardinal problems.

In contrast, the results were different when the participants had to remember the wording of ordinal problems, such as: “Sophie’s journey takes 8 hours. Her journey takes place during the day. When she arrives, the clock reads 11. Fred leaves at the same time as Sophie. Fred’s journey is 2 hours shorter than Sophie’s. What time does the clock show when Fred arrives?”

In more than half the cases, information deduced by the participants when solving these problems was added unintentionally to the statement. In the case of the problem mentioned above, for example, they could be convinced—wrongly—that they had read: “Fred arrived 2 hours before Sophie” (an inference made because Fred and Sophie left at the same time, but Fred’s journey took 2 hours less, which is factually true but constitutes an alteration to what the statement indicated).

“We have shown that when solving specific problems, participants have the illusion of having read sentences that were never actually presented in the statements, but were linked to unconscious deductions made when reading the statements. They become confused in their minds with the sentences they actually read,” explains Hippolyte Gros, former post-doctoral fellow at UNIGE’s Faculty of Psychology and Educational Sciences, lecturer at CYU, and first author of the study.

Invoking memories to understand reasoning

In addition, the experiments showed that the participants with the false memories were only those who had discovered the shortest strategy, thus revealing their unconscious reasoning that had enabled them to find this resolution shortcut. On the other hand, the others, who had operated in more stages, were unable to “enrich” their memory because they had not carried out the corresponding reasoning.

“This work can have applications for learning mathematics. By asking students to recall statements, we can identify their mental representations and therefore the reasoning they used when solving the problem, based on the presence or absence of false memories in their restitution,” explains Emmanuel Sander, full professor at the UNIGE’s Faculty of Psychology and Educational Sciences, who directed this research.

It is difficult to access mental constructs directly. Doing so indirectly, by analysing memorization processes, could lead to a better understanding of the difficulties encountered by students in solving problems, and provide avenues for intervention in the classroom.

For more such insights, log into our website https://international-maths-challenge.com

Credit of the article to be given University of Geneva


Mathematicians debunk GPS assumptions to offer improvements

All ai lie on the same sheet of a cone with vertex x. The right-hand picture is not true to scale relative to the given numerical example. Credit: Advances in Applied Mathematics (2024). DOI: 10.1016/j.aam.2024.102741

The summer holidays are ending, which for many concludes with a long drive home and reliance on GPS devices to get safely home. But every now and then, GPS devices can suggest strange directions or get briefly confused about your location. But until now, no one knew for sure when the satellites were in a good enough position for the GPS system to give reliable direction.

TU/e’s Mireille Boutin and her co-worker Gregor Kemper at the Technical University of Munich have turned to mathematics to help determine when your GPS system has enough information to determine your location accurately. The research is published in the journal Advances in Applied Mathematics.

“In 200 meters, turn right.” This is a typical instruction that many have heard from their global positioning system (GPS).

Without a doubt, advancements in GPS technologies and mobile navigation apps have helped GPS play a major role in modern car journeys.

But, strictly adhering to instructions from GPS devices can lead to undesirable situations. Less serious might be turning left instead of right, while more serious could be driving your car into a harbor—just as two tourists did in Hawaii in 2023. The latter incident is very much an exception to the rule, and one might wonder: “How often does this happen and why?”

GPS and your visibility

“The core of the GPS system was developed in the mid-1960s. At the time, the theory behind it did not provide any guarantee that the location given would be correct,” says Boutin, professor at the Department of Mathematics and Computer Science.

It won’t come as a surprise then to learn that calculating an object’s position on Earth relies on some nifty mathematics. And they haven’t changed much since the early days. These are at the core of the GPS system we all use. And it deserved an update.

So, along with her colleague Gregor Kemper at the Technical University of Munich, Boutin turned to mathematics to expand on the theory behind the GPS system, and their finding has recently been published in the journal Advances in Applied Mathematics.

How does GPS work?

Before revealing Boutin and Kemper’s big finding, just how does GPS work?

Global positioning is all about determining the position of a device on Earth using signals sent by satellites. A signal sent by a satellite carries two key pieces of information—the position of the satellite in space and the time at which the position was sent by the satellite. By the way, the time is recorded by a very precise clock on board the satellite, which is usually an atomic clock.

Thanks to the atomic clock, satellites send very accurate times, but the big issue lies with the accuracy of the clock in the user’s device—whether it’s a GPS navigation device, a smartphone, or a running watch.

“In effect, GPS combines precise and imprecise information to figure out where a device is located,” says Boutin. “GPS might be widely used, but we could not find any theoretical basis to guarantee that the position obtained from the satellite signals is unique and accurate.”

Google says ‘four’

If you do a quick Google search for the minimum number of satellites needed for navigation with GPS, multiple sources report that you need at least four satellites.

But the question is not just how many satellites you can see, but also what arrangements can they form? For some arrangements, determining the user position is impossible. But what arrangements exactly? That’s what the researchers wanted to find out.

“We found conjectures in scientific papers that seem to be widely accepted, but we could not find any rigorous argument to support them anywhere. Therefore, we thought that, as mathematicians, we might be able to fill that knowledge gap,” Boutin says.

To solve the problem, Boutin and Kemper simplified the GPS problem to what works best in practice: equations that are linear in terms of the unknown variables.

“A set of linear equations is the simplest form of equations we could hope for. To be honest, we were surprised that this simple set of linear equations for the GPS problem wasn’t already known,” Boutin adds.

The problem of uniqueness

With their linear equations ready, Boutin and Kemper then looked closely at the solutions to the equations, paying special attention as to whether the equations gave a unique solution.

“A unique solution implies that the only solution to the equations is the actual position of the user,” notes Boutin.

If there is more than one solution to the equations, then only one is correct—that is, the true user position—but the GPS system would not know which one to pick and might return the wrong one.

The researchers found that nonunique solutions can emerge when the satellites lie in a special structure known as a “hyperboloid of revolution of two sheets.”

“It doesn’t matter how many satellites send a signal—if they all lie on one of these hyperboloids then it’s possible that the equations can have two solutions, so the one chosen by the GPS could be wrong,” says Boutin.

But what about the claim that you need at least four satellites to determine your position? “Having four satellites can work, but the solution is not always unique,” points out Boutin.

Why mathematics matters

For Boutin, this work demonstrates the power and application of mathematics.

“I personally love the fact that mathematics is a very powerful tool with lots of practical applications,” says Boutin. “I think people who are not mathematicians may not see the connections so easily, and so it is always nice to find clear and compelling examples of everyday problems where mathematics can make a difference.”

Central to Boutin and Kemper’s research is the field of algebraic geometry in which abstract algebraic methods are used to solve geometrical, real-world problems.

“Algebraic geometry is an area of mathematics that is considered very abstract. I find it nice to be reminded that any piece of mathematics, however abstract it might be, may turn out to have practical applications at some point,” says Boutin.

For more such insights, log into our website https://international-maths-challenge.com

Credit of the article to be given Eindhoven University of Technology