Crowds Beat Computers in Answer to Wikipedia-Sized Maths Problem

A maths problem previously tackled with the help of a computer, which produced a proof the size of Wikipedia, has now been cut down to size by a human. Although it is unlikely to have practical applications, the result highlights the differences between two modern approaches to mathematics: crowdsourcing and computers.

Terence Tao of the University of California, Los Angeles, has published a proof of the Erdős discrepancy problem, a puzzle about the properties of an infinite, random sequence of +1s and -1s. In the 1930s, Hungarian mathematician Paul Erdős wondered whether such a sequence would always contain patterns and structure within the randomness.

One way to measure this is by calculating a value known as the discrepancy. This involves adding up all the +1s and -1s within every possible sub-sequence. You might think the pluses and minuses would cancel out to make zero, but Erdős said that as your sub-sequences got longer, this sum would have to go up, revealing an unavoidable structure. In fact, he said the discrepancy would be infinite, meaning you would have to add forever, so mathematicians started by looking at smaller cases in the hopes of finding clues to attack the problem in a different way.

Last year, Alexei Lisitsa and Boris Konev of the University of Liverpool, UK used a computer to prove that the discrepancy will always be larger than two. The resulting proof was a 13 gigabyte file – around the size of the entire text of Wikipedia – that no human could ever hope to check.

Helping hands

Tao has used more traditional mathematics to prove that Erdős was right, and the discrepancy is infinite no matter the sequence you choose. He did it by combining recent results in number theory with some earlier, crowdsourced work.

In 2010, a group of mathematicians, including Tao, decided to work on the problem as the fifth Polymath project, an initiative that allows professionals and amateurs alike to contribute ideas through SaiBlogs and wikis as part of mathematical super-brain. They made some progress, but ultimately had to give up.

“We had figured out an interesting reduction of the Erdős discrepancy problem to a seemingly simpler problem involving a special type of sequence called a completely multiplicative function,” says Tao.

Then, in January this year, a new development in the study of these functions made Tao look again at the Erdős discrepancy problem, after a commenter on his SaiBlog pointed out a possible link to the Polymath project and another problem called the Elliot conjecture.

Not just conjecture

“At first I thought the similarity was only superficial, but after thinking about it more carefully, and revisiting some of the previous partial results from Polymath5, I realised there was a link: if one could prove the Elliott conjecture completely, then one could also resolve the Erdős discrepancy problem,” says Tao.

“I have always felt that that project, despite not solving the problem, was a distinct success,” writes University of Cambridge mathematician Tim Gowers, who started the Polymath project and hopes that others will be encouraged to participate in future. “We now know that Polymath5 has accelerated the solution of a famous open problem.”

Lisitsa praises Tao for doing what his algorithm couldn’t. “It is a typical example of high-class human mathematics,” he says. But mathematicians are increasingly turning to machines for help, a trend that seems likely to continue. “Computers are not needed for this problem to be solved, but I believe they may be useful in other problems,” Lisitsa says.

For more such insights, log into www.international-maths-challenge.com.

*Credit for article given to Jacob Aron*


Real Talk: Math is Hard, Not Impossible

Felker prefaces the quote by saying,

Giving up on math means you don’t believe that careful study can change the way you think.

He further notes that writing, like math, “is also not something that anyone is ‘good’ at without a lot of practice, but it would be completely unacceptable to think that your composition skills could not improve.”

Friends, this is so true! Being ‘good’ at math boils down to hard work and perseverance, not whether or not you have the ‘math gene.’ “But,” you might protest, “I’m so much slower than my classmates are!” or “My educational background isn’t as solid as other students’!” or “I got a late start in mathematics!”* That’s okay! A strong work ethic and a love and enthusiasm for learning math can shore up all deficiencies you might think you have. Now don’t get me wrong. I’m not claiming it’ll be a walk in the park. To be honest, some days it feels like a walk through an unfamiliar alley at nighttime during a thunderstorm with no umbrella. But, you see, that’s okay too. It may take some time and the road may be occasionally bumpy, but it can be done!

This brings me to another point that Felker makes: If you enjoy math but find it to be a struggle, do not be discouraged! The field of math is HUGE and its subfields come in many different flavors. So for instance, if you want to be a math major but find your calculus classes to be a challenge, do not give up! This is not an indication that you’ll do poorly in more advanced math courses. In fact, upper level math classes have a completely (I repeat, completely!) different flavor than calculus. Likewise, in graduate school you may struggle with one course, say algebraic topology, but find another, such as logic, to be a breeze. Case in point: I loathed real analysis as an undergraduate** and always thought it was pretty masochistic. But real analysis in graduate school was nothing like undergraduate real analysis (which was more like advanced calculus), and now – dare I say it? – I sort of enjoy the subject. (Gasp!)

All this to say that although Felker’s article is aimed at folks who may be afraid to take college-level math, I think it applies to math majors and graduate students too. I highly recommend you read it if you ever need a good ‘pick-me-up.’ And on those days when you feel like the math struggle is harder than usual, just remember:

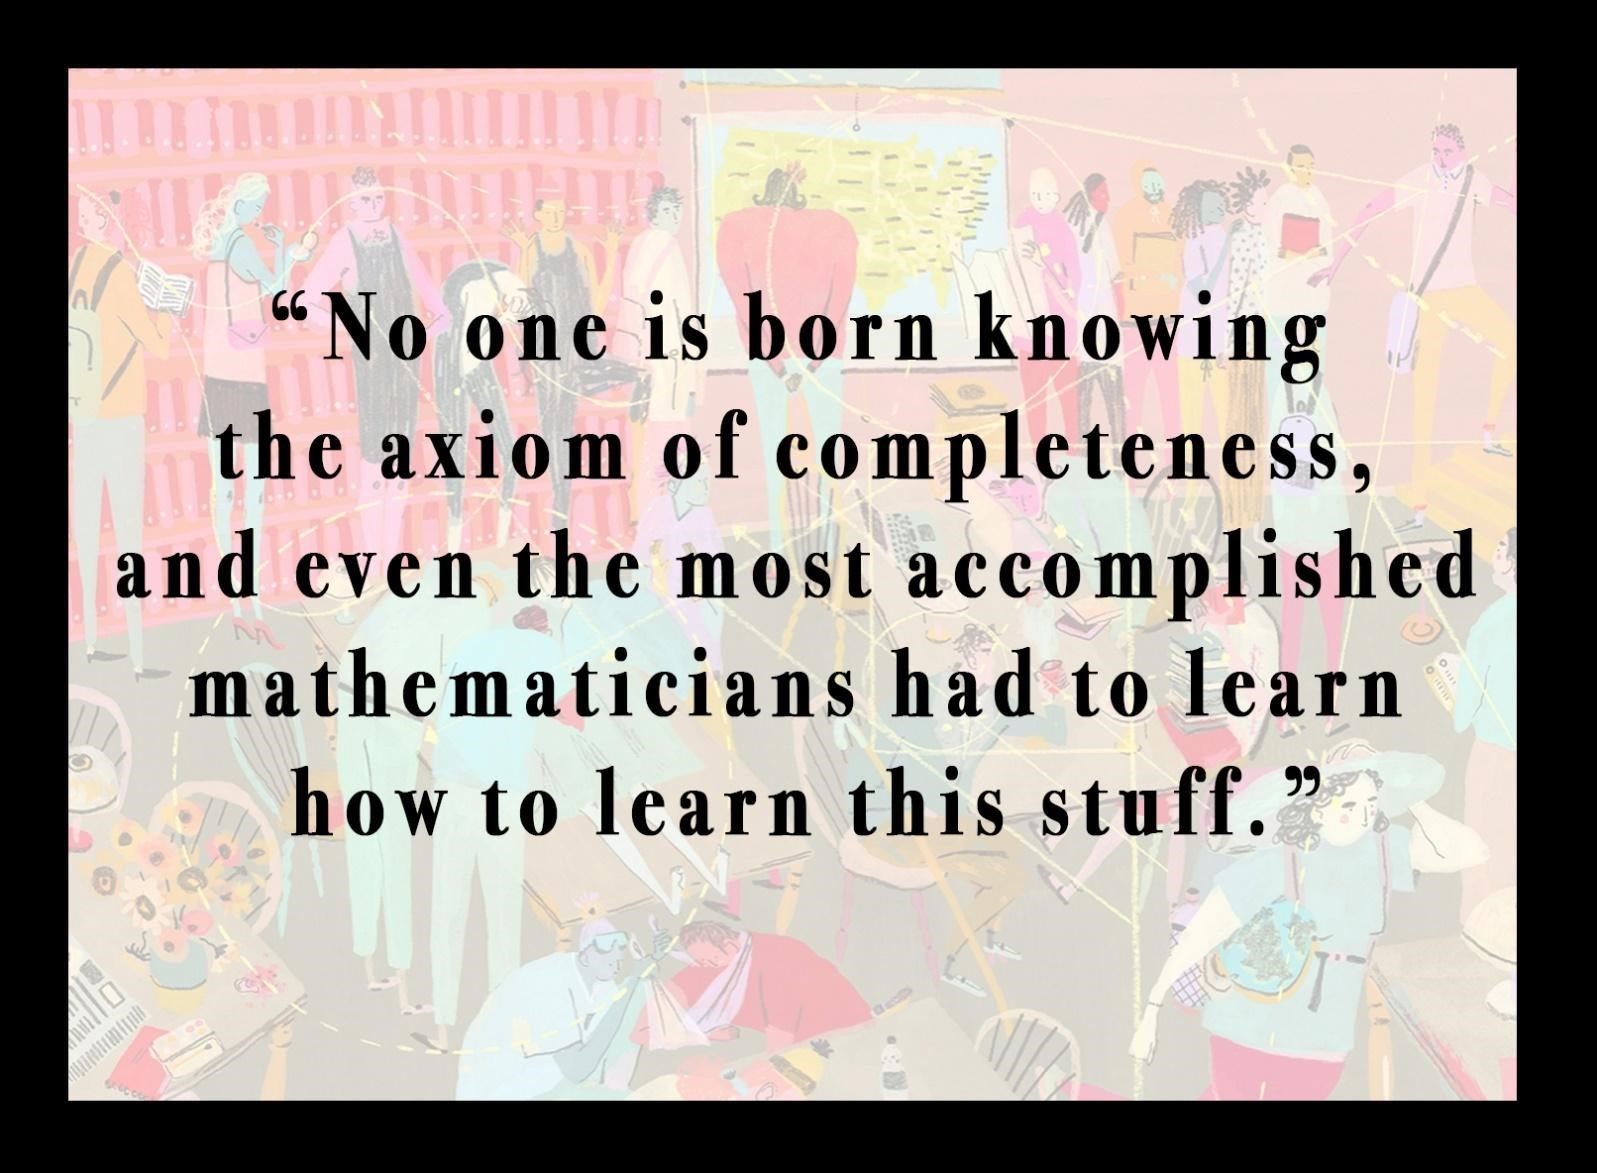
Even the most accomplished mathematicians had to learn HOW to learn this stuff!

For more such insights, log into www.international-maths-challenge.com.

*Credit for article given to Tai-Danae Bradley*


The Integral Domain Hierarchy, Part 1

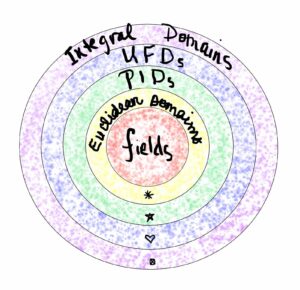
Here is a list of some of the subsets of integral domains, along with the reasoning (a.k.a proofs) of why the bullseye below looks the way it does. Part 2 of this post will include back-pocket examples/non-examples of each.

Integral Domain: a commutative ring with 1 where the product of any two nonzero elements is always nonzero

Unique Factorization Domain (UFD): an integral domain where every nonzero element (which is not a unit) has a unique factorization into irreducibles

Principal Ideal Domain (PID): an integral domain where every ideal is generated by exactly one element

Euclidean Domain: an integral domain RR with a norm NN and a division algorithm (i.e. there is a norm NN so that for every a,b∈Ra,b∈R with b≠0b≠0, there are q,r∈Rq,r∈R so that a=bq+ra=bq+r with r=0r=0 or N(r)<N(b)N(r)<N(b))

Field: a commutative ring where every nonzero element has an inverse

Because… We can just choose the zero norm: N(r)=0N(r)=0 for all r∈Fr∈F.

Proof: Let FF be a field and define a norm NN so that N(r)=0N(r)=0 for all r∈Fr∈F. Then for any a,b∈Fa,b∈F with b≠0b≠0, we can writea=b(b−1a)+0.a=b(b−1a)+0.

Because… If I◃RI◃R is an arbitrary nonzero ideal in the Euclidean domain RR, then I=(d)I=(d), where d∈Id∈I such that dd has the smallest norm among all elements in II. Prove this using the division algorithm on dd and some a∈Ia∈I.

Proof: Let RR be a Euclidean domain with respect to the norm NN and let I◃RI◃R be an ideal. If I=(0)I=(0), then II is principle. Otherwise let d∈Id∈I be a nonzero element such that dd has the smallest norm among all elements in II. We claim I=(d)I=(d). That (d)⊂I(d)⊂I is clear so let a∈Ia∈I. Then by the division algorithm, there exist q,r∈Rq,r∈R so that a=dq+ra=dq+r with r=0r=0 or N(r)<N(d)N(r)<N(d). Then r=a−dq∈Ir=a−dq∈I since a,d∈Ia,d∈I. But my minimality of dd, this implies r=0r=0. Hence a=dq∈(d)a=dq∈(d) and so I⊂(d)I⊂(d).

Because…Every PID has the ascending chain condition (acc) on its ideals!* So to prove PID ⇒⇒ UFD, just recall that an integral domain RR is a UFD if and only if 1) it has the acc on principal ideals** and 2) every irreducible element is also prime.

Proof: Let RR be a PID. Then 1) RR has the ascending chain condition on principal ideals and 2) every irreducible element is also a prime element. Hence RR is a UFD.

Because… By definition.

Proof: By definition.

‍*Def: In general, an integral domain RR has the acc on its principal ideals if these two equivalent conditions are satisfied:

  1. Every sequence I1⊂I2⊂⋯⊂⋯I1⊂I2⊂⋯⊂⋯ of principal ideals is stationary (i.e. there is an integer n0≥1n0≥1 such that In=In0In=In0 for all n≥n0n≥n0).
  2. For every nonempty subset X⊂RX⊂R, there is an element m∈Xm∈X such that whenever a∈Xa∈X and (m)⊂(a)(m)⊂(a), then (m)=(a)(m)=(a).

**To see this, use part 1 of the definition above. If I1⊂I2⊂⋯I1⊂I2⊂⋯ is an acsending chain, consider their union I=⋃∞n=1InI=⋃n=1∞In. That guy must be a principal ideal (check!), say I=(m)I=(m). This implies that mm must live in some In0In0  for some n0≥1n0≥1 and so I=(m)⊂In0I=(m)⊂In0. But since II is the union, we have for all n≥n0n≥n0(m)=I⊃In⊃In0=(m).(m)=I⊃In⊃In0=(m).Voila!

Every field FF is a PID

because the only ideals in a field are (0)(0) and F=(1)F=(1)! And every field is vacuously a UFD since all elements are units. (Recall, RR is a UFD if every non-zero, non-invertible element (an element which is not a unit) has a unique factorzation into irreducibles).

In an integral domain, every maximal ideal is also a prime ideal. 

(Proof: Let RR be an integral domain and M◃RM◃R a maximal ideal. Then R/MR/M is a field and hence an integral domain, which implies M◃RM◃R is a prime ideal.)

Butut the converse is not true (see counterexample below). However, the converse is true in a PID because of the added structure!

(Proof: Let RR be a PID and (p)◃R(p)◃R a prime ideal for some p∈Rp∈R. Then pp is a prime – and hence an irreducible – element (prime ⇔⇔ irreducible in PIDs). Since in an integral domain a principal ideal is maximal whenever it is generated by an irreducible element, we conclude (p)(p) is maximal.)

This suggests that if you want to find a counterexample – an integral domain with a prime ideal which is not maximal – try to think of a ring which is not a PID:   In Z[x]Z[x], consider the ideal (p)(p) for a prime integer pp. Then (p)(p) is a prime ideal, yet it is not maximal since(p)⊂(p,x)⊂Z[x].(p)⊂(p,x)⊂Z[x].

If FF is a field, then F[x]F[x] – the ring of polynomials in xx with coefficients in FF – is a Euclidean domain with the norm N(p(x))=degp(x)N(p(x))=deg⁡p(x) where p(x)∈F[x]p(x)∈F[x].

By the integral domain hierarchy above, this implies every ideal in F[x]F[x] is of the form (p(x))(p(x)) (i.e. F[x]F[x] is a PID) and every polynomial can be factored uniquely into a product of prime polynomials (just like the integers)! The next bullet gives an “almost converse” statement.

If R[x]R[x] is a PID, the RR must be a field.

To see this, simply observe that R⊂R[x]R⊂R[x] and so RR must be an integral domain (since a subset of a integral domain inherets commutativity and the “no zero divisors” property). Since R[x]/(x)≅RR[x]/(x)≅R, it follows that R[x]/(x)R[x]/(x) is also an integral domain. This proves that (x)(x) is a prime ideal. But prime implies maximal in a PID! So R[x]/(x)R[x]/(x) – and therefore RR – is actually a field.

  • This is how we know, for example, that Z[x]Z[x] is not a PID (in the counterexample a few bullets up) – ZZ is not a field!

‍For more such insights, log into www.international-maths-challenge.com.

*Credit for article given to Tai-Danae Bradley*


Everything You Need To Know About Statistics (But Were Afraid To Ask)

Does the thought of p-values and regressions make you break out in a cold sweat? Never fear – read on for answers to some of those burning statistical questions that keep you up 87.9% of the night.

  • What are my hypotheses?

There are two types of hypothesis you need to get your head around: null and alternative. The null hypothesis always states the status quo: there is no difference between two populations, there is no effect of adding fertiliser, there is no relationship between weather and growth rates.

Basically, nothing interesting is happening. Generally, scientists conduct an experiment seeking to disprove the null hypothesis. We build up evidence, through data collection, against the null, and if the evidence is sufficient we can say with a degree of probability that the null hypothesis is not true.

We then accept the alternative hypothesis. This hypothesis states the opposite of the null: there is a difference, there is an effect, there is a relationship.

  • What’s so special about 5%?

One of the most common numbers you stumble across in statistics is alpha = 0.05 (or in some fields 0.01 or 0.10). Alpha denotes the fixed significance level for a given hypothesis test. Before starting any statistical analyses, along with stating hypotheses, you choose a significance level you’re testing at.

This states the threshold at which you are prepared to accept the possibility of a Type I Error – otherwise known as a false positive – rejecting a null hypothesis that is actually true.

  • Type what error?

Most often we are concerned primarily with reducing the chance of a Type I Error over its counterpart (Type II Error – accepting a false null hypothesis). It all depends on what the impact of either error will be.

Take a pharmaceutical company testing a new drug; if the drug actually doesn’t work (a true null hypothesis) then rejecting this null and asserting that the drug does work could have huge repercussions – particularly if patients are given this drug over one that actually does work. The pharmaceutical company would be concerned primarily with reducing the likelihood of a Type I Error.

Sometimes, a Type II Error could be more important. Environmental testing is one such example; if the effect of toxins on water quality is examined, and in truth the null hypothesis is false (that is, the presence of toxins does affect water quality) a Type II Error would mean accepting a false null hypothesis, and concluding there is no effect of toxins.

The down-stream issues could be dire, if toxin levels are allowed to remain high and there is some health effect on people using that water.

Do you know the difference between continuous and categorical variables?

  • What is a p-value, really?

Because p-values are thrown about in science like confetti, it’s important to understand what they do and don’t mean. A p-value expresses the probability of getting a given result from a hypothesis test, or a more extreme result, if the null hypothesis were true.

Given we are trying to reject the null hypothesis, what this tells us is the odds of getting our experimental data if the null hypothesis is correct. If the odds are sufficiently low we feel confident in rejecting the null and accepting the alternative hypothesis.

What is sufficiently low? As mentioned above, the typical fixed significance level is 0.05. So if the probability portrayed by the p-value is less than 5% you reject the null hypothesis. But a fixed significance level can be deceiving: if 5% is significant, why is 6% not?

It pays to remember that such probabilities are continuous, and any given significance level is arbitrary. In other words, don’t throw your data away simply because you get a p-value of 6-10%.

  • How much replication do I have?

This is probably the biggest issue when it comes to experimental design, in which the focus is on ensuring the right type of data, in large enough quantities, is available to answer given questions as clearly and efficiently as possible.

Pseudoreplication refers to the over-inflation of degrees of freedom (a mathematical restriction put in place when we calculate a parameter – e.g. a mean – from a sample). How would this work in practice?

Say you’re researching cholesterol levels by taking blood from 20 male participants.

Each male is tested twice, giving 40 test results. But the level of replication is not 40, it’s actually only 20 – a requisite for replication is that each replicate is independent of all others. In this case, two blood tests from the same person are intricately linked.

If you were to analyse the data with a sample size of 40, you would be committing the sin of pseudoreplication: inflating your degrees of freedom (which incidentally helps to create a significant test result). Thus, if you start an experiment understanding the concept of independent replication, you can avoid this pitfall.

  • How do I know what analysis to do?

There is a key piece of prior knowledge that will help you determine how to analyse your data. What kind of variable are you dealing with? There are two most common types of variable:

1) Continuous variables. These can take any value. Were you to you measure the time until a reaction was complete, the results might be 30 seconds, two minutes and 13 seconds, or three minutes and 50 seconds.

2) Categorical variables. These fit into – you guessed it – categories. For instance, you might have three different field sites, or four brands of fertiliser. All continuous variables can be converted into categorical variables.

With the above example we could categorise the results into less than one minute, one to three minutes, and greater than three minutes. Categorical variables cannot be converted back to continuous variables, so it’s generally best to record data as “continuous” where possible to give yourself more options for analysis.

Deciding which to use between the two main types of analysis is easy once you know what variables you have:

ANOVA (Analysis of Variance) is used to compare a categorical variable with a continuous variable – for instance, fertiliser treatment versus plant growth in centimetres.

Linear Regression is used when comparing two continuous variables – for instance, time versus growth in centimetres.

Though there are many analysis tools available, ANOVA and linear regression will get you a long way in looking at your data. So if you can start by working out what variables you have, it’s an easy second step to choose the relevant analysis.

Ok, so perhaps that’s not everything you need to know about statistics, but it’s a start. Go forth and analyse!

For more such insights, log into www.international-maths-challenge.com.

*Credit for article given to Sarah-Jane O’Connor*


Magic Numbers: The Beauty Of Decimal Notation

While adding up your grocery bill in the supermarket, you’re probably not thinking how important or sophisticated our number system is.

But the discovery of the present system, by unknown mathematicians in India roughly 2,000 years ago – and shared with Europe from the 13th century onwards – was pivotal to the development of our modern world.

Now, what if our “decimal” arithmetic, often called the Indo-Arabic system, had been discovered earlier? Or what if it had been shared with the Western world earlier than the 13th century?

First, let’s define “decimal” arithmetic: we’re talking about the combination of zero, the digits one through nine, positional notation, and efficient rules for arithmetic.

“Positional notation” means that the value represented by a digit depends both on its value and position in a string of digits.

Thus 7,654 means:

(7 × 1000) + (6 × 100) + (5 × 10) + 4 = 7,654

The benefit of this positional notation system is that we need no new symbols or calculation schemes for tens, hundreds or thousands, as was needed when manipulating Roman numerals.

While numerals for the counting numbers one, two and three were seen in all ancient civilisations – and some form of zero appeared in two or three of those civilisations (including India) – the crucial combination of zero and positional notation arose only in India and Central America.

Importantly, only the Indian system was suitable for efficient calculation.

Positional arithmetic can be in base-ten (or decimal) for humans, or in base-two (binary) for computers.

In binary, 10101 means:

(1 × 16) + (0 × 8) + (1 × 4) + (0 × 2) + 1

Which, in the more-familiar decimal notation, is 21.

The rules we learned in primary school for addition, subtraction, multiplication and division can be easily extended to binary.

The binary system has been implemented in electronic circuits on computers, mostly because the multiplication table for binary arithmetic is much simpler than the decimal system.

Of course, computers can readily convert binary results to decimal notation for us humans.

As easy as counting from one to ten

Perhaps because we learn decimal arithmetic so early, we consider it “trivial”.

Indeed the discovery of decimal arithmetic is given disappointingly brief mention in most western histories of mathematics.

In reality, decimal arithmetic is anything but “trivial” since it eluded the best minds of the ancient world including Greek mathematical super-genius Archimedes of Syracuse.

Archimedes – who lived in the 3rd century BCE – saw far beyond the mathematics of his time, even anticipating numerous key ideas of modern calculus. He also used mathematics in engineering applications.

Nonetheless, he used a cumbersome Greek numeral system that hobbled his calculations.

Imagine trying to multiply the Roman numerals XXXI (31) and XIV (14).

First, one must rewrite the second argument as XIIII, then multiply the second by each letter of the first to obtain CXXXX CXXXX CXXXX XIIII.

These numerals can then be sorted by magnitude to arrive at CCCXXXXXXXXXXXXXIIII.

This can then be rewritten to yield CDXXXIV (434).

(For a bit of fun, try adding MCMLXXXIV and MMXI. First person to comment with the correct answer and their method gets a jelly bean.)

Thus, while possible, calculation with Roman numerals is significantly more time-consuming and error prone than our decimal system (although it is harder to alter the amount payable on a Roman cheque).

History lesson

Although decimal arithmetic was known in the Arab world by the 9th century, it took many centuries to make its way to Europe.

Italian mathematician Leonardo Fibonacci travelled the Mediterranean world in the 13th century, learning from the best Arab mathematicians of the time. Even then, it was several more centuries until decimal arithmetic was fully established in Europe.

Johannes Kepler and Isaac Newton – both giants in the world of physics – relied heavily on extensive decimal calculations (by hand) to devise their theories of planetary motion.

In a similar way, present-day scientists rely on massive computer calculations to test hypotheses and design products. Even our mobile phones do surprisingly sophisticated calculations to process voice and video.

But let us indulge in some alternate history of mathematics. What if decimal arithmetic had been discovered in India even earlier, say 300 BCE? (There are indications it was known by this date, just not well documented.)

And what if a cultural connection along the silk-road had been made between Indian mathematicians and Greek mathematicians at the time?

Such an exchange would have greatly enhanced both worlds, resulting in advances beyond the reach of each system on its own.

For example, a fusion of Indian arithmetic and Greek geometry might well have led to full-fledged trigonometry and calculus, thus enabling ancient astronomers to deduce the laws of motion and gravitation nearly two millennia before Newton.

In fact, the combination of mathematics, efficient arithmetic and physics might have accelerated the development of modern technology by more than two millennia.

It is clear from history that without mathematics, real progress in science and technology is not possible (try building a mobile phone without mathematics). But it’s also clear that mathematics alone is not sufficient.

The prodigious computational skills of ancient Indian mathematicians never flowered into advanced technology, nor did the great mathematical achievements of the Greeks, or many developments in China.

On the other hand, the Romans, who were not known for their mathematics, still managed to develop some impressive technology.

But a combination of advanced mathematics, computation, and technology makes a huge difference.

Our bodies and our brains today are virtually indistinguishable from those of ancient times.

With the earlier adoption of Indo-Arabic decimal arithmetic, the modern technological world of today might – for better or worse – have been achieved centuries ago.

And that’s something worth thinking about next time you’re out grocery shopping.

For more such insights, log into www.international-maths-challenge.com.

*Credit for article given to Jonathan Borwein (Jon)*


Quadratic Number Spirals and Polygonal Numbers

Take the positive Integer number-line, place it in the xy plane (with zero at the origin), and wrap it counterclockwise around the origin so that the formerly straight number-line forms a spiral. Do this so that the square numbers (1, 4, 9, …) all line up along the positive x axis one unit apart.

Equipped with this number spiral, you can now plot sequences of positive integers on it and, in some cases, interesting curves will emerge.

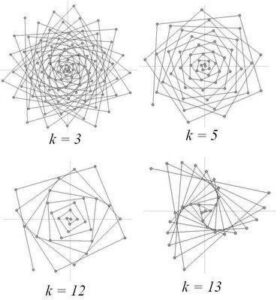
Because of how we have wound our  number spiral, quadratic sequences are particularly nice to plot. So how can we possibly resist spiral-plotting the 2-dimensional polygonal numbers? The plots below are of the 2-dimensional k-polygonal numbers for = 3, 5, 12, and 13, that fall between 1 and 5000.

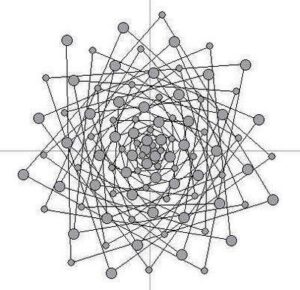
Plotting two polygonal number sequences on the same spiral gives us a way to see some of the numbers for which the sequences overlap (they do this at what are called highly polygonal numbers). For example, it turns out that every hexagonal number is also a triangular number. The image below shows an overlay of both the k = 6 and k = 3 sequences – numbers that are both hexagonal and triangular are shown as large dots, while the non-hexagonal triangular numbers are smaller.

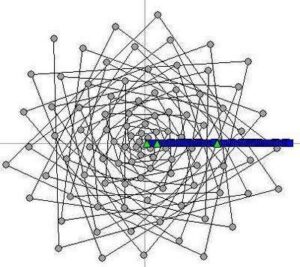
The square and triangular number sequences line up less exactly than the hexagonal and triangular example above, but their overlap represents a well-known sequence in its own right (Sloane A001110 – see also wikipedia). The square-triangular sequence comes up surprisingly often in recreational mathematics, including a recently in an article about inquisitive computing by Brain Hayes. In the image below, the square numbers are squares, the triangular numbers are dots, and those that are both show up as triangles (1, 36, and  1225 are shown).

For more such insights, log into www.international-maths-challenge.com.

*Credit for article given to dan.mackinnon*


Star Polygons

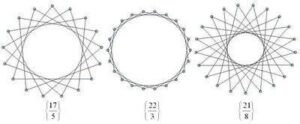
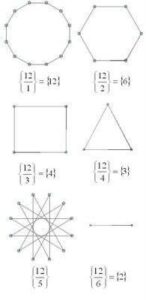
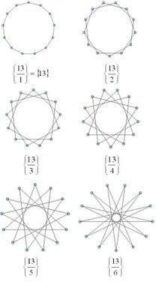
Starting with p (p a positive integer) equally distributed dots (vertices) around a circle. Connecting each dot to the next as you move around the circle will give you a regular p-gon – a p-sided polygon with p vertices. If, however, instead of connecting each dot to the one next to it you skip over a fixed number of dots, then you might end up with a star-like pattern, like the ones shown above. In this process, imagine that you start with a particular vertex and move in a counter-clockwise direction. If there are any dots left-over when you get back to the dot you started from, just throw away the unconnected dots.

The Schläfli notation for polygons is very useful for describing regular connected star polygons, and provides an example of how sometimes calculations with notation match exactly with calculations done with diagrams. In this notation, regular polygons like triangle, square, pentagon, etc. are written as {3}, {4}, and {5} respectively. A regular p-gon is written as {p}. If when drawing your p-gon you connect to the second next vertex instead of the first, then you would write this as {p/2}. If you connect to the q’th next vertex, then you would write this polygon as {p/q}. Note that if you are just connecting to the next vertex to make a regular p-gon, this notation gives you {p/1} = {p}, as you would expect.

If you start playing with this process you will notice that {p/q} gives you the same polygon as {p/(pq)} (as long as you ignore the orientation of the polygon). You may also notice that if q is larger than p, you end up repeating the same patterns, in particular {p/q} = {p/(q mod p)}. Also you will notice that if p and q have common factors, you end up having skipped vertices. In our process we are throwing these away to ensure that our polygons are connected, but you can extend the process and keep them (see note below).

The process described is straightforward to implement in a program. The images shown here were generated in Tinkerplots. To implement it in Tinkerplots, you need two sliders – p and q, and the following attributes:

n = caseIndex()
theta = 2*n*pi(1-q/p)
x = cos(theta)
y = sin(theta)

If you create a plot with y vertical and x horizontal, choose “show connecting lines” and add a filter n<=p+1, you can add a large number of cases to the collection (~200, say) and be able to slide p and q to create a wide variety of connected star polygons. The only restriction is that p must be less than the number of cases you have created. There is nothing special about using Tinkerplots here – any programming environment with reasonable graphics should do a reasonable job (Logo would be fine. :)).

The polygons below are the regular connected polygons based on 12 vertices. Because 12 is divisible by 2, 3, 4, and 6 we end up with regular polygons triangle {3}, square {4}, hexagon {6} and only one star polygon {12/5}. The “degenerate” polygon {2} is known as a “digon.” Here, drawing the diagram first and then seeing what polygon comes out will give you the same result as dividing p/q first and then drawing the corresponding polygon. In this sense, the notation and diagrams nicely reflect each other.

Contrast this with the family of star polygons that are generated when a prime number of vertices are used. The images below are the family of regular connected polygons generated on 13 vertices.

Note – by throwing away the unconnected dots in our process we are ignoring star polygons that are made of overlapping disjoint star or regular polygons, for example two overlapping triangles that make a star of David. These also work well with the Schläfli notationTo create these overlapping polygons, if you have any skipped vertices, you just begin your process again beginning with one of the vertices you skipped over. In the case of {6/2}, instead of getting one triangle {3} you will get two overlapping triangles, or 2{3}. To write a program that would draw these you would want to use something more sophisticated than Tinkerplots.

For more such insights, log into www.international-maths-challenge.com.

*Credit for article given to dan.mackinnon*


Digit Patterns in Power Sequences

Looking at the last few digits that appear in the numbers that form the sequence b^0, b^1, b^2, b^3, … for b a positive integer, you’ll notice that the digits will always begin to repeat after a certain point. For example, looking at the last digit of the sequences for b = 2, 3, and 4 we have the sequences

b = 2: 1, 2, 4, 8, 6, 2, 4, 8, 6, …
b = 3: 1, 3, 9, 7, 1, 3, 9, 7, …
b = 4: 1, 4, 6, 4, 6, 4, 6, …

If we look at the sequence of last two digits of these sequence where b =2 we have

b = 2: 1, 2, 4, 8, 16, 32, 64, 28, 56, 12, 24, 48, 96, 92, 84, 68, 36, 72, 44, 88, 76, 52, 4, …

This sequence then repeats the loop that began at 4.

We can describe these sequences as T_b,d(n) = (b^n)mod 10^d. Recursively, T_b,d(n) = (T_b,d(n-1)*b)mod 10^d

These sequences are always eventually periodic. Although these sequences are simple to understand and calculate, there are several interesting ways of describing them.

For example, you can think of the elements of T_b,d as a commutative monoid, with multiplication defined as a*b = (a*b)mod 10^d. They form a monoid since 1 is always a member, and you can show that T_b,d is closed under the * operation. It turns out that for some values of b, and d, T_b,d is a group.

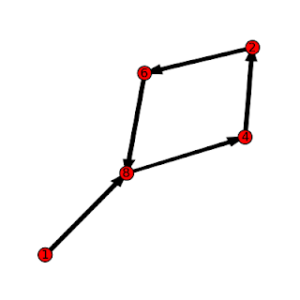
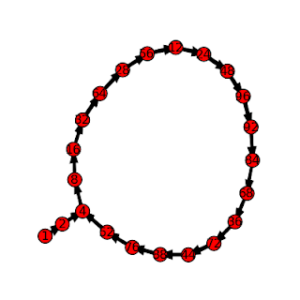
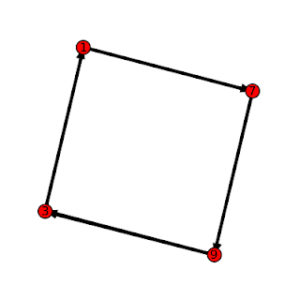
You can also think of this set as a finite state machine or graph, where each element is a node and the transition from one node to the next is defined by the operation *b mod 10^d. This provides a nice way of displaying the sequences. The pictures in this post were created by writing a short program to calculate the sequences, and then formatting the output to draw a di-graph in SAGE. The graph at the top of the post is for b=8, d=1, while the graph below is for b=2, d=2. The graph at the bottom of the page is for b=7, d=1.

For more such insights, log into www.international-maths-challenge.com.

*Credit for article given to dan.mackinnon*


Higher Polygonal Numbers and Pascal’s Triangle

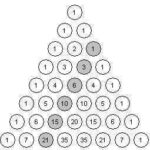
The third diagonal column in Pascal’s Triangle (r = 2 in the usual way of labeling and numbering) consists of the triangular numbers (1, 3, 6, 10, …) – numbers that can be arranged in 2-dimensional triangular patterns. The fourth column of Pascal’s triangle gives us triangular-based pyramidal numbers (1, 4, 10, 20, …), built by stacking the triangular numbers. The columns further out give “higher dimensional” triangular numbers that arise from stacking the triangular numbers from the previous dimension.

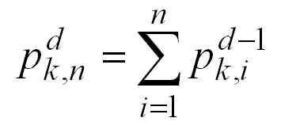
It is not by coincidence that the triangular and higher-dimensional triangular numbers appear in Pascal’s Triangle. If you think about layering of polygonal numbers in terms of equations, you get

In the above equation p^d_(k,n) is the nth k-polygonal number of dimension d. Triangular numbers are the 3-polygonal numbers of dimension 2, square numbers are the 4-polygonal numbers of dimension 2, “square based pyramidal numbers” would be denoted as p^3_(4,n).
from the sum above, you can obtain this equation:

Which looks very much like the Pascal Identity C(n,r) = C(n-1,r-1) + C(n-1,r), except for some translation of the variables. To be precise, if we consider the case where k=3 and use r = d and n‘ = n+d-1 we can translate the triangular numbers into the appropriate positions in Pascal’s Triangle.

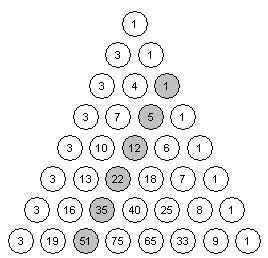
Along with the definitions for the end columns, the Pascal Identity allows us to generate the whole triangle. This suggests the following strategy for calculating the higher k-Polygonal numbers: create a modified Pascal’s Triangle whose first column is equal to k-2 (instead of 1), and whose last column is equal to 1 (as usual). This modified Pascal’s Triangle is generated using these initial values and the usual Pascal Identity.

Here is an example with k=5, which sets the first column values equal to 3 (except for the top value, which we keep as 1) and yields the pentagonal numbers (column 3) and the higher pentagonal numbers.

The formula for these modified Pascal Triangles is given by this equation:

If we apply the change of variables mentioned above, we can obtain this general formula for the higher polygonal numbers in terms of combinations:

This formula illustrates how polygonal numbers are built out of triangular numbers. It says that the nth d-dimensional k-polygonal number is equal to the nth d-dimensional triangular number, plus (k-3) copies of the n-1 d-dimensional triangular number. This is a little easier to understand when you forget about the higher-dimensions and look at the regular 2-dimensional polygonal number.

For more such insights, log into www.international-maths-challenge.com.

*Credit for article given to dan.mackinnon*


Monty Hall and the Three Prisoners

Brian Hayes recently provided some evidence that there are still many out there who are confounded by the Monty Hall problem.

The Monty Hall problem, perhaps the best-known counter-intuitive probability problem, gets a nice treatment in Jeffery Rosenthal’s Struck by Lightning: The Curious World of Probabilities, and is also explained well (perhaps better) in Mark Haddon’s novel The Curious Incident of the Dog in the Night-time. Professor Rosenthal has some further Monty Hall explanations here.

I just found an alternate version of the problem in Martin Gardner’s The Second Scientific American Book of Mathematical Puzzles and Diversions (published also by Penguin in a slightly different form as More Mathematical Puzzles and Diversions). In the chapter “Probability and Ambiguity” (chapter 19 in both versions of the book), Gardner describes the problem of the three prisoners. Here is a condensed description of the problem:

Three prisoners, A, B, and C are in separate cells and sentenced to death. The governor has selected one of them at random to be pardoned. Finding out that one is to be released, prisoner A begs the warden to let him know the identity of one of the others who is going to be executed. “If B is to be pardoned, give me C’s name. If C is to be pardoned, give me B’s name. And if I’m to be pardoned, flip a coin to decide whether to name B or C.”

The warden tells A that B is to be executed. Prisoner A is pleased because he believes that his probability of surviving has gone up from 1/3 to 1/2. Prisoner A secretly tells C the news, who is also happy to hear it, believing that his chance of survival has also risen to 1/2.

Are A and C correct? No. Prisoner A’s probability of surviving is still 1/3, but prisoner C’s probability of receiving the pardon is 2/3.

It is reasonably easy to see that the 3 prisoners problem is the same as the Monty Hall problem. Seeing the problem in this different formulation might help those who continue to struggle with it.

It is a nice activity to simulate both the 3 prisoners problem and the Monty Hall problem in Fathom – try it and confirm the surprising results that the “second prisoner” is pardoned 2/3 of the time, and that 2/3 of the time, the winning curtain is not the one you selected first.

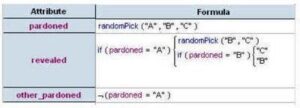
There are many, many, ways to write these simulations. Here are the attributes and formulas for a Fathom implementation of the three prisoners:

The table below (click on it to see a larger version) shows a separate simulation for the Monty Hall problem. Here we are assuming three curtains “1”, “2”, and “3”, one of which has a prize behind it. You pick one, and then Monty reveals the contents behind one of the other curtains (the curtain with the prize behind it is not shown). In the game, you have the option of switching your choice for the curtain that has not been revealed.

After creating the attributes, you can “run the simulation” by adding data to the collection (Collection->New Cases…), the more the better.

Incidentally, Gardner’s use of A, B, and C reminds me of Stephen Leacock’s “A, B, and C: The Human Element in Mathematics.”

Addendum

A quick search shows that the connection between the Monty Hall problem and the Three Prisoners is well known (see the wikipedia entries on Monty Hall and the Three Prisoners), and that both are alternate formulations of an older problem, known as Bertrand’s box paradox.

For more such insights, log into www.international-maths-challenge.com.

*Credit for article given to dan.mackinnon*