What’s the shape of the universe? Mathematicians use topology to study the shape of the world and everything in it

You can describe the shape you live on in multiple dimensions. vkulieva/iStock via Getty Images Plus

When you look at your surrounding environment, it might seem like you’re living on a flat plane. After all, this is why you can navigate a new city using a map: a flat piece of paper that represents all the places around you. This is likely why some people in the past believed the earth to be flat. But most people now know that is far from the truth.

You live on the surface of a giant sphere, like a beach ball the size of the Earth with a few bumps added. The surface of the sphere and the plane are two possible 2D spaces, meaning you can walk in two directions: north and south or east and west.

What other possible spaces might you be living on? That is, what other spaces around you are 2D? For example, the surface of a giant doughnut is another 2D space.

Through a field called geometric topology, mathematicians like me study all possible spaces in all dimensions. Whether trying to design secure sensor networks, mine data or use origami to deploy satellites, the underlying language and ideas are likely to be that of topology.

The shape of the universe

When you look around the universe you live in, it looks like a 3D space, just like the surface of the Earth looks like a 2D space. However, just like the Earth, if you were to look at the universe as a whole, it could be a more complicated space, like a giant 3D version of the 2D beach ball surface or something even more exotic than that.

A doughnut, also called a torus, is a shape that you can move across in two directions, just like the surface of the Earth. YassineMrabet via Wikimedia Commons, CC BY-NC-SA

While you don’t need topology to determine that you are living on something like a giant beach ball, knowing all the possible 2D spaces can be useful. Over a century ago, mathematicians figured out all the possible 2D spaces and many of their properties.

In the past several decades, mathematicians have learned a lot about all of the possible 3D spaces. While we do not have a complete understanding like we do for 2D spaces, we do know a lot. With this knowledge, physicists and astronomers can try to determine what 3D space people actually live in.

While the answer is not completely known, there are many intriguing and surprising possibilities. The options become even more complicated if you consider time as a dimension.

To see how this might work, note that to describe the location of something in space – say a comet – you need four numbers: three to describe its position and one to describe the time it is in that position. These four numbers are what make up a 4D space.

Now, you can consider what 4D spaces are possible and in which of those spaces do you live.

Topology in higher dimensions

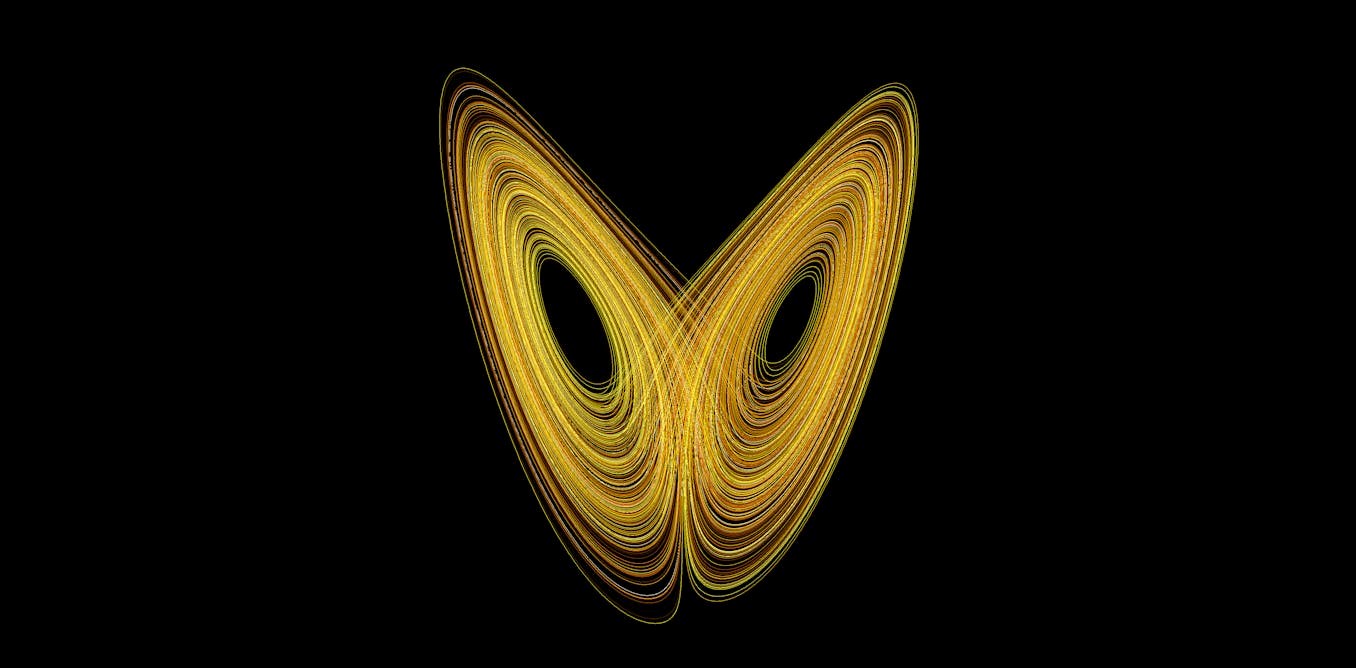
At this point, it may seem like there is no reason to consider spaces that have dimensions larger than four, since that is the highest imaginable dimension that might describe our universe. But a branch of physics called string theory suggests that the universe has many more dimensions than four.

There are also practical applications of thinking about higher dimensional spaces, such as robot motion planning. Suppose you are trying to understand the motion of three robots moving around a factory floor in a warehouse. You can put a grid on the floor and describe the position of each robot by their x and y coordinates on the grid. Since each of the three robots requires two coordinates, you will need six numbers to describe all of the possible positions of the robots. You can interpret the possible positions of the robots as a 6D space.

As the number of robots increases, the dimension of the space increases. Factoring in other useful information, such as the locations of obstacles, makes the space even more complicated. In order to study this problem, you need to study high-dimensional spaces.

There are countless other scientific problems where high-dimensional spaces appear, from modeling the motion of planets and spacecraft to trying to understand the “shape” of large datasets.

Tied up in knots

Another type of problem topologists study is how one space can sit inside another.

For example, if you hold a knotted loop of string, then we have a 1D space (the loop of string) inside a 3D space (your room). Such loops are called mathematical knots.

The study of knots first grew out of physics but has become a central area of topology. They are essential to how scientists understand 3D and 4D spaces and have a delightful and subtle structure that researchers are still trying to understand.

Knots are examples of spaces that sit inside other spaces. Jkasd/Wikimedia Commons

In addition, knots have many applications, ranging from string theory in physics to DNA recombination in biology to chirality in chemistry.

What shape do you live on?

Geometric topology is a beautiful and complex subject, and there are still countless exciting questions to answer about spaces.

For example, the smooth 4D Poincaré conjecture asks what the “simplest” closed 4D space is, and the slice-ribbon conjecture aims to understand how knots in 3D spaces relate to surfaces in 4D spaces.

Topology is currently useful in science and engineering. Unraveling more mysteries of spaces in all dimensions will be invaluable to understanding the world in which we live and solving real-world problems.

For more such insights, log into www.international-maths-challenge.com.

*Credit for article given to John Etnyre*


Boys not only perform better in maths, they are also more confident about the subject than girls

Michael Jung/ Shutterstock

There is a persistent gender gap in Australian schools. Boys, on average, outperform girls in maths.

We see this in national tests such as NAPLAN, as well as international assessments.

New Australian Council for Educational Research analysis by my colleague Catherine Underwood shows how boys, on average, are also more confident and positive about maths than girls.

What can parents do to help their children feel more confident about this core subject?

Boys outperform girls in maths

An important measure of students’ maths performance is the OECD’s Programme for International Assessment (PISA) test. Run every three years, it measures 15-year-olds’ ability to apply their maths, science and reading knowledge to real-world situations.

In 2022, 53% of Australian male students achieved the PISA national proficiency standard in maths, compared with 48% of female students. The gender gap on average scores was also greater in Australia than across the OECD.

As part of PISA, students also completed a questionnaire about their attitudes to learning. ACER’s new analysis uses data from the questionnaire to look at Australian students’ confidence in maths and how this differs between girls and boys.

Boys outperformed girls in maths skills in the most recent PISA test. Monkey Business Images/ Shutterstock

Why is confidence so important?

Research suggests students’ confidence has an impact on their academic performance. Researchers can call this “self-efficacy”, or the belief in your ability to successfully perform tasks and solve problems.

Students with high mathematical self-efficacy embrace challenges, use effective problem-solving strategies, and persevere despite difficulties. Those with low self-efficacy may avoid tasks, experience anxiety, and ultimately underperform due to a lack of confidence in their maths abilities.

We can see this in the 2022 PISA results. Girls in the top quarter on the self-rated “self-efficacy index” scored an average of 568 points on the PISA maths performance test, a staggering 147 points higher than the average for girls in the lowest quarter on the index.

For boys, the benefit of confidence was even more pronounced. Those in the top quarter of the index scored 159 points on average higher in maths performance than those in the lowest quarter.

Boys are more confident than girls

The PISA questionnaire asked students how confident they felt about having to do a range of formal and applied maths tasks.

Students showed similar levels of confidence solving formal maths tasks such as equations. But male students, on average, showed they were more confident than female students with applied mathematics tasks such as:

  • finding distances using a map
  • calculating a power consumption rate
  • calculating how much more expensive a computer would be after adding tax
  • calculating how many square metres of tiles are needed to cover a floor.

What about attitude?

The PISA data also shows Australian boys, on average, have more positive attitudes towards maths than girls.

For example, in response to the statement “mathematics is easy for me” only 41% of female students agreed, compared with 55% of male students.

In response to “mathematics is one of my favourite subjects”, 37% of female students agreed, compared with 49% of males.

But in response to “I want to do well in my mathematics class”, 91% of female students agreed, compared to 92% of males.

What can parents do at home to help?

It is troubling that girls, on average, show consistently lower levels of confidence about maths tasks.

This comes on top of other PISA questionnaire results that have shown in general (not just around maths) that a higher proportion of girls than boys say they feel nervous approaching exams.

We want all students to have a positive relationship with maths, where they can appreciate maths skills are important in many aspects of their lives, and they’re willing to have a go to develop them.

Recently, we collaborated with the Victorian Academy of Teaching and Leadership on resources for teachers, students and parents that focus on addressing maths anxiety.

Research shows how we talk about maths at home is important in shaping students’ attitudes and persistence. Parents can help create a positive atmosphere around maths by:

  • dispelling “maths myths”, such as the idea maths ability is fixed and no amount of effort or practise can improve it
  • talking about how making mistakes is a normal part of learning
  • thinking about about how we forgive mistakes in other areas (such as sport, art or science): how can we treat maths mistakes in a similar way?
  • telling your child they have done a good job when they put effort into their maths learning.

Parents can also help their children even if they don’t know the answers to maths problems. It’s perfectly fine to say, “I’m not sure how to do that one but who can we ask for help? Let’s talk to the teacher.”

Modelling a “help-seeking” approach lets children know that it’s OK not to know the answer, the key is to persist and try.

For more such insights, log into www.international-maths-challenge.com.

*Credit for article given to Sarah Buckley*


The butterfly effect: this obscure mathematical concept has become an everyday idea, but do we have it all wrong?

Edward Lorenz’s mathematical weather model showed solutions with a butterfly-like shape. Wikimol

In 1972, the US meteorologist Edward Lorenz asked a now-famous question:

Does the flap of a butterfly’s wings in Brazil set off a tornado in Texas?

Over the next 50 years, the so-called “butterfly effect” captivated the public imagination. It has appeared in movies, books, motivational and inspirational speeches, and even casual conversation.

The image of the tiny flapping butterfly has come to stand for the outsized impact of small actions, or even the inherent unpredictability of life itself. But what was Lorenz – who is now remembered as the founder of the branch of mathematics called chaos theory – really getting at?

A simulation goes wrong

Our story begins in the 1960s, when Lorenz was trying to use early computers to predict the weather. He had built a basic weather simulation that used a simplified model, designed to calculate future weather patterns.

One day, while re-running a simulation, Lorenz decided to save time by restarting the calculations from partway through. He manually inputted the numbers from halfway through a previous printout.

But instead of inputting, let’s say, 0.506127, he entered 0.506 as the starting point of the calculations. He thought the small difference would be insignificant.

He was wrong. As he later told the story:

I started the computer again and went out for a cup of coffee. When I returned about an hour later, after the computer had generated about two months of data, I found that the new solution did not agree with the original one. […] I realized that if the real atmosphere behaved in the same manner as the model, long-range weather prediction would be impossible, since most real weather elements were certainly not measured accurately to three decimal places.

There was no randomness in Lorenz’s equations. The different outcome was caused by the tiny change in the input numbers.

Lorenz realised his weather model – and by extension, the real atmosphere – was extremely sensitive to initial conditions. Even the smallest difference at the start – even something as small as the flap of a butterfly’s wings – could amplify over time and make accurate long-term predictions impossible.

The ‘Lorenz Attractor’ found in models of a chaotic weather system has a characteristic butterfly shape. Milad Haghani, CC BY

Lorenz initially used “the flap of a seagull’s wings” to describe his findings, but switched to “butterfly” after noticing a remarkable feature of the solutions to his equations.

In his weather model, when he plotted the solutions, they formed a swirling, three-dimensional shape that never repeated itself. This shape — called the Lorenz attractor — looked strikingly like a butterfly with two looping wings.

Welcome to chaos

Lorenz’s efforts to understand weather led him to develop chaos theory, which deals with systems that follow fixed rules but behave in ways that seem unpredictable.

These systems are deterministic, which means the outcome is entirely governed by initial conditions. If you know the starting point and the rules of the system, you should be able to predict the future outcome.

There is no randomness involved. For example, a pendulum swinging back and forth is deterministic — it operates based on the laws of physics.

Systems governed by the laws of nature, where human actions don’t play a central role, are often deterministic. In contrast, systems involving humans, such as financial markets, are not typically considered deterministic due to the unpredictable nature of human behaviour.

A chaotic system is a system that is deterministic but nevertheless behaves unpredictably. The unpredictability happens because chaotic systems are extremely sensitive to initial conditions. Even the tiniest differences at the start can grow over time and lead to wildly different outcomes

Chaos is not the same as randomness. In a random system, outcomes have no definitive underlying order. In a chaotic system, however, there is order, but it’s so complex it appears disordered.

A misunderstood meme

Like many scientific ideas in popular culture, the butterfly effect has often been misunderstood and oversimplified.

One common misconception is that the butterfly effect implies every small action leads to massive consequences. In reality, not all systems are chaotic, and for systems that aren’t, small changes usually result in small effects.

Another is that the butterfly effect carries a sense of inevitability, as though every butterfly in the Amazon is triggering tornadoes in Texas with each flap of its wings.

This is not at all correct. It’s simply a metaphor pointing out that small changes in chaotic systems can amplify over time, making long-term outcomes impossible to predict with precision.

Taming butterflies

Systems that are very sensitive to initial conditions are very hard to predict. Weather systems are still tricky, for example

Forecasts have improved a lot since Lorenz’s early efforts, but they are still only reliable for a week or so. After that, small errors or imprecisions in the starting data grow larger and larger, eventually making the forecast inaccurate.

To deal with the butterfly effect, meteorologists use a method called ensemble forecasting. They run many simulations, each starting with slightly different initial conditions.

By comparing the results, they can estimate the range of possible outcomes and their likelihoods. For example, if most simulations predict rain but a few predict sunshine, forecasters can report a high probability of rain.

However, even this approach works only up to a point. As time goes on, the predictions from the models diverge rapidly. Eventually, the differences between the simulations become so large that even their average no longer provides useful information about what will happen on a given day at a given location.

A butterfly effect for the butterfly effect?

The journey of the butterfly effect from a rigorous scientific concept to a widely popular metaphor highlights how ideas can evolve as they move beyond their academic roots.

While this has helped bring attention to a complex scientific concept, it has also led to oversimplifications and misconceptions about what it really means.

Attaching a metaphor to a scientific phenomenon and releasing it into popular culture can lead to its gradual distortion.

Any tiny inaccuracies or imprecision in the initial description can be amplified over time, until the final outcome is a long way from reality. Sound familiar?

For more such insights, log into www.international-maths-challenge.com.

*Credit for article given to Milad Haghani*


English children lag behind in geometry – parents can help them learn through play

Shutterstock

Geometry is an important branch of mathematics, which we use to understand the properties of 2D and 3D space such as distance, shape, size and position. We use geometry every day: cutting paper to wrap a present, calculating the area of a room to tile a floor, and interpreting pie charts and bar graphs at work. Even noticing when a picture on the wall is askew draws on our geometrical understanding.

But although children in England excel in mathematics compared to many countries, their scores in geometry are significantly below their overall mathematics scores. This pattern has held consistently for children in both year five (ages nine and ten) and year nine (ages 13-14) since 2015.

The solution might lie in improving children’s spatial skills: something that could be done through activities as simple and fun as playing with jigsaws, toy cars or construction sets.

Spatial thinking is the ability to understand the spatial properties of objects, such as their size and location, and to visualise objects and problems. Try, for instance, to picture a cube in your mind. How many sides does it have? You’ve just used spatial visualisation skills to work it out.

Research consistently shows that children who are good at spatial thinking are good at maths, and that spatial training is effective for maths improvement.

Despite this, spatial thinking isn’t an area of focus in schools. Instead, the current mathematics curriculum has a strong focus on number.

For example, the current geometry curriculum doesn’t include visualisation. Visualisation is the ability to imagine and manipulate spatial information in the mind’s eye. It is an aspect of spatial thinking which is foundational to mathematics. The inclusion of more spatial thinking would have benefits across the teaching of maths. As well as being central to geometry, it helps with reading graphs, rearranging formulae and problem solving.

In the meantime, though, parents can help their children develop spatial skills at home. Here are some tips for pre-school and primary age children.

Spatial play

When doing a jigsaw, ask your child if they can turn the piece in their imagination, rather than trying different options with the real piece, to work out where it goes. This draws on visualisation.

Your child may well have received a craft kit, marble run or construction set for Christmas. Any toy like this with pictorial instructions – diagrams you have to follow to construct something – requires spatial skills.

Encourage your child to look at the instructions and then back at their creation. This engages visual memory: the ability to maintain an image in memory for a small amount of time. This is important for holding numbers in mind during mathematical problem solving.

If your child likes playing with dollhouses, toy cars or toy farms, ask them about differences in scale – whether, for instance, a doll’s hat would fit on their own head. You could ask them to draw a road for their toy cars, thinking about how big it will have to be to fit them.

Small-word play can help develop spatial skills. Kolpakova Daria/Shutterstock

This encourages the development of spatial scaling, a spatial skill that children can later employ when reasoning about proportions or working with fractions.

For pre-school children, simple activities like sorting teddies by size and labelling them “small,” “medium,” or “large,” can build an early foundation for spatial reasoning.

While playing with your children, try to use spatial language – words such as “left”, “right”, “between”, “in”, “above” – to discuss what you are doing. When parents use more spatial language, their children also use more spatial language – and children with stronger spatial language demonstrate stronger mathematics performance. So, using these words will be beneficial for your children’s mathematics development.

Some spatial words are more challenging than others. “Between” is hard for a four-year-old, and “increase” and “parallel” are better used with older children. To help your child understand these concepts, you can use your hands to demonstrate. Hand gestures provide a concrete representation of a spatial concept and help children visualise what a spatial word means.

Encouraging quality spatial play is an easy and enjoyable way for parents to enlighten children to the spatial aspects of the world. Not only will this strengthen their spatial and mathematical skills, but it will also give them a solid foundation for future success, at school and beyond.

For more such insights, log into www.international-maths-challenge.com.

*Credit for article given to Emily Farran*


‘I was scared’: many student teachers had bad maths experiences at school. Here’s how they can do better

Toey Adante/ Shutterstock

What do you remember about maths at school? Did you whizz through the problems and enjoy getting the answers right? Or did you often feel lost and worried you weren’t keeping up? Perhaps you felt maths wasn’t for you and you stopped doing it altogether.

Maths can generate strong emotions in students. When these emotions are negative, it leads to poor mathematical wellbeing. This means students do not feel good when doing maths and do not function well. They may experience feelings of hopelessness and despair, and view themselves as incapable of learning maths.

Poor mathematical wellbeing, if not addressed, can develop into maths anxiety). This can impact working memory (which we use for calculating and problem-solving) and produce physical symptoms such as increased heart and breathing rates. It can also lead to students avoiding maths subjects, courses and careers.

Research shows students often start primary school enjoying and feeling optimistic about maths. However, these emotions can decline rapidly as students progress through school and can continue into adulthood.

Our new, as-yet-unpublished, research shows how this can be an issue for those studying to become teachers.

Our research

We frequently see students enter our university courses lacking confidence in their maths knowledge and ability to teach the subject. Some students describe it as “maths trauma”.

To better understand this issue, we surveyed 300 students who are studying to be primary teachers. All were enrolled in their first maths education unit.

We asked them to recount a negative and positive experience with maths at school. Many described feelings of shame and hopelessness. These feelings were often attributed to unsupportive teachers and teaching practices when learning maths at school.

As teacher educators, we often see students who do not have confidence to teach maths. Ground Picture/ Shutterstock

‘I felt so much anxiety’

The responses describing unpleasant experiences were highly emotional. The most common emotion experienced was shame (35%), followed by anxiety (27%), anger (18%), hopelessness (12%) and boredom (8%). Students also described feeling stupid, afraid, left behind, panicked, rushed and unsupported.

Being put on the spot in front of their peers and being afraid of providing wrong answers was a significant cause of anxiety:

The teacher had the whole class sitting in a circle and was asking students at random different times tables questions like ‘what is 4 x 8?’ I remember I felt so much anxiety sitting in that circle as I was not confident, especially with my six and eight times tables.

Students recalled how competition between students being publicly “right” or “wrong” featured in their maths lessons. Another student recalled how their teacher held back the whole class until a classmate could perfectly recite a certain times table.

Students also told us about feeling left behind and not being able to catch up.

In around Year 9, I remember doing algebra, and feeling like I didn’t ‘get’ it. I remember the feeling of falling behind. Not nice! The feeling of gentle panic, like you’re trying to hang on and the rope is pulled through your hands.

Students also described the stress of results being made public in front of their classmates. Another respondent told us how the teacher called out NAPLAN maths results from lowest to highest in front of the whole class.

Students often feel more negatively about maths as they progress through school. Juice Verve/Shutterstock

‘I was scared of maths teachers’

In other studies, primary and high school students have said a supportive teacher is one of the most important influences on their mathematical wellbeing.

In our research, many of the students’ descriptions directly mentioned “the teacher”. This further shows how important the teacher/student relationship is and its impact on students’ feelings about maths. As one student told us, they were:

[…] belittled by the teacher and the class [was] asked to tell me the answer to the question that I didn’t know. I felt lost and embarrassed and upset.

Another student told us how they were asked to stay behind after class after others had left because they didn’t understand “wordy maths problems”.

[there were] sighs and huffs from the teacher as it was taking so long to learn. I was scared of maths and maths teachers.

But teachers were also mentioned extensively when students reflected on pleasant experiences. Approximately one third of student responses mentioned teachers who were understanding, kind and supportive:

In Year 8 my teacher for maths made it fun and engaging and made sure to help every student […] The teacher made me feel smart and that if I put my mind to it I could do it.

What can we do differently?

Our research suggests there are four things teachers can do differently when teaching maths to support students’ learning and feelings about maths.

  1. Work with negative emotions: we can support students to tune into negative emotions and use them to their advantage. For example, we can show students how to embrace being confused – this is an opportunity to learn and with the right level of support, overcome the issue. In turn, this teaches students resilience.
  2. Normalise negative emotions: we can invite students to share their emotions with others in the class. Chances are, they will not be the only one feeling worried. This can help students feel supported and show them they are not alone.
  3. Treat mathematical wellbeing as seriously as maths learning: teachers can be patient and supportive and make sure maths lessons are engaging and relevant to students’ lives. When teachers focus on enjoying learning and supporting students’ psychological safety, this encourages risk-taking and makes it harder to develop negative emotions.
  4. Ditch the ‘scary’ methods: avoid teaching approaches that students find unpleasant – such as pitting students against each other or calling on students for an answer in front of their peers. In doing so, teachers can avoid creating more “maths scars” in the next generation of students.

For more such insights, log into www.international-maths-challenge.com.

*Credit for article given to Tracey Muir, Julia Hill,  & Sharyn Livy*


Why are boys outperforming girls in maths?

Vitalii Stock/Shutterstock

A major international test has revealed a concerning gender gap in maths among Australian school students.

In the 2023 Trends in International Mathematics and Science Study (TIMSS), Australia’s boys did much better than girls.

Year 4 boys outperformed girls by the equal highest margin out of 58 countries that did the test. The story is not much better for Year 8 students – Australia had the 12th-largest gender gap of the 42 countries.

This is out of character with other subjects, such as literacy, where the gender gap is either much smaller, or girls outperform boys.

Why is there a gap?

International researchers have been aware of a gender gap in maths for decades and have been trying to understand why and how to fix it .

It has previously been suggested boys are just better at mathematics than girls. However, this has been thoroughly debunked, with many studies finding no statistically significant biological difference between boys and girls in maths ability.

Yet figures consistently show girls are under-represented in the most advanced maths courses at school. For example, for the two most advanced Year 11 and 12 courses in New South Wales, girls are outnumbered by a ratio of roughly two to one.

NSW girls are less likely to study advanced maths subjects in senior high school than boys. Juice Verve/ Shutterstock

A ‘boys’ subject?‘

Studies suggest social factors and individual motivation are playing a part in the maths gender gap.

Research has found stereotyping is a problem, with maths been seen as a “boys’ subject”. These ideas start developing from an early age, even as young as five.

These stereotypes can negatively impact girls’ motivation in maths and their self-efficacy (their perception of how well they can do), which then impacts performance.

Girls are also more likely to develop maths anxiety, which may be due to lacking confidence in their ability.

Another possible reason for this gap is it is not as important for girls themselves to be seen as skilled at maths as it is for boys. This has been linked to differences in subject engagement and subsequent performance.

Given how important mathematical skills are for workplaces today and in the future, we need to change these attitudes.

Girls can start seeing maths as a ‘boys’ subject from early primary school. Monkey Business Images/ Shutterstock

What can we do?

Unfortunately, there are no simple answers. However, we recommend three strategies to help narrow the gap.

  1. Treat boys and girls equally when it comes to maths: there is a noted tendency to expect boys to engage in more challenging maths than girls. If parents and teachers expect less from girls, we are feeding the stereotype that maths is “more suited to boys”. Simply holding beliefs that boys are better at maths can result in spending more time with or giving more attention to boys in maths. It can also be seen in behaviours where we think we are being supportive, such as reassuring a struggling girl, “it’s ok if you’re not great at maths”!
  2. Talk to girls about maths: girls historically report lower confidence in maths when correlated with their actual achievement. This means girls potentially have inaccurate beliefs about their ability. So we need to understand how they feel they are progressing and make sure they understand their genuine progress.
  3. Make use of female maths role models: when girls see themselves represented in maths-intensive careers – such as engineers, actuaries, chemists, economists, data scientists, architects and software developers – they are more likely to see the importance and value of maths. We know this can inspire young people.

For more such insights, log into www.international-maths-challenge.com.

*Credit for article given to Ben Zunica & Bronwyn Reid O’Connor*


Mandelbrot’s fractals are not only gorgeous – they taught mathematicians how to model the real world

At the beginning of my third year at university studying mathematics, I spotted an announcement. A visiting professor from Canada would be giving a mini-course of ten lectures on a subject called complex dynamics.

It happened to be a difficult time for me. On paper, I was a very good student with an average of over 90%, but in reality I was feeling very uncertain. It was time for us to choose a branch of mathematics in which to specialise, but I hadn’t connected to any of the subjects so far; they all felt too technical and dry

So I decided to take a chance on the mini-course. As soon as it started, I was captured by the startling beauty of the patterns that emerged from the mathematics. These were a relatively recent discovery, we learned; nothing like them had existed before the 1980s.

They were thanks to the maverick French-American mathematician Benoit Mandelbrot, who came up with them in an attempt to visualise this field – with help from some powerful computers at the IBM TJ Watson Research Center in upstate New York.

A fractal – the term he derived from the Latin word fractus, meaning “broken” or “fragmented” – is a geometric shape that can be divided into smaller parts which are each a scaled copy of the whole. They are a visual representation of the fact that even a process with the simplest mathematical model can demonstrate complex and intricate behaviour at all scales.

Benoit Mandelbrot (1924-2010). Wikimedia, CC BY-SA

How the fractals are created

The system used by Mandelbrot was as follows: you choose a number (z), square it and then add another number (c). Then repeat over and over, keeping c the same while using the sum total from the previous calculation as z each time.

Starting, for example, with z=0 and c=1, the first calculation would be 0² + 1 = 1. By making z=1 for the next calculation, it’s 1² + 1 = 2, and so on.

To get a sense of what comes next, you can plot the value of c on a line and colour code it depending on how many iterations in the series it takes for the sum total to exceed 4 (the reason it’s 4 is because anything larger will quickly grow towards an infinitely large number in subsequent iterations). For example, you might use blue if the series never exceeds 4, red if it gets there after 1-5 iterations, black if it takes 6-9 iterations, and so on.

The Mandelbrot set is actually more complicated because you don’t plot c on a line but on a plane with x and y axes. This involves introducing several more mathematical concepts where c is a complex number and the y axis refers to imaginary values. If you want more on these, watch the video below. By plotting lots of different values of c on the plane, you derive the fractals.

This idea of visualisation from Mandelbrot, who would have turned 100 this month, led mathematicians to accept the role of pictures in experimental mathematics. It has also led to a huge amount of research. On five out of eight occasions since 1994, the Fields medal – among the highest accolades in mathematics – has been awarded for work related to his conjectures.

Mandelbrot in the real world

For centuries, mathematicians had to live with the uncomfortable thought that their existing tools – known as Euclidean geometry – were not really suitable for modelling and understanding the real world. They all produced smooth curves, but nature is not like that.

For example, one can sketch the shape of the British coastline with a few continuous strokes. But once you zoom in, you can see lots of small irregularities that were previously invisible. The same holds true for the beds of the rivers, mountains and the branches of trees, among many others.

When mathematicians tried to model the surface of anything, these small imperfections were always in the way. To make their work fit reality, they had to introduce additional elements which superimposed “noise” on top. But these were ugly and absurd, compensating for their inadequacies by creating an illusion.

Mandelbrot’s revolutionary philosophy, presented in his 1982 manifesto, The Fractal Geometry of Nature, argued that scientific methods could be adapted to study vast classes of irregular phenomena like these. He was the first to realise that, scattered around the research literature, often in obscure sources, were the germs of a coherent framework that would allow mathematical models to go beyond the comfort of Euclidean geometry, and tackle the irregularities without relying on a superimposed mechanism.

Tree branches are one of any number of natural phenomena that mathematicians struggled to model. Mariia Romanyk

This made his theory applicable to a wide range of improbably diverse fields. For example, it is used to model cloud formation in meteorology, and price fluctuations in the stock market. Other fields in which it has application include statistical physics, cosmology, geophysics, computer graphics and physiology.

Mandelbrot’s life story was just as jagged as his discovery. He was born to a Jewish-Lithuanian family in Warsaw in 1924. Sensing the approaching trouble, the family first moved to Paris in 1936, then to a small town in the south of France.

In 1945 he was admitted to the most prestigious university in France, the École Normale Supérieure in Paris, but stayed only for a day. He dropped out to move to the less prestigious École Polytechnique, which suited him better.

Following an MSc in aerodynamics at California Institute of Technology and a PhD in mathematics at the University of Paris, Mandelbrot spent most of his active scientific life in an IBM industrial laboratory. Only in 1987 was he appointed Abraham Robinson Adjunct Professor of Mathematical Sciences at Yale, where he stayed until his death in 2010.

It is no exaggeration to say that Mandelbrot is one of the greatest masterminds of our era. Thanks to his work, visual images of fractals have become symbolic for mathematical research as a whole. The community recognised his contribution by naming one of the most famous fractals the Mandelbrot set.

In the epilogue of a 1995 documentary about his discovery, The Colours of Infinity, we see Benoit addressing the camera:

I’ve spent most of my life unpacking the ideas that became fractal geometry. This has been exciting and enjoyable, most times. But it also has been lonely. For years few shared my views. Yet the ghost of the idea of fractals continued to beguile me, so I kept looking through the long, dry years.

So find the thing you love. It doesn’t so much matter what it is. Find the thing you love and throw yourself into it. I found a new geometry; you’ll find something else. Whatever you find will be yours.

For more such insights, log into www.international-maths-challenge.com.

*Credit for article given to Polina Vytnova*


A 41-million-digit prime number is the biggest ever found – but mathematicians’ search for perfection will continue

Imagine a number made up of a vast string of ones: 1111111…111. Specifically, 136,279,841 ones in a row. If we stacked up that many sheets of paper, the resulting tower would stretch into the stratosphere.

If we write this number in a computer in binary form (using only ones and zeroes), it would fill up only about 16 megabytes, no more than a short video clip. Converting to the more familiar way of writing numbers in decimal, this number – it starts out 8,816,943,275… and ends …076,706,219,486,871,551 – would have more than 41 million digits. It would fill 20,000 pages in a book.

Another way to write this number is 2136,279,841 – 1. There are a few special things about it.

First, it’s a prime number (meaning it is only divisible by itself and one). Second, it’s what is called a Mersenne prime (we’ll get to what that means). And third, it is to date the largest prime number ever discovered in a mathematical quest with a history going back more than 2,000 years.

The discovery

The discovery that this number (known as M136279841 for short) is a prime was made on October 12 by Luke Durant, a 36-year-old researcher from San Jose, California. Durant is one of thousands of people working as part of a long-running volunteer prime-hunting effort called the Great Internet Mersenne Prime Search, or GIMPS.

A prime number that is one less than some power of two (or what mathematicians write as 2 p – 1) is called a Mersenne prime, after the French monk Marin Mersenne, who investigated them more than 350 years ago. The first few Mersenne primes are 3, 7, 31 and 127.

The long hunt for Mersenne primes

Mersenne prime numbers have the form 2 p – 1. It would be impossible to visualise the actual numbers as the largest are millions of digits long, but we can plot the exponents – the number of times 2 is multiplied by itself.

Durant made his discovery through a combination of mathematical algorithms, practical engineering, and massive computational power. Where large primes have previously been found using traditional computer processors (CPUs), this discovery is the first to use a different kind of processor called a GPU.

GPUs were originally designed to speed up the rendering of graphics and video, and more recently have been repurposed to mine cryptocurrency and to power AI.

Durant, a former employee of leading GPU maker NVIDIA, used powerful GPUs in the cloud to create a kind of “cloud supercomputer” spanning 17 countries. The lucky GPU was an NVIDIA A100 processor located in Dublin, Ireland.

Primes and perfect numbers

Beyond the thrill of discovery, this advance continues a storyline that goes back millennia. One reason mathematicians are fascinated by Mersenne primes is that they are linked to so-called “perfect” numbers.

A number is perfect if, when you add together all the numbers that properly divide it, they add up to the number itself. For example, six is a perfect number because 6 = 2 × 3 = 1 + 2 + 3. Likewise, 28 = 4 × 7 = 1 + 2 + 4 + 7 + 14.

For every Mersenne prime, there is also an even perfect number. (In one of the oldest unfinished problems in mathematics, it is not known whether there are any odd perfect numbers.)

Perfect numbers have fascinated humans throughout history. For example, the early Hebrews as well as Saint Augustine considered six to be a truly perfect number, as God fashioned the Earth in precisely six days (resting on the seventh).

Practical primes

The study of prime numbers is not just a historical curiosity. Number theory is also essential to modern cryptography. For example, the security of many websites relies upon the inherent difficulty in finding the prime factors of large numbers.

The numbers used in so-called public-key cryptography (of the kind that secures most online activity, for example) are generally only a few hundred decimal digits, which is tiny compared with M136279841.

Nevertheless, the benefits of basic research in number theory – studying the distribution of prime numbers, developing algorithms for testing whether numbers are prime, and finding factors of composite numbers – often have downstream implications in helping to maintain privacy and security in our digital communication.

An endless search

Mersenne primes are rare indeed: the new record is more than 16 million digits larger than the previous one, and is only the 52nd ever discovered.

We know there are infinitely many prime numbers. This was proven by the Greek mathematician Euclid more than 2,000 years ago: if there were only a finite number of primes, we could multiply them all together and add one. The result would not be divisible by any of the primes we have already found, so there must always be at least one more out there.

But we don’t know whether there are infinitely many Mersenne primes – though it has been conjectured that there are. Unfortunately, they are too scarce for our techniques to detect.

For now, the new prime serves as a milestone in human curiosity and a reminder that even in an age dominated by technology, some of the deeper, tantalising secrets in the mathematical universe remain out of reach. The challenge remains, inviting mathematicians and enthusiasts alike to find the hidden patterns in the infinite tapestry of numbers.

And so the (mathematical) search for perfection will continue.

For more such insights, log into www.international-maths-challenge.com.

*Credit for article given to John Voight*


Three letters, one number, a knife and a stone bridge: how a graffitied equation changed mathematical history

On October 16 1843, the Irish mathematician William Rowan Hamilton had an epiphany during a walk alongside Dublin’s Royal Canal. He was so excited he took out his penknife and carved his discovery right then and there on Broome Bridge.

It is the most famous graffiti in mathematical history, but it looks rather unassuming:

i ² = j ² = k ² = ijk = –1

Yet Hamilton’s revelation changed the way mathematicians represent information. And this, in turn, made myriad technical applications simpler – from calculating forces when designing a bridge, an MRI machine or a wind turbine, to programming search engines and orienting a rover on Mars. So, what does this famous graffiti mean?

Rotating objects

The mathematical problem Hamilton was trying to solve was how to represent the relationship between different directions in three-dimensional space. Direction is important in describing forces and velocities, but Hamilton was also interested in 3D rotations.

Mathematicians already knew how to represent the position of an object with coordinates such as x, y and z, but figuring out what happened to these coordinates when you rotated the object required complicated spherical geometry. Hamilton wanted a simpler method.

He was inspired by a remarkable way of representing two-dimensional rotations. The trick was to use what are called “complex numbers”, which have a “real” part and an “imaginary” part. The imaginary part is a multiple of the number i, “the square root of minus one”, which is defined by the equation i ² = –1.

By the early 1800s several mathematicians, including Jean Argand and John Warren, had discovered that a complex number can be represented by a point on a plane. Warren had also shown it was mathematically quite simple to rotate a line through 90° in this new complex plane, like turning a clock hand back from 12.15pm to 12 noon. For this is what happens when you multiply a number by i.

When a complex number is represented as a point on a plane, multiplying the number by i amounts to rotating the corresponding line by 90° anticlockwise. The Conversation, CC BY

Hamilton was mightily impressed by this connection between complex numbers and geometry, and set about trying to do it in three dimensions. He imagined a 3D complex plane, with a second imaginary axis in the direction of a second imaginary number j, perpendicular to the other two axes.

It took him many arduous months to realise that if he wanted to extend the 2D rotational wizardry of multiplication by i he needed four-dimensional complex numbers, with a third imaginary number, k.

In this 4D mathematical space, the k-axis would be perpendicular to the other three. Not only would k be defined by k ² = –1, its definition also needed k = ij = –ji. (Combining these two equations for k gives ijk = –1.)

Putting all this together gives i ² = j ² = k ² = ijk = –1, the revelation that hit Hamilton like a bolt of lightning at Broome Bridge.

Quaternions and vectors

Hamilton called his 4D numbers “quaternions”, and he used them to calculate geometrical rotations in 3D space. This is the kind of rotation used today to move a robot, say, or orient a satellite.

But most of the practical magic comes into it when you consider just the imaginary part of a quaternion. For this is what Hamilton named a “vector”.

A vector encodes two kinds of information at once, most famously the magnitude and direction of a spatial quantity such as force, velocity or relative position. For instance, to represent an object’s position (x, y, z) relative to the “origin” (the zero point of the position axes), Hamilton visualised an arrow pointing from the origin to the object’s location. The arrow represents the “position vector” x i + y j + z k.

This vector’s “components” are the numbers x, y and z – the distance the arrow extends along each of the three axes. (Other vectors would have different components, depending on their magnitudes and units.)

A vector (r) is like an arrow from the point O to the point with coordinates (x, y, z). The Conversation, CC BY

Half a century later, the eccentric English telegrapher Oliver Heaviside helped inaugurate modern vector analysis by replacing Hamilton’s imaginary framework i, j, k with real unit vectors, i, j, k. But either way, the vector’s components stay the same – and therefore the arrow, and the basic rules for multiplying vectors, remain the same, too.

Hamilton defined two ways to multiply vectors together. One produces a number (this is today called the scalar or dot product), and the other produces a vector (known as the vector or cross product). These multiplications crop up today in a multitude of applications, such as the formula for the electromagnetic force that underpins all our electronic devices.

A single mathematical object

Unbeknown to Hamilton, the French mathematician Olinde Rodrigues had come up with a version of these products just three years earlier, in his own work on rotations. But to call Rodrigues’ multiplications the products of vectors is hindsight. It is Hamilton who linked the separate components into a single quantity, the vector.

Everyone else, from Isaac Newton to Rodrigues, had no concept of a single mathematical object unifying the components of a position or a force. (Actually, there was one person who had a similar idea: a self-taught German mathematician named Hermann Grassmann, who independently invented a less transparent vectorial system at the same time as Hamilton.

Hamilton also developed a compact notation to make his equations concise and elegant. He used a Greek letter to denote a quaternion or vector, but today, following Heaviside, it is common to use a boldface Latin letter.

This compact notation changed the way mathematicians represent physical quantities in 3D space.

Take, for example, one of Maxwell’s equations relating the electric and magnetic fields:

∇×E= –∂B/∂t

With just a handful of symbols (we won’t get into the physical meanings of ∂/∂t and ∇ ×), this shows how an electric field vector (E) spreads through space in response to changes in a magnetic field vector (B).

Without vector notation, this would be written as three separate equations (one for each component of B and E) – each one a tangle of coordinates, multiplications and subtractions.

The expanded form of the equation. As you can see, vector notation makes life much simpler. The Conversation, CC BY

The power of perseverance

I chose one of Maxwell’s equations as an example because the quirky Scot James Clerk Maxwell was the first major physicist to recognise the power of compact vector symbolism. Unfortunately, Hamilton didn’t live to see Maxwell’s endorsement. But he never gave up his belief in his new way of representing physical quantities.

Hamilton’s perseverance in the face of mainstream rejection really moved me, when I was researching my book on vectors. He hoped that one day – “never mind when” – he might be thanked for his discovery, but this was not vanity. It was excitement at the possible applications he envisaged.

A plaque on Dublin’s Broome Bridge commemorate’s Hamilton’s flash of insight. Cone83 / Wikimedia, CC BY-SA

He would be over the moon that vectors are so widely used today, and that they can represent digital as well as physical information. But he’d be especially pleased that in programming rotations, quaternions are still often the best choice – as NASA and computer graphics programmers know.

In recognition of Hamilton’s achievements, maths buffs retrace his famous walk every October 16 to celebrate Hamilton Day. But we all use the technological fruits of that unassuming graffiti every single day.

For more such insights, log into www.international-maths-challenge.com.

*Credit for article given to Robyn Arianrhod*


Want to solve a complex problem? Applied math can help

Applied mathematicians use math to model real-world situations. Ariel Skelley/DigitalVision via Getty Images

You can probably think of a time when you’ve used math to solve an everyday problem, such as calculating a tip at a restaurant or determining the square footage of a room. But what role does math play in solving complex problems such as curing a disease?

In my job as an applied mathematician, I use mathematical tools to study and solve complex problems in biology. I have worked on problems involving gene and neural networks such as interactions between cells and decision-making. To do this, I create descriptions of a real-world situation in mathematical language. The act of turning a situation into a mathematical representation is called modeling.

Translating real situations into mathematical terms

If you ever solved an arithmetic problem about the speed of trains or cost of groceries, that’s an example of mathematical modeling. But for more difficult questions, even just writing the real-world scenario as a math problem can be complicated. This process requires a lot of creativity and understanding of the problem at hand and is often the result of applied mathematicians working with scientists in other disciplines.

Applied mathematicians collaborate with scientists in other fields to answer a wide variety of questions. Hinterhaus Productions/DigitalVision via Getty Images

As an example, we could represent a game of Sudoku as a mathematical model. In Sudoku, the player fills empty boxes in a puzzle with numbers between 1 and 9 subject to some rules, such as no repeated numbers in any row or column.

The puzzle begins with some prefilled boxes, and the goal is to figure out which numbers go in the rest of the boxes.

Imagine that a variable, say x, represents the number that goes in one of those empty boxes. We can guarantee that x is between 1 and 9 by saying that x solves the equation (x-1)(x-2) … (x-9)=0. This equation is true only when one of the factors on the left side is zero. Each of the factors on the left side is zero only when x is a number between 1 and 9; for example, (x-1)=0 when x=1. This equation encodes a fact about our game of Sudoku, and we can encode the other features of the game similarly. The resulting model of Sudoku will be a set of equations with 81 variables, one for each box in the puzzle.

Another situation we might model is the concentration of a drug, say aspirin, in a person’s bloodstream. In this case, we would be interested in how the concentration changes as we ingest aspirin and the body metabolizes it. Just like with Sudoku, one can create a set of equations that describe how the concentration of aspirin evolves over time and how additional ingestion affects the dynamics of this medication. In contrast to Sudoku, however, the variables that represent concentrations are not static but rather change over time.

Sudoku is an example of a situation that can be modeled mathematically. Peter Dazeley/The Image Bank via Getty Images

But the act of modeling is not always so straightforward. How would we model diseases such as cancer? Is it enough to model the size and shape of a tumor, or do we need to model every single blood vessel inside the tumor? Every single cell? Every single chemical in each cell? There is much that is unknown about cancer, so how can we model such unknown features? Is it even possible?

Applied mathematicians have to find a balance between models that are realistic enough to be useful and simple enough to be implemented. Building these models may take several years, but in collaboration with experimental scientists, the act of trying to find a model often provides novel insight into the real-world problem.

Mathematical models help find real solutions

After writing a mathematical problem to represent a situation, the second step in the modeling process is to solve the problem.

For Sudoku, we need to solve a collection of equations with 81 variables. For the aspirin example, we need to solve an equation that describes the rate of change of concentrations. This is where all the math that has been and is still being invented comes into play. Areas of pure math such as algebra, analysis, combinatorics and many others can be used – in some cases combined – to solve the complex math problems arising from applications of math to the real world.

The third step of the modeling process consists of translating the mathematical solution into the solution to the applied problem. In the case of Sudoku, the solution to the equations tells us which number should go in each box to solve the puzzle. In the case of aspirin, the solution would be a set of curves that tell us the aspirin concentration in the digestive system and bloodstream. This is how applied mathematics works.

When creating a model isn’t enough

Or is it? While this three-step process is the ideal process of applied math, reality is more complicated. Once I reach the second step where I want the solution of the math problem, very often, if not most of the time, it turns out that no one knows how to solve the math problem in the model. In some cases, the math to study the problem doesn’t even exist.

For example, it is difficult to analyze models of cancer because the interactions between genes, proteins and chemicals are not as straightforward as the relationships between boxes in a game of Sudoku. The main difficulty is that these interactions are “nonlinear,” meaning that the effect of two inputs is not simply the sum of the individual effects. To address this, I have been working on novel ways to study nonlinear systems, such as Boolean network theory and polynomial algebra. With this and traditional approaches, my colleagues and I have studied questions in areas such as decision-making, gene networks, cellular differentiation and limb regeneration.

When approaching unsolved applied math problems, the distinction between applied and pure mathematics often vanishes. Areas that were considered at one time too abstract have been exactly what is needed for modern problems. This highlights the importance of math for all of us; current areas of pure mathematics can become the applied mathematics of tomorrow and be the tools needed for complex, real-world problems.

For more such insights, log into www.international-maths-challenge.com.

*Credit for article given to Alan Veliz-Cuba*