Have you heard of esports? If not, then where have you been? Probably outdoors having fun with friends or loved ones … but I’m here to tell you that you’re missing out on the greatest genre of entertainment this side of a digital screen!
Should you be unaware, esports is essentially a computer game that is played in a competitive setting by the best players in the world – usually in front of a crowd. These games are often streamed on platforms such as Twitch or YouTube to millions of fans. Talking of millions, the best players in the world can earn those kinds of figures. Additionally, the esports scene was valued at $1.81 billion in 2024 and is set to reach $5.88 billion by 2030.
While you might have an image of people just sitting at computers messing around, there is in fact a huge amount of variation and flexibility to these games when played at the top level, and a massive infrastructure of people involved. There are the players, the coaches, the managers and even private chefs and personal trainers! Importantly teams also have analysts to track information about their own teams and also about the other teams as well. Each team plays differently, and each player plays differently. Numerous statistics are tracked during games, both in professional games and the general player base. It’s a huge amount of data to work with – and it’s what this blog will primarily focus on.
Now you might be saying, ‘Ray, how on earth are you going to link this to mathematics?’, and I’m here to tell you ‘By a very delicate thread’ – a trait of all my blogs.
But what I’d like you to consider as you read this, is the incredible number of variables that are being presented. Ones that are constantly at play, ones reactive to other choices, variables within variables … a data smorgasbord!
League of Legends
There is a vast array of games which have their competitive scenes, but for this blog I’m going to stick with one called League of Legends – due to my own knowledge, both in terms of playing (9,210 hours as of writing this) and also watching (since the very first season back in 2011).
In short, League of Legends is a multiplayer online battle arena released in 2009. In the main game mode two teams of five battle against each other to destroy their opponent’s ‘Nexus’ (their base). On average a game takes 25–40 minutes.
It’d be easy to think that this is just a simple 5v5 game, so you just jump into a game and get killing. But the game starts before … well, before the game starts.
The game and its variables
Before the game clock can even reach 00:01, champion selection must take place, a process which takes around 5 minutes by itself. This is where each player decides which champion they are playing in the game – a very collaborative process between all the players of the team, and the coaches. The aim is to have a well-rounded team composition built of champions that each offer something different.
In the below sections, variables 1–4 will cover this phase, while 5–7 cover aspects found during actual game play.
While we progress through these variables, I’ll try to inform you of numerical variations that are found within each one. Keep these in mind as you progress through to try and grasp the scale of knowledge required, and the breadth of data analytics required to strategise against your opponents.
Variable 1: The champions
There are currently 171 unique champions to choose from, and each one has their own abilities; each champion has four abilities as standard, though a select few have a couple more or a couple less. Each champion then has their own values for stats which encompass things such as health, attack speed, armour, magic resist, attack range, etc. Additionally, each champion has a unique passive effect that provides a continued effect throughout the game.For instance, a simple passive might be ‘hit the same champion 3 times within X seconds to cause more damage’.
Champions are generally grouped into six categories:
- Marksmen buy items which improve their auto attack damage (a basic attack).
- Supports focus on items that improve their health and defences to be a frontline (someone who positions closest to the enemy team during fights in order to protect teammates and to create and engage fights), or items which help them to heal, shield, or defend others.
- Fighters look to buy items which help them do damage, but also to keep themselves healthy by healing themselves for a % of damage caused (for example). They tend to spend a lot of the game fighting solo against another solo opponent.
- Mages build items that improve their ability power, so their abilities do more damage.
- Assassins use items that help them kill squishy (vulnerable) champions quickly, known for producing quick burst damage.
- Tanks build items that give them massive improvements to health and defences.
They can then be grouped further by their effectiveness during the periods of the game:
- Early game: Strong during the early period, known as the ‘laning phase’, where there is fighting in small skirmishes, generally in equal numbers.
- Mid game: Period where teams start fighting for early objectives on the map; the start of grouping up as groups of 4 or 5.
- Late game: This is where most champions are now at or close to max level with their core items, and there are full-on 5v5 team fights.
The developer of League of Legends, Riot Games, works constantly to try and balance champions so all are viable. Taking into consideration the data from professional and general games, they adjust them to try and encourage an average 50% win rate for each. However, this doesn’t mean all champions are good against each other. For instance, Champion A might be strong against Champion B, but they get stomped by Champion C, and Champion C gets destroyed by Champion B. This comes into play later in the pick and ban phase, variable 3.
Additionally, champion popularity is also taken into account when considering balance changes. Win rates can be tied to champion usage and the skill of those playing; for instance, a champion might have a low win rate, but mainly due to being highly played by users who (quite frankly) are terrible.
Variables to note
- 171 champions
- 5 abilities (includes passive and ignores non-standard)
- 10 stat ranges per champion
- 6 champion categories
Variable 2: The map and player roles
The map the game is played on is square, and is split into 3 main lanes: Top, Mid and Bot. It is split diagonally (top left to bottom right) by the River – with the rest of the space in-between the lanes being the Jungle. The half of the square below and to the left of the River is the Blue team’s side, and the half above and to the right of the River is the Red team’s side.
In a normal game, side selection is random, whereas in the professional scene the team with the highest seed coming into the game generally gets to choose which side they are.
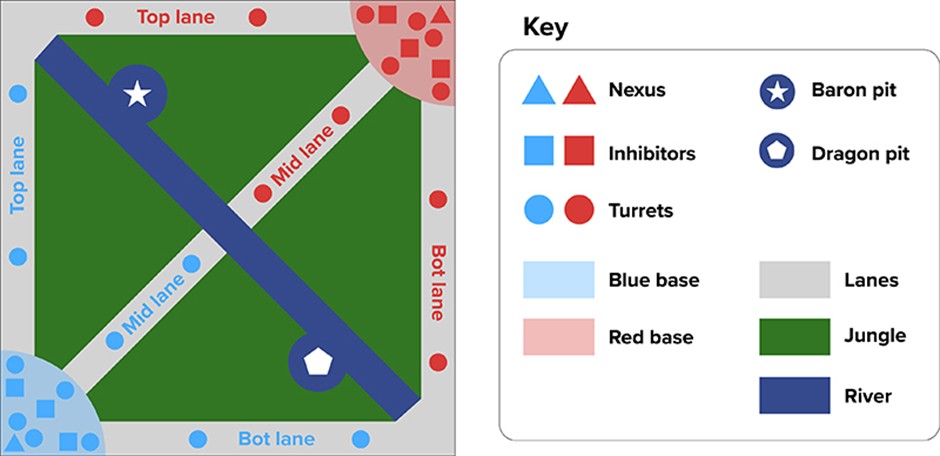
Figure 1. Summoner’s Rift, the map on which a standard game of League of Legends is played. Image adapted under Creative Commons License CC BY-SA 3.0.
The five players per team are distributed into the following positions:
- Top laner
- Jungler
- Mid laner
- Bot laner
- Support (who spends most of their time with the bot laner, but can roam to assist the other roles)
Champions tend to excel when played in a certain role, however you can technically play everyone everywhere, though you might get flamed (insulted, harassed, etc.) or called a griefer (someone purposely playing the game in a negative way).
In the professional game, each player is an expert in their role, and how it should be played, along with the champions that are suited to that lane. For the sake of simplicity, we’ll divide the total champion numbers by 5 to say that means each player is an expert in 34.2 champions. I refuse to round up or down.
While you might think, ‘Well that map sounds equal and balanced’, it turns out, you are super wrong, and you should feel bad. In the professional scene, Blue side generally has a win rate between 51–52%, although in last year’s tournament, Worlds 2024, the Blue win rate sky rocketed to 60% during the early stages! In the previous Worlds tournament, it was nearly 80%!
The map is mostly a flipped reflection, i.e. Team 1 top jungle matches Team 2 bottom jungle. While this seems fair, it does actually give blue slide a few advantages, such as easier access to the Baron Pit (the Baron is explained later) but generally it is also just a more natural way to play – going bottom left, to top right. Top right to bottom left makes for a more awkward process, especially when the game’s interface is mostly along the bottom edge covering a good portion of visibility.
Variables to note
- 2 sides
- 3 lanes + jungle
- 5 roles
Variable 3: The pick and ban phase
In the competitive scene, the order players choose a champion is very specific – and also involves banning champions out, which means both teams can’t play that champion. This is a good way to remove champions who perhaps are:
- too strong, so better if no-one plays it;
- a strong champion that someone on your team doesn’t play, so better to remove it; or
- is played by someone on the opposite team as an OTP (one trick pony), or the opponent is known for being able to affect the game strongly on that champion.
The order starts with the first ban phase:
- Blue Ban 1
Red Ban 1
Blue Ban 2
Red Ban 2
Blue Ban 3
Red Ban 3
Then the first pick phase:
- Blue Pick 1
Red Pick 1
Red Pick 2
Blue Pick 2
Blue Pick 3
Red Pick 3
Followed by the second ban phase:
- Red Ban 4
Blue Ban 4
Red Ban 5
Blue Ban 5
And finally, the second pick phase:
- Red Pick 4
Blue Pick 4
Blue Pick 5
Red Pick 5
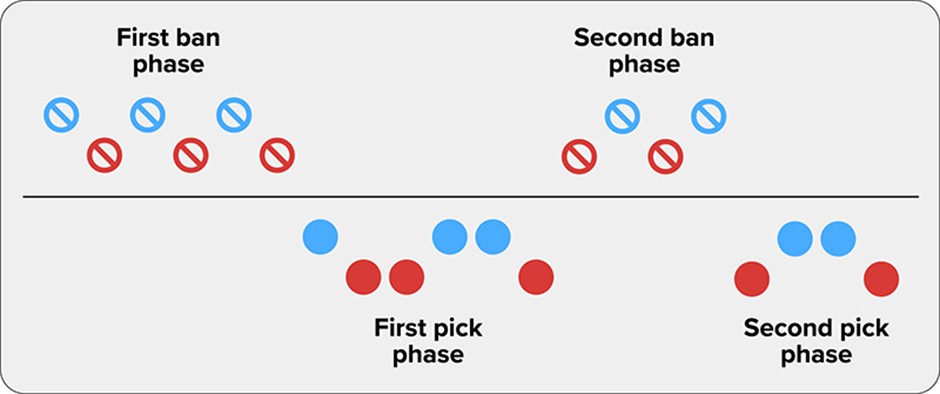
Figure 2. The pick/ban order during champion selection. Image adapted under Creative Commons License CC BY-SA 3.0.
As you can see the pick orders are staggered; this is to try and ensure teams don’t become too unbalanced. Blue team get the opportunity to choose the strongest champion left in the pool; however Red team then gets to pick the next two. Depending on the meta (Most Effective Tactics Available), a team might prefer to be on blue or red side, i.e. if there is a singular strong champion who usually gets past the ban phase, you might want to ensure the chance to have them, thus pick Blue. Or if there is a range of strong picks, especially a pairing which works really well – you’d choose Red. As mentioned in Variable 2, Blue win rate is generally an advantage – one factor is due to a few champions who are very strong right now (meta picks), so Blue side tends to ban most of these out in the hope of being able to pick a remaining one.
The pick and ban structure also allows certain strategies.
Counter picking
In the pick phase, there is a tactic known as counter picking. Essentially, some champions are strong against certain other champions – or in turn weak against others. Therefore, you try to choose champions who are strong against the ones your opponents have chosen. The staggered order helps to ensure the team who picks second doesn’t get all the counter picks. The next strategy is also used to help with this …
Flex picking
As mentioned previously, while champions tend to excel in one role there are some which are strong in multiple roles, or at least capable enough to hold their own in them. Sometimes it becomes an advantage to choose one of these flex picks, rather than a strong meta champion in order to avoid being counter picked. You then get to decide when to reveal where this champion will go. It has been a strong tactic in the past to choose three flex picks in the first pick phase in order to really stump the opposing team. However, the negative of this tactic is that it requires multiple players to be competent at playing these champions.
Role banning
For example, if you are playing Blue side, and your Top Laner has already chosen their champion in the first pick phase, but the Red side’s Top Laner hasn’t chosen theirs, then you might choose to prioritise banning champions often played in Top during your second ban phase, to reduce the pool of viable Top Laners.
At the end of this, you’ll have two teams each with five champions. But it’s not just about choosing five strong champions and calling it a day: it’s about composition1 as well, ensuring that your team of five don’t all have the same strength, but instead work together2 to create a strong team. A team of five Mages, for example, wouldn’t work against a properly composed and balanced team which includes a Tank, Support and a Marksman. There is a bit of flexibility in how creative a team can be, but sticking to a well-rounded formula tends to lead to success.
So, is it game time yet? No, don’t be silly.
Variables to note
- LOTS! Let’s just throw a non-numerical value here … X
Variable 4: Runes, shards and summoner spells
In short, runes are extra effects you can assign to your champion; this is done during the Pick and Ban phase before the game starts.
Runes are split into 5 different categories, which are made from 4 different tier levels, the final tier being an ultimate rune.
- You have a primary category, where you can choose one from each tier – so 4 in total.
- You then have a secondary category, where you choose one from 3 tiers (no ultimate) – so 3 in total.
In total, there are 63 different runes – which all do different things!
Shards are another system, but much simpler. Three categories, each with 3 different options to choose from, which give you extra stats in areas such as health, cooldown reduction, adaptive power (which, depending on your champion, is either attack damage or ability power), etc.
Then there are summoner spells. These are extra skills players can take to help them perform. There are 9 different spells to choose from (although one is only for the Jungler as it helps them kill Jungle creeps) and each player can only have two.
Variables to note
- 5 rune categories with 63 runes in total, from which players can choose 7: 4 from their primary category and 3 from their secondary category
- 3 rune shard categories with 9 rune shards in total
- 9 summoner spells with a choice of 2 for each player
Lovely… so now the match can actually start. Yes!
And now we can go ‘no brain mode’ and enjoy the game right? Nein.
Variable 5: Items
In the game one of the main priorities is to earn gold, in order to buy items. This can be done in numerous ways, but the main ones are:
- Killing enemy champions
- Killing enemy minions, which are NPCs (non-playable characters) that march down the lanes
- Killing jungle minions (also NPCs)
- Taking turrets (fortifications which protect the lanes, each team has 3 per lane)
At the start of the game each player has 500 gold from which to buy a starter item. There are approximately 8 different starter items, each has its own stats and they are in certain cases special effects.
In the early game players buy item components; there are approximately 15 Basic Items which can make 48 Epic Items. These also have their own stats and in certain cases special effects.
And yep, that’s right – Basic and Epic item components can then be combined to create completed items classed as Legendary. There are about 103 of these, and by the end game each champion should have 5 of these. You can’t have the same item on a champion more than once, and some completed Items make it impossible to buy some others (if they are for a similar purpose, for instance).
All done? You know better than that.
Each champion also buys a pair of boots – which start as a basic pair, which are then upgraded to one of 7 variations.
Ok so now we…. Nope still not done, be quiet.
There’s a champion in the game called Ornn, who has a passive which allows him to upgrade a single item for each of his allies. There are 28 of those.
AND then there’s… why? Why are there all these items?
Well as you can imagine, each item has a different purpose. Some just purely boost damage, whether that’s attack damage, or ability power. Some improve your defences, things like health, armour or magic resist while some help you apply better shields or healing to your allies. Which ones you buy depends on the champion you play, AND which champions you are playing against. But also, players will have their own favourites of items they prefer to use – even if the statistics say not to, alas you can’t remove the human ego out of the equation!
Variables to note
- 6 item slots available for each champion
- 100+ Legendary items (plus Ornn variables if he’s selected as a champion)
Variable 6: Objectives
As mentioned previously – the aim of the game is to destroy your opponent’s Nexus. However, that is the final objective. To get there, you need to do objectives. Some are required; some are additional to help boost your chances of winning.
The main objectives are:
- Turrets: Each lane has 3 turrets. To get to the Nexus you need to at least destroy all 3 in a single lane. However, destroying more is beneficial for getting gold and improving your map state (i.e. having control of an area).
- Inhibitor: After destroying the 3rd turret in one lane, you have access to the opponent’s inhibitor for that lane. Destroying this allows your lane to spawn stronger minions.
Additional objectives which help your chances are:
- Dragons: Dragons spawn during the game; they can be four different types. The first two will be random types, but the following dragons will all be the same type and eventually become the ‘Soul’. The souls of the different types of dragon (Ocean, Cloud, Hextech and Infernal) offer different benefits. Whichever team gets four dragon kills (of any type combination) in total gets a dragon’s soul which offers a strong passive for the rest of the game. Oh, and depending on which dragon’s soul it is also changes the map in different ways.
- Grubs: Once per game, three small grub monsters spawn at the same time. Killing these will give a buff (enhancement) to your team which helps with the destruction of turrets.
- Herald: Herald is a large monster that spawns a while after the grubs, and removes the grubs if they’ve not been taken by this point. Should your team kill it, you can spawn it as an ally to help you easily destroy turrets.
- Baron: Baron spawns 25 minutes into the game. Should your team kill it, it gives each player alive at the time a temporary power boost, and the ability to power up your lane minions, to help you destroy turrets.
- Elder Dragon: After four dragons have been killed, the next dragon to spawn is Elder Dragon. Should your team kill this, it gives you a temporary power that will execute your opponents should you take them down to 20% health. This is a late game buff to help your team end the game.
The final objective:
- Nexus: Each team has a Nexus. Destroying your opponent’s Nexus ends the game in victory.
Variables to note
- Which dragon becomes soul, and which team gets it
- Which team gets grubs and how many
- Which team gets Herald
- Which team gets Barons or Elder Dragons
Variable 7: The game’s end(?)
It’s worth briefly mentioning, that while games in the main seasons usually comprise single games, in competitive tournaments (like the prementioned Worlds) there are also matches with best of three games, and best of five games. So, all of this happens over and over again! Additionally in subsequent games, the choice of side selection is decided by whichever team lost the previous game which means strategies change each time!
A recent introduction to the league is also ‘Fearless Draft’. In this system, during matches which span multiple games, whichever champions are played in Game 1, for instance, can’t be played in the later games. This creates a whole new dynamic and forces players to improve their pool of champions even further – along with making viewing more exciting and varied.
Variables to note
- You win or you lose
- Side selection for subsequent games
Disclaimer
There are further variables which could be discussed too, but the ones above are perhaps the most crucial to the standard gameplay.
The data
So here we are, at the crux of it all. Seven main variables, each with their own array of potential options, values and outcomes to take into consideration. It’s a swirling storm of statistics, strategy, psychology, and probability – like designing the world’s most complex game of rock, paper, scissors, but with 171 hands and a shifting rulebook.
Something that should be as simple as ‘win or lose’ is instead a story of data, and the integration of that data with player experience and knowledge to forge a path towards victory.
What fascinates me most is not just the numbers, but how those involved interpret them, bend them, and sometimes defy them, as with all sports – sometimes the better team, playing on the blue side and ahead for most the game, can lose. The data might suggest one path to victory, but the human element of intuition, creativity and stubbornness can rewrite the script entirely.
If you’re a mathematician, a gamer, or just someone curious about how numbers shape the world, I hope this blog has offered a glimpse into the beautiful chaos of esports. And maybe, just maybe, next time you hear someone mention League of Legends, you’ll see more than just a game – you’ll see a living, breathing equation in motion.
For more such insights, log into www.international-maths-challenge.com.
*Credit for article given to Ray Knight*