How science, math, and tech can propel swimmers to new heights

One hundred years ago, in the 1924 Paris Olympics, American Johnny Weissmuller won the men’s 100m freestyle with a time of 59 seconds. Nearly 100 years later, in the most recent Olympics, the delayed 2020 Games in Tokyo, Caeleb Dressel took home the same event with a time that was 12 seconds faster than Weissmuller’s.

Swimming times across the board have become much faster over the past century, a result of several factors, including innovations in training, recovery strategy, nutrition, and some equipment advances.

One component in the improvement in swimming performances over the years is the role of biomechanics—that is, how swimmers optimize their stroke, whether it’s the backstroke, breaststroke, butterfly, or freestyle.

Swimmers for decades have experimented with different techniques to gain an edge over their competitors. But in more recent years, the application of mathematics and science principles as well as the use of wearable sensor technology in training regimens has allowed some athletes to elevate their performances to new heights, including members of the University of Virginia’s swim team.


In a new research paper, a UVA professor who introduced these concepts and methods to the team and some of the swimmers who have embraced this novel approach to training lay out how the use of data is helping to transform how competitive swimmers become elite. The paper is published in The Mathematical Intelligencer journal.

‘Swimming in data’

Ken Ono thought his time working with swim teams was over. Ono—a UVA mathematics professor, professor of data science by courtesy, and STEM advisor to the University provost—had spent years working with competitive swimmers, first during his time at Emory University in Atlanta and then with other college teams, including Olympians, over the years.

However, he didn’t plan to continue that aspect of his work when he arrived at UVA in 2019. But after a meeting with Todd DeSorbo, who took over the UVA swim program in 2017, Ono soon found himself once again working closely with athletes, beginning his work as a consultant for the team during the 2020-21 season. The UVA women’s swim team would win their first of four consecutive national championships that year.

“One of the things that WElike quite a bit about this work is that swimming is crazy hard,” Ono said. “We were never meant to be swimmers, and it is both an athletic challenge as well as a scientific challenge—it has it all.”

Last fall, following a suggestion from DeSorbo, Ono offered a class that outlined the science-focused approach to improving swimming performances that had proven so successful at UVA, but he wanted to make sure there were no misconceptions about the seriousness of the material.

“We don’t want people thinking that it’s a cupcake course that’s offered for the swimmers,” Ono said.

So, Ono teamed up with UVA students Kate Douglass, August Lamb, and Will Tenpas, as well as MIT graduate student Jerry Lu, who had worked with Ono and the UVA swim team while an undergraduate at the University, to produce a paper that covered the key elements of the class and Ono’s work with swimmers.

Tenpas and Lamb both recently completed the residential master’s program at the School of Data Science as well as their careers as competitive collegiate swimmers. Douglass, who finished her UVA swim career in 2023 as one of the most decorated swimmers in NCAA history, is a graduate student in statistics at the University and is set to compete in the Paris Olympics after winning a bronze medal in the 2020 games.

The group drafted the paper, which they titled “Swimming in Data,” over the course of two months, and it was quickly accepted by The Mathematical Intelligencer. There, Ono said, it has become one of the most-read papers on a STEM subject since tracking began. In July, a version of the paper will also be published in Scientific American.

“It seems to have taken off,” Ono said.

The impact of digital twins

After outlining the evolution of swimming over the past 100 years, the paper explains how an understanding of math and physics, combined with the use of technology to acquire individual-level data, can help maximize performances.

Essential to understanding the scientific principles involved with the swimming stroke, the paper says, are Newton’s laws of motion. The laws—which cover inertia, the idea that acceleration depends on an object’s mass and the amount of force applied, and the principle that an action exerted by an object on another elicits an equal and opposite reaction—help simplify how one should think about the many biomechanical factors involved with swimming, according to Tenpas.

“There are all sorts of flexibility limitations. You have water moving at you, you have wakes, you have currents—it’s easy to kind of get paralyzed by the number of factors,” said Tenpas, who after four years at Duke, where he studied mechanical engineering, enrolled in UVA’s data science program and joined the swim team with a fifth year of eligibility.

“WEthink having Newton’s laws is nice as it gives you this baseline we can all agree on,” he added.

It’s a way to understand pool mechanics given the counterintuitive motion swimmers must use to propel themselves forward, according to Ono.

“The reason that we go to great extent to recall Newton’s laws of motion is so that we can break down the factors that matter when you test a swimmer,” he said.

To conduct these tests, Ono and his team use sensors that can be placed on swimmers’ wrists, ankles, or backs to gather acceleration data, measured as inertial measurement units. That information is then used to generate what are called digital twins, which precisely replicate a swimmer’s movements.

These twins reveal strengths and weaknesses, allowing Ono and the coaching staff to make recommendations on technique and strategy—such as how to reduce drag force, a swimmer’s true opponent—that will result in immediate improvement. In fact, through the analysis of data and the use of Newton’s laws, it is possible to make an accurate prediction about how much time a swimmer can save by making a given adjustment.

Lamb, who swam for UVA for five years while a computer science undergrad, then as a data science master’s student, likened digital twins to a feature in the popular Nintendo game Mario Kart where you can race against a ghost version of yourself.

“Being able to have this resource where you can test for one month and then spend a month or two making that adjustment and then test again and see what the difference is—it’s an incredibly valuable resource,” he said.

To understand the potential of digital twins, one need only look at the example of Douglass, one of the co-authors, who is cited in the paper.

A flaw was identified in her head position in the 200m breaststroke. Using her digital twin, Ono and the coaching staff were able to quantify how much time she could save per streamline glide by making a modification, given her obvious talent and aerobic capacity. She did, and the results were remarkable. In November 2020, when her technique was tested, the 200m breaststroke wasn’t even on her event list. Three years later, she held the American record.

‘Everyone’s doing it now’

Swimming will be front and center in the national consciousness this summer. First, the U.S. Olympic Team Trials will be held in Indianapolis in June, leading up to the Paris Olympics in July and August, where DeSorbo, UVA’s coach who embraced Ono’s data-driven strategic advice, will lead the women’s team.

Many aspiring swimmers will undoubtedly be watching over the coming weeks, wondering how they might realize their full athletic potential at whatever level that might be.

For those who have access to technology and data about their technique, Tenpas encourages young swimmers to take advantage.

He noted the significant amount of time a swimmer must put in to reach the highest levels of the sport, estimating that he had been swimming six times per week since he was 12 years old.

“If you’re going to put all of this work in, at least do it smart,” Tenpas said.

At the same time, Lamb urged young swimmers who may not yet have access to this technology to not lose faith in their potential to improve.

“While this is an incredibly useful tool to make improvements to your technique and to your stroke, it’s not the end all, be all,” he said.

“There are so many different ways to make improvements, and we’re hopeful that this will become more accessible as time goes on,” Lamb said of the data methods used at UVA.

As for where this is all going, with the rapidly expanding use and availability of data and wearable technology, Ono thinks his scientific approach to crafting swimming strategies will soon be the norm.

“We think five years from now, our story won’t be a story. It’ll be, “Oh, everyone’s doing it now,'” he said.

For more such insights, log into our website https://international-maths-challenge.com

Credit of the article given to Cooper Allen, University of Virginia


A surprising result for a group’s optimal path to cooperation

What is the best way for a group of individuals to cooperate? This is a longstanding question with roots in game theory, a branch of science which uses mathematical models of how individuals should best strategize for the optimal result.

A simple example is the prisoner’s dilemma: Two people are arrested for an alleged bank robbery. The police take them downtown and place them in individual, isolated interrogation rooms.

The police admit they don’t have enough evidence to convict them both, and give each the same option: if he confesses and his partner does not, they will release the confessor and convict the other of the serious charge of bank robbery. But if one does not confess and the other does, the first will get a lengthy prison sentence and the other will be released. If both confess, they will both be put away for many years. If neither confesses, they will be arraigned on a lesser charge of gun possession.

What should each do to minimize their time in jail? Does an individual stay silent, trusting his partner to do the same and accept a shorter prison sentence? Or does he confess, hoping the other stays silent. But what if the other confesses too? It is an unenviable position.

There is no correct solution to the prisoner’s dilemma. Other similar problems are the game of chicken, where each driver races towards the other, risking a head-on crash, or swerving away at the last minute and risking humiliation—being called “chicken” for a lack of courage. Many other simple games exist.

Now imagine a group—they may be people, or they may be cellular organisms of some sort. What kind of cooperation gives the optimal result, when each individual is connected to some others and pays a cost (money, energy, time) to create a result that benefits all? It’s a given that individuals are selfish and act in their own best interests, but we also know that cooperation can result in a better outcome for all. Will any take the risk, or look out only for themselves?

A long-standing result is that, in a homogeneous network where all individuals have the same number of neighbours, cooperation is favoured if the ratio between the benefit provided by a cooperator and their associated cost paid exceeds the average number of neighbours.

But people are not homogeneous, they’re heterogeneous, and they don’t usually have the same number of links to neighbours as does everyone else or change their strategy at the same rates.

It is also known that allowing each individual to update their strategy at exactly the same time, such as immediately mimicking their neighbour, significantly alters the evolution of cooperation. Previous investigations have reported that pervasive heterogeneous individual connections hinder cooperation when it’s assumed that individuals update their strategies at identical rates.

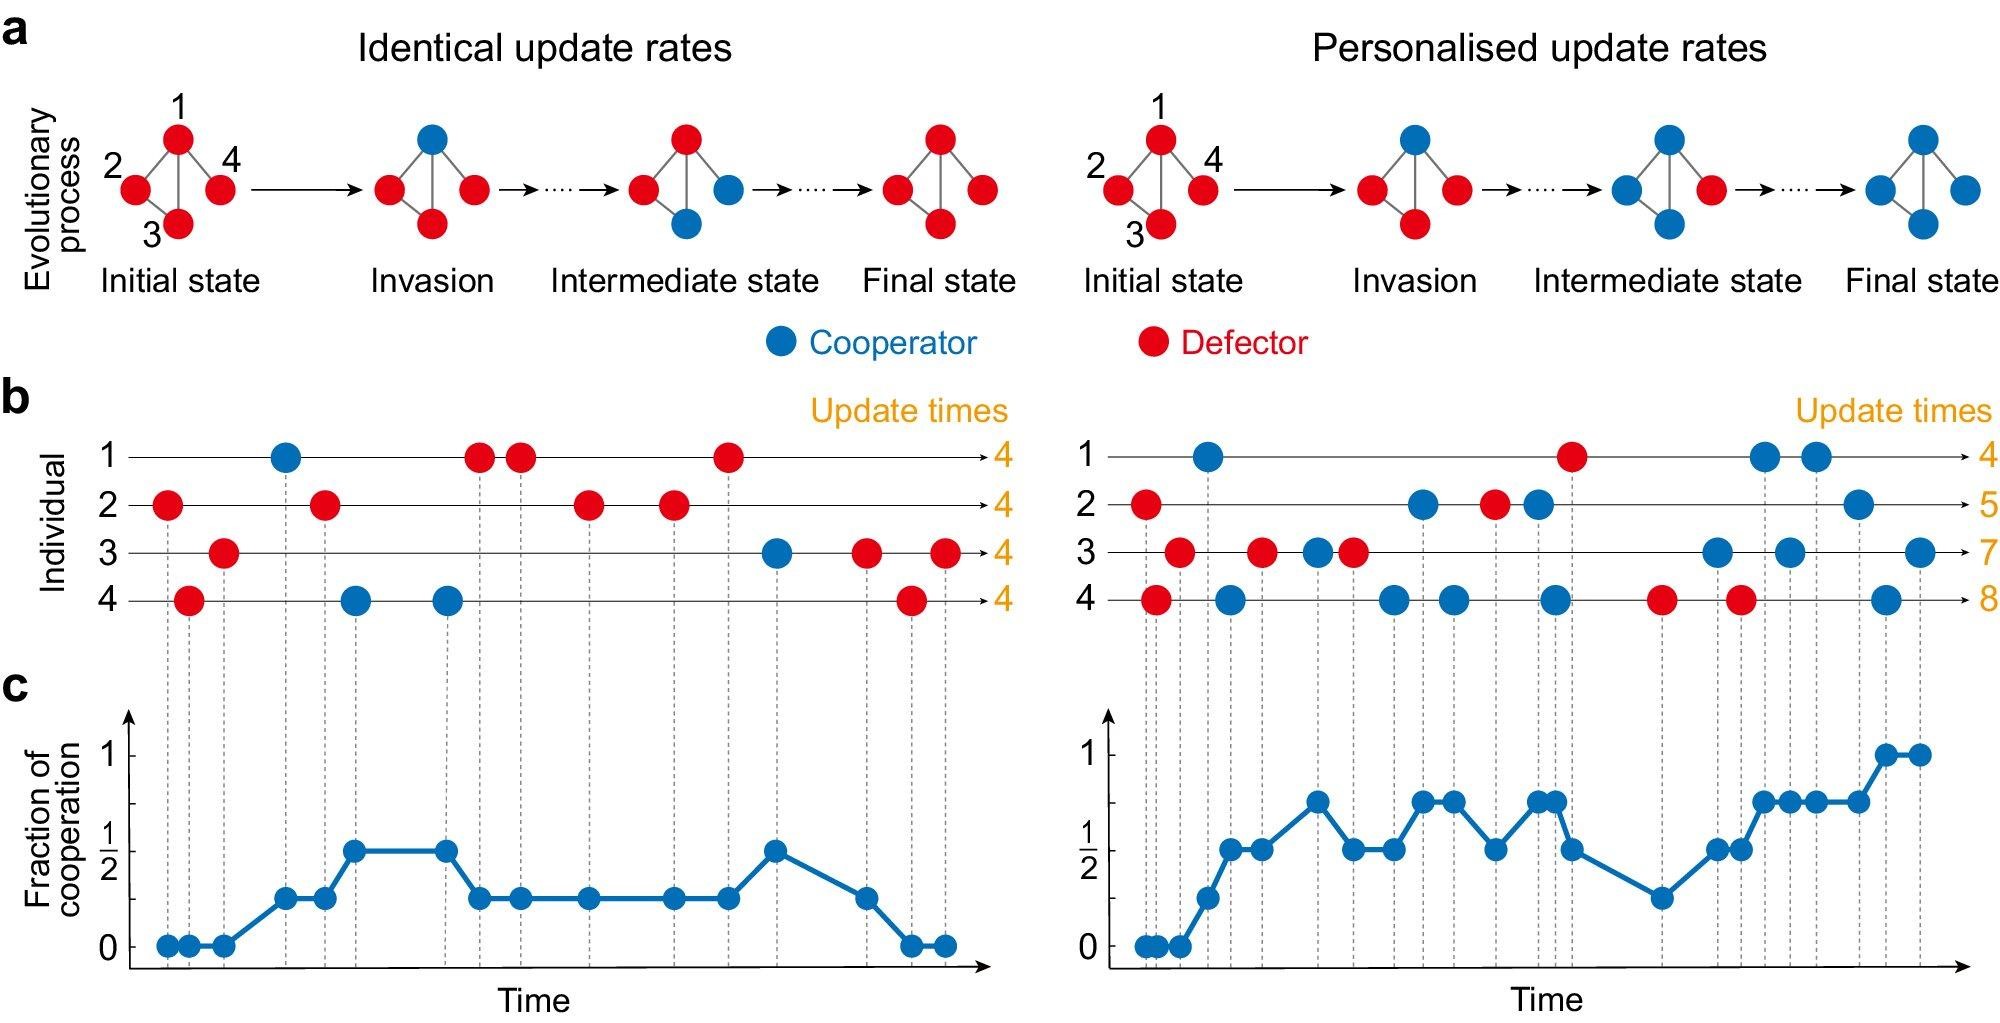
Now a group of researchers located in China, Canada and the US have found a surprising result: when individuals’ strategy update rates vary inversely with their number of connections, heterogeneous connections outperform homogeneous ones in promoting cooperation. The study is published in the journal Nature Communications.

“How to analyse the quantitative impact of the prevalent heterogeneous network structures on the emergence of group optimal strategies is a long-standing open question that has attracted much attention,” said Aming Li, a co-author and Assistant Professor in Dynamics and Control at Peking University.

Li’s team solved the problem by analytical calculations backed up by computer simulations, to find the fundamental rule for maintaining collective cooperation: “The nodes with substantial connections within the complex system should update their strategies infrequently,” he says. That is, individual strategy update rates should vary inversely with the number of connections they have in the network. In this way, a network with heterogeneous connections between individuals outperforms a network with homogeneous connections in promoting cooperation.

The team has also developed an algorithm that most efficiently finds the optimal strategy update rates that brings about the group’s optimal strategies, which they call OptUpRat. This algorithm helps collective utility in groups and, Li says, “is also essential in developing robotic collaborative systems.” The finding will be useful to researchers in such multidisciplinary fields as cybernetics, artificial intelligence, systems science, game theory and network science.

“We believe that utilizing AI-related techniques to optimize individual decisions and drive collective intelligence will be the next research hotspot.”

For more such insights, log into our website https://international-maths-challenge.com

Credit of the article given to David Appell , Phys.org


The Monty Hall Problem Shows How Tricky Judging The Odds Can Be

Calculating probabilities can be complicated, as this classic “what’s behind the doors” problem shows, says Peter Rowlett.

Calculating probabilities can be tricky, with subtle changes in context giving quite different results. I was reminded of this recently after setting BrainTwister #10 for New Scientist readers, which was about the odds of seating two pairs of people adjacently in a row of 22 chairs.

Several readers wrote to say my solution was wrong. I had figured out all the possible seating arrangements and counted the ones that had the two groups adjacent. The readers, meanwhile, seated one pair first and then counted the ways of seating the second pair adjacently. Neither approach was wrong, depending on how you read the question.

This subtlety with probability is illustrated nicely by the Monty Hall problem, which is based on the long-running US game show Let’s Make a Deal. A contestant tries to guess which of three doors conceals a big prize. They guess at random, with ⅓ probability of finding the prize. In the puzzle, host Monty Hall doesn’t open the chosen door. Instead, he opens one of the other doors to reveal a “zonk”, an item of little value. He then offers the contestant the opportunity to switch to the remaining door or stick with their first choice.

Hall said in 1991 that the game is designed so contestants make the mistaken assumption that, since there are now two choices, their ⅓ probability has increased to ½. This, combined with a psychological preference to avoid giving up a prize already won, means people tend to stick

Marilyn vos Savant published the problem in her column in Parade magazine in 1990 along with the answer that you are much more likely to win if you switch. She received thousands of letters, many from mathematicians and scientists, telling her she was wrong.

Imagine the host opened one of the unchosen doors at random: one-third of the time, they would reveal the prize. But in the remaining cases, the prize would be behind the chosen door half the time, for a probability of ½.

But that isn’t really the problem being solved. The missing piece of information is that the host knows where the prize is, and of course the show must go on. There is a ⅓ probability that the prize is behind the chosen door, and therefore a ⅔ probability that it is behind one of the other two. Being shown a zonk behind one of the other two hasn’t changed this set-up – the door chosen still has a probability of ⅓, so the other door carries a ⅔ probability. You should switch.

Probability problems depend on the precise question more than people realise. This is why it might seem surprising when you run into a friend, because you aren’t considering the number of people you walked past and how many friends you might see. And for scientists, it is why they have to be very careful about what their evidence is really telling them.

For more such insights, log into www.international-maths-challenge.com.

*Credit for article given to Peter Rowlett*


New Mathematical Proof Helps to Solve Equations with Random Components

Whether it’s physical phenomena, share prices or climate models—many dynamic processes in our world can be described mathematically with the aid of partial differential equations. Thanks to stochastics—an area of mathematics which deals with probabilities—this is even possible when randomness plays a role in these processes.

Something researchers have been working on for some decades now are so-called stochastic partial differential equations. Working together with other researchers, Dr. Markus Tempelmayr at the Cluster of Excellence Mathematics Münster at the University of Münster has found a method which helps to solve a certain class of such equations.

The results have been published in the journal Inventiones mathematicae.

The basis for their work is a theory by Prof. Martin Hairer, recipient of the Fields Medal, developed in 2014 with international colleagues. It is seen as a great breakthrough in the research field of singular stochastic partial differential equations. “Up to then,” Tempelmayr explains, “it was something of a mystery how to solve these equations. The new theory has provided a complete ‘toolbox,’ so to speak, on how such equations can be tackled.”

The problem, Tempelmayr continues, is that the theory is relatively complex, with the result that applying the ‘toolbox’ and adapting it to other situations is sometimes difficult.

“So, in our work, we looked at aspects of the ‘toolbox’ from a different perspective and found and proved a method which can be used more easily and flexibly.”

The study, in which Tempelmayr was involved as a doctoral student under Prof. Felix Otto at the Max Planck Institute for Mathematics in the Sciences, published in 2021 as a pre-print. Since then, several research groups have successfully applied this alternative approach in their research work.

Stochastic partial differential equations can be used to model a wide range of dynamic processes, for example, the surface growth of bacteria, the evolution of thin liquid films, or interacting particle models in magnetism. However, these concrete areas of application play no role in basic research in mathematics as, irrespective of them, it is always the same class of equations which is involved.

The mathematicians are concentrating on solving the equations in spite of the stochastic terms and the resulting challenges such as overlapping frequencies which lead to resonances.

Various techniques are used for this purpose. In Hairer’s theory, methods are used which result in illustrative tree diagrams. “Here, tools are applied from the fields of stochastic analysis, algebra and combinatorics,” explains Tempelmayr. He and his colleagues selected, rather, an analytical approach. What interests them in particular is the question of how the solution of the equation changes if the underlying stochastic process is changed slightly.

The approach they took was not to tackle the solution of complicated stochastic partial differential equations directly, but, instead, to solve many different simpler equations and prove certain statements about them.

“The solutions of the simple equations can then be combined—simply added up, so to speak—to arrive at a solution for the complicated equation which we’re actually interested in.” This knowledge is something which is used by other research groups who themselves work with other methods.

For more insights like this, visit our website at www.international-maths-challenge.com.

Credit of the article given to Kathrin Kottke, University of Münster


How the 18th-century ‘probability revolution’ fueled the casino gambling craze

The first commercial gambling operations emerged, coincidentally or not, at the same time as the study of mathematical probability in the mid-1600s.

By the early 1700s, commercial gambling operations were widespread in European cities such as London and Paris. But in many of the games that were offered, players faced steep odds.

Then, in 1713, the brothers Johann and Jacob Bernoulli proved their “Golden Theorem,” known now as the law of large numbers or long averages.

But gambling entrepreneurs were slow to embrace this theorem, which showed how it could actually be an advantage for the house to have a smaller edge over a larger one.

The book “The Gambling Century: Commercial Gaming in Britain from Restoration to Regency,” WEexplain how it took government efforts to ban and regulate betting for gambling operators to finally understand just how much money could be made off a miniscule house edge.

The illusion of even odds in games that were the ancestors of roulette and blackjack proved immensely profitable, sparking a “probability revolution” that transformed gambling in Britain and beyond.

A new theorem points to sneaky big profits

The law of large numbers refers to events governed by chance.

When you flip a coin, for example, you have a 50% – or “even money” – chance of getting heads or tails. Were you to flip a coin 10 times, it’s quite possible that heads will turn up seven times and tails three times. But after 100, or 1000, or 10,000 flips, the ratio of “heads” to “tails” will be closer and closer to the mathematical “mean of probability” – that is, half heads and half tails.

Mathematicians Johann and Jacob Bernoulli developed what’s known today as the law of large numbers. Oxford Science Archive/Print Collector via Getty Images

This principle was popularized by writers such as Abraham De Moivre, who applied them to games of chance.

De Moivre explained how, over time, someone with even the smallest statistical “edge” would eventually win almost all of the money that was staked.

This is what happens in roulette. The game has 36 numbers, 18 of which are red and 18 of which are black. However, there are also two green house numbers – “0” and “00” – which, if the ball lands on them, means that the house can take everyone’s wager. This gives the house a small edge.

Imagine 10 players with $100 apiece. Half of them bet $10 on red and the other half bet $10 on black. Assuming that the wheel strictly aligns with the mean of probability, the house will break even for 18 of 19 spins. But on the 19th spin, the ball will land on one of the green “house numbers,” allowing the house to collect all the money staked from all bettors.

After 100 spins, the house will have won half of the players’ money. After 200 spins, they’ll have won all of it.

Even with a single house number – the single 0 on the roulette wheels introduced in Monte Carlo by the casino entrepreneur Louis Blanc – the house would win everything after 400 spins.

This eventuality, as De Moivre put it, “will seem almost incredible given the smallness of the odds.”

Hesitating to test the math

As De Moivre anticipated, gamblers and gambling operators were slow to adopt these findings.

De Moivre’s complex mathematical equations were over the heads of gamblers who hadn’t mastered simple arithmetic.

Gambling operators didn’t initially buy into the Golden Theorem, either, seeing it as unproven and therefore risky.

Instead, they played it safe by promoting games with long odds.

One was the Royal Oak Lottery, a game played with a polyhedral die with 32 faces, like a soccer ball. Players could bet on individual numbers or combinations of two or four numbers, giving them, at best, 7-to-1 odds of winning.

Faro was another popular game of chance in which the house, or “bank” as it was then known, gave players the opportunity to defer collecting their winnings for chances at larger payouts at increasingly steep odds.

Faro was a popular game of chance in which players could delay collecting their winnings for the chance to win even bigger sums. Boston Public Library

These games – and others played against a bank – were highly profitable to gambling entrepreneurs, who operated out of taverns, coffeehouses and other similar venues. “Keeping a common gaming house” was illegal, but with the law riddled with loopholes, enforcement was lax and uneven.

Public outcry against the Royal Oak Lottery was such that the Lottery Act of 1699 banned it. A series of laws enacted in the 1730s and 1740s classified faro and other games as illegal lotteries, on the grounds that the odds of winning or losing were not readily apparent to players.

The law of averages put into practice

Early writers on probability had asserted that the “house advantage” did not have to be very large for a gambling operation to profit enormously. The government’s effort to ban games of chance now obliged gaming operators to put the law of long averages into practice.

Further statutes outlawed games of chance played with dice, cards, wheels or any other device featuring “numbers or figures.”

None of these measures deterred gambling operators from the pursuit of profit.

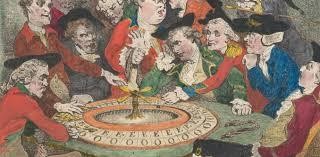
Since this language did not explicitly include letters, the game of EO, standing for “even odd,” was introduced in the mid 1740s, after the last of these gambling statutes was enacted. It was played on a wheel with 40 slots, all but two of which were marked either “E” or “O.” As in roulette, an ivory ball was rolled along the edge of the wheel as it was spun. If the ball landed in one of the two blank “bar holes,” the house would automatically win, similar to the “0” and “00” in roulette.

EO’s defenders could argue that it was not an unlawful lottery because the odds of winning or losing were now readily apparent to players and appeared to be virtually equal. The key, of course, is that the bar holes ensured they weren’t truly equal.

Although this logic might not stand up in court, overburdened law enforcement was happy for a reason to look the other way. EO proliferated; legislation to outlaw it was proposed in 1782 but failed.

In the 19th century, roulette became a big draw at Monte Carlo’s casinos.Hulton Archive/Getty Images

The allure of ‘even money’

Gambling operators may have even realized that evening the odds drew more players, who, in turn, staked more.

After EO appeared in Britain, gambling operations both there and on the continent of Europe introduced “even money” betting options into both new and established games.

For example, the game of biribi, which was popular in France throughout the 18th century, involved players betting on numbers from 1 to 72, which were shown on a betting cloth. Numbered beads would then be drawn from a bag to determine the win.

In one iteration from around 1720, players could bet on individual numbers, on vertical columns of six numbers, or other options that promised large payouts against steeper odds.

By the end of the 18th century, however, one biribi cloth featured even money options: Players could bet on any number between 36 and 70 being drawn, or on any number between 1 and 35. Players could also select red or black numbers, making it a likely inspiration for roulette.

In Britain, the Victorian ethos of morality and respectabilityeventually won out. Parliament outlawed games of chance played for money in public or private in 1845, restrictions that were not lifted until 1960.

By 1845, however, British gamblers could travel by steamship and train to one of the many European resorts cropping up across the continent, where the probability revolution had transformed casino gambling into the formidable business enterprise it is today.

For more such insights, log into our website https://international-maths-challenge.com

Credit of the article given to The Conversation


Australian teenagers are curious but have some of the most disruptive maths classes in the OECD

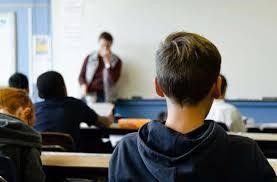
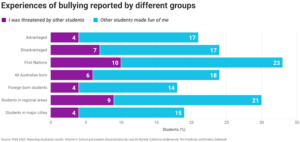
Australian teenagers have more disruptive maths classrooms and experience bullying at greater levels than the OECD average, a new report shows.

But in better news, Australian students report high levels of curiosity, which is important for both enjoyment and achievement at school.

The report, by the Australian Council for Educational Research (ACER) analysed questionnaire responses from more than 13,430 Australian students and 743 principals, to understand how their school experiences impact on maths performance.

What is the research?

This is the second report exploring Australian data from the 2022 Programme for International Student Assessment (PISA).

Australian teenagers have more disruptive maths classrooms and experience bullying at greater levels than the OECD average, a new report shows.

But in better news, Australian students report high levels of curiosity, which is important for both enjoyment and achievement at school.

The report, by the Australian Council for Educational Research (ACER) analysed questionnaire responses from more than 13,430 Australian students and 743 principals, to understand how their school experiences impact on maths performance.


What is the research?

This is the second report exploring Australian data from the 2022 Programme for International Student Assessment (PISA).

Author provided (no reuse)

The advantage gap

ACER’s first PISA 2022 report showed students from disadvantaged socioeconomic backgrounds were six times more likely to be low performers in maths than advantaged students.

It also showed the achievement gap between these two groups had grown by 19 points (or about one year of learning) since 2018.

This second report provides more insight into the challenges faced by disadvantaged students.

It shows a greater proportion of this group report learning in a less favourable disciplinary climate, experience lower levels of teacher support and feel less safe at school than their more advantaged peers.

Girls are more worried than boys

In last year’s report, the mean score for maths performance across OECD countries was nine points lower for girls than it was for boys. In Australia, the difference was 12 points.

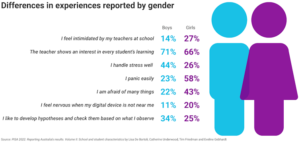
The new report also showed differences in wellbeing. In 2022, a greater number of girls reported they panicked easily (58% compared to 23% of boys), got nervous easily (71% compared to 39%) and felt nervous about approaching exams (75% compared 49%).

Almost double the percentage of girls reported feeling anxious when they didn’t have their “digital device” near them (20% compared to 11%). Whether this was a phone, tablet or computer was not specified.

Overall, students who reported feeling anxious when they did not have their device near them scored 37 points lower on the maths test than those who reported never feeling this way or feeling it “half the time”.

Author provided (no reuse)

Curiosity a strong marker for performance

Curiosity was measured for the first time in PISA 2022. This included student behaviours such as asking questions, developing hypotheses, knowing how things work, learning new things and boredom.

Students in Singapore, the highest performing country in PISA 2022, showed the greatest levels of curiosity, followed by Korea and Canada. These were the only comparison countries to have a significantly higher curiosity score than Australia, with the Netherlands showing the lowest curiosity score overall.

As ACER researchers note: “curiosity is associated with greater psychological wellbeing” and “leads to more enjoyment and participation in school and higher academic achievement”.

They found Australia’s foreign-born students reported being more curious than Australian-born students, with 74% compared to 66% reporting that they liked learning new things.

What next?

Their findings highlight concerns for Australian education, such as persistently poor outcomes for disadvantaged students and higher stress levels experienced by girls. We need to better understand why this is happening.

But they also identify behaviours and conditions – such as high levels of curiosity – that contribute to a good maths performance and can be used by schools and policymakers to plan for better outcomes.

For more such insights, log into our website https://international-maths-challenge.com

Credit of the article given to The Conversation


The case for ‘math-ish’ thinking

For everyone whose relationship with mathematics is distant or broken, Jo Boaler, a professor at Stanford Graduate School of Education (GSE), has ideas for repairing it. She particularly wants young people to feel comfortable with numbers from the start—to approach the subject with playfulness and curiosity, not anxiety or dread.

“Most people have only ever experienced what WEcall narrow mathematics—a set of procedures they need to follow, at speed,” Boaler says. “Mathematics should be flexible, conceptual, a place where we play with ideas and make connections. If we open it up and invite more creativity, more diverse thinking, we can completely transform the experience.”

Boaler, the Nomellini and Olivier Professor of Education at the GSE, is the co-founder and faculty director of Youcubed, a Stanford research center that provides resources for math learning that has reached more than 230 million students in over 140 countries. In 2013 Boaler, a former high school math teacher, produced How to Learn Math, the first massive open online course (MOOC) on mathematics education. She leads workshops and leadership summits for teachers and administrators, and her online courses have been taken by over a million users.

In her new book, “Math-ish: Finding Creativity, Diversity, and Meaning in Mathematics,” Boaler argues for a broad, inclusive approach to math education, offering strategies and activities for learners at any age. We spoke with her about why creativity is an important part of mathematics, the impact of representing numbers visually and physically, and how what she calls “ishing” a math problem can help students make better sense of the answer.

What do you mean by ‘math-ish’ thinking?

It’s a way of thinking about numbers in the real world, which are usually imprecise estimates. If someone asks how old you are, how warm it is outside, how long it takes to drive to the airport—these are generally answered with what WEcall “ish” numbers, and that’s very different from the way we use and learn numbers in school.

In the book WEshare an example of a multiple-choice question from a nationwide exam where students are asked to estimate the sum of two fractions: 12/13 + 7/8. They’re given four choices for the closest answer: 1, 2, 19, or 21. Each of the fractions in the question is very close to 1, so the answer would be 2—but the most common answer 13-year-olds gave was 19. The second most common was 21.

I’m not surprised, because when students learn fractions, they often don’t learn to think conceptually or to consider the relationship between the numerator or denominator. They learn rules about creating common denominators and adding or subtracting the numerators, without making sense of the fraction as a whole. But stepping back and judging whether a calculation is reasonable might be the most valuable mathematical skill a person can develop.

But don’t you also risk sending the message that mathematical precision isn’t important?

I’m not saying precision isn’t important. What I’m suggesting is that we ask students to estimate before they calculate, so when they come up with a precise answer, they’ll have a real sense for whether it makes sense. This also helps students learn how to move between big-picture and focused thinking, which are two different but equally important modes of reasoning.

Some people ask me, “Isn’t ‘ishing’ just estimating?” It is, but when we ask students to estimate, they often groan, thinking it’s yet another mathematical method. But when we ask them to “ish” a number, they’re more willing to offer their thinking.

Ishing helps students develop a sense for numbers and shapes. It can help soften the sharp edges in mathematics, making it easier for kids to jump in and engage. It can buffer students against the dangers of perfectionism, which we know can be a damaging mindset. WEthink we all need a little more ish in our lives.

You also argue that mathematics should be taught in more visual ways. What do you mean by that?

For most people, mathematics is an almost entirely symbolic, numerical experience. Any visuals are usually sterile images in a textbook, showing bisecting angles, or circles divided into slices. But the way we function in life is by developing models of things in our minds. Take a stapler: Knowing what it looks like, what it feels and sounds like, how to interact with it, how it changes things—all of that contributes to our understanding of how it works.

There’s an activity we do with middle-school students where we show them an image of a 4 x 4 x 4 cm cube made up of smaller 1 cm cubes, like a Rubik’s Cube. The larger cube is dipped into a can of blue paint, and we ask the students, if they could take apart the little cubes, how many sides would be painted blue? Sometimes we give the students sugar cubes and have them physically build a larger 4 x 4 x 4 cube. This is an activity that leads into algebraic thinking.

Some years back we were interviewing students a year after they’d done that activity in our summer camp and asked what had stayed with them. One student said, “I’m in geometry class now, and We still remember that sugar cube, what it looked like and felt like.” His class had been asked to estimate the volume of their shoes, and he said he’d imagined his shoes filled with 1 cm sugar cubes in order to solve that question. He had built a mental model of a cube.

When we learn about cubes, most of us don’t get to see and manipulate them. When we learn about square roots, we don’t take squares and look at their diagonals. We just manipulate numbers.


WEwonder if people consider the physical representations more appropriate for younger kids.

That’s the thing—elementary school teachers are amazing at giving kids those experiences, but it dies out in middle school, and by high school it’s all symbolic. There’s a myth that there’s a hierarchy of sophistication where you start out with visual and physical representations and then build up to the symbolic. But so much of high-level mathematical work now is visual. Here in Silicon Valley, if you look at Tesla engineers, they’re drawing, they’re sketching, they’re building models, and nobody says that’s elementary mathematics.

There’s an example in the book where you’ve asked students how they would calculate 38 x 5 in their heads, and they come up with several different ways of arriving at the same answer. The creativity is fascinating, but wouldn’t it be easier to teach students one standard method?

That narrow, rigid version of mathematics where there’s only one right approach is what most students experience, and it’s a big part of why people have such math trauma. It keeps them from realizing the full range and power of mathematics. When you only have students blindly memorizing math facts, they’re not developing number sense.

They don’t learn how to use numbers flexibly in different situations. It also makes students who think differently believe there’s something wrong with them.

For more such insights, log into our website https://international-maths-challenge.com

Credit of the article given to Stanford University


Incredible Maths Proof Is So Complex That Almost No One Can Explain It

Mathematicians are celebrating a 1000-page proof of the geometric Langlands conjecture, a problem so complicated that even other mathematicians struggle to understand it. Despite that, it is hoped the proof can provide key insights across maths and physics.

The Langlands programme aims to link different areas of mathematics

Mathematicians have proved a key building block of the Langlands programme, sometimes referred to as a “grand unified theory” of maths due to the deep links it proposes between seemingly distant disciplines within the field.

While the proof is the culmination of decades of work by dozens of mathematicians and is being hailed as a dazzling achievement, it is also so obscure and complex that it is “impossible to explain the significance of the result to non-mathematicians”, says Vladimir Drinfeld at the University of Chicago. “To tell the truth, explaining this to mathematicians is also very hard, almost impossible.”

The programme has its origins in a 1967 letter from Robert Langlands to fellow mathematician Andre Weil that proposed the radical idea that two apparently distinct areas of mathematics, number theory and harmonic analysis, were in fact deeply linked. But Langlands couldn’t actually prove this, and was unsure whether he was right. “If you are willing to read it as pure speculation I would appreciate that,” wrote Langlands. “If not — I am sure you have a waste basket handy.”

This mysterious link promised answers to problems that mathematicians were struggling with, says Edward Frenkel at the University of California, Berkeley. “Langlands had an insight that difficult questions in number theory could be formulated as more tractable questions in harmonic analysis,” he says.

In other words, translating a problem from one area of maths to another, via Langlands’s proposed connections, could provide real breakthroughs. Such translation has a long history in maths – for example, Pythagoras’s theorem relating the three sides of a triangle can be proved using geometry, by looking at shapes, or with algebra, by manipulating equations.

As such, proving Langlands’s proposed connections has become the goal for multiple generations of researchers and led to countless discoveries, including the mathematical toolkit used by Andrew Wiles to prove the infamous Fermat’s last theorem. It has also inspired mathematicians to look elsewhere for analogous links that might help. “A lot of people would love to understand the original formulation of the Langlands programme, but it’s hard and we still don’t know how to do it,” says Frenkel.

One analogy that has yielded progress is reformulating Langlands’s idea into one written in the mathematics of geometry, called the geometric Langlands conjecture. However, even this reformulation has baffled mathematicians for decades and was itself considered fiendishly difficult to prove.

Now, Sam Raskin at Yale University and his colleagues claim to have proved the conjecture in a series of five papers that total more than 1000 pages. “It’s really a tremendous amount of work,” says Frenkel.

The conjecture concerns objects that are similar to those in one half of the original Langlands programme, harmonic analysis, which describes how complex structures can be mathematically broken down into their component parts, like picking individual instruments out of an orchestra. But instead of looking at these with harmonic analysis, it uses other mathematical ideas, such as sheaves and moduli stacks, that describe concepts relating to shapes like spheres and doughnuts.

While it wasn’t in the setting that Langlands originally envisioned, it is a sign that his original hunch was correct, says Raskin. “Something I find exciting about the work is it’s a kind of validation of the Langlands programme more broadly.”

“It’s the first time we have a really complete understanding of one corner of the Langlands programme, and that’s inspiring,” says David Ben-Zvi at the University of Texas, who wasn’t involved in the work. “That kind of gives you confidence that we understand what its main issues are. There are a lot of subtleties and bells and whistles and complications that appear, and this is the first place where they’ve all been kind of systematically resolved.”

Proving this conjecture will give confidence to other mathematicians hoping to make inroads on the original Langlands programme, says Ben-Zvi, but it might also attract the attention of theoretical physicists, he says. This is because in 2007, physicists Edward Witten and Anton Kapustin found that the geometric Langlands conjecture appeared to describe an apparent symmetry between certain physical forces or theories, called S-duality.

The most basic example of this in the real world is in electricity and magnetism, which are mirror images of one another and interchangeable in many scenarios, but S-duality was also used by Witten to famously unite five competing string theory models into a single theory called M-theory.

But before anything like that, there is much more work to be done, including helping other mathematicians to actually understand the proof. “Currently, there’s a very small group of people who can really understand all the details here. But that changes the game, that changes the whole expectation and changes what you think is possible,” says Ben-Zvi.

For more such insights, log into www.international-maths-challenge.com.

*Credit for article given to Alex Wilkins*