New Research Disproves a Long-Held ‘Cognitive Illusion’ That Hockey Goaltenders Improve Under Pressure

The good news is that—statistically speaking—there is reason to believe Edmonton Oilers goalie Stuart Skinner will improve against the Florida Panthers in the Stanley Cup final.

The bad news is it may not be enough to make a difference.

That’s according to a new study, “Do NHL goalies get hot in the playoffs?” by Likang Ding, a doctoral student studying operations and information systems in the Alberta School of Business. The study is published on the arXivpreprint server.

Ding’s statistical analysis—in the final stage of review for publication—disproves the long-held and prevailing “hot hand” theory that if a goalie is performing well, he’ll continue to perform as well or better as pressure intensifies.

The term “hot hand” derives from basketball, where it is believed a shooter is more likely to score if their previous attempts were successful.

“Our main finding is the nonexistence of the hot-hand phenomenon (for hockey goaltenders),” says Ding. “That is, no positive influence of recent save performance on the save probability for the next shot.”

Instead, Ding and co-authors Ivor Cribben, Armann Ingolfsson and Monica Tran found that, by a small margin, “better past performance may result in a worse future performance.”

That could mean Panthers goaltender Sergei Bobrovsky is due for a slight slump, given his relatively hot streak of late. But according to Ding, that decline may amount to no more than about 1%—certainly nothing to count on.

The reverse is also true, says Ding. If a goalie is underperforming, as Skinner has on occasion during the playoffs, statistics would forecast a slight uptick in his save percentage.

The explanation in that case might be the “motivation effect”; when a goaltender’s recent save performance has been below his average, his effort and focus increase, “causing the next-shot save probability to be higher.”

Here Ding quotes Hall of Fame goaltender Ken Dryden, who once said, “If a shot beats you, make sure you stop the next one, even if it is harder to stop than the one before.”

Though it wasn’t part of his current study, Ding says he reviewed Skinner’s stats before the finals and found a worse-than-average performance, “so I’m hoping he will come back eventually.”

Ding wanted to take a closer look at the hot hand theory because it is crucial in understanding coaches’ decisions about which goaltender to start in a given game. It could mean the second goalie deserves a chance to enter the fray, get used to the pace and stay fresh, even if it might seem risky.

Ding’s data set includes information about all shots on goal in the NHL playoffs from 2008 to 2016, amounting to 48,431 shots faced by 93 goaltenders over 795 games and nine playoff seasons.

The hot hand theory has been around for at least as long as professional sports and is often applied to a range of human endeavour to support the notion that “success breeds success”—an appealing, almost intuitive assumption.

And yet, a series of studies in the 1980s focused on basketball shooting percentages showed there was no statistical evidence to support the theory, says Ding, attributing it instead to a psychological tendency to see patterns in random data.

The hot hand theory remained controversial after the statistical methods used in those studies were later shown to be biased, says Ding. But even once the bias was corrected, the theory has since been largely disproven.

Nobel Prize-winning cognitive scientist Daniel Kahneman once called the phenomenon “a massive and widespread cognitive illusion.” Ding’s study is one more confirming the consensus that the hot hand is no more than wishful thinking.

For more insights like this, visit our website at www.international-maths-challenge.com.

Credit of the article given to Geoff McMaster, University of Alberta


Mathematicians Discover Impossible Problem In Super Mario Games

Using the tools of computational complexity, researchers have discovered it is impossible to figure out whether certain Super Mario Bros levels can be beaten without playing them, even if you use the world’s most powerful supercomputer.

Figuring out whether certain levels in the Super Mario Bros series of video games can be completed before you play them is mathematically impossible, even if you had several years and the world’s most powerful supercomputer to hand, researchers have found.

“We don’t know how to prove that a game is fun, we don’t know what that means mathematically, but we can prove that it’s hard and that maybe gives some insight into why it’s fun,” says Erik Demaine at the Massachusetts Institute of Technology. “I like to think of hard as a proxy for fun.”

To prove this, Demaine and his colleagues use tools from the field of computational complexity – the study of how difficult and time-consuming various problems are to solve algorithmically. They have previously proven that figuring out whether it is possible to complete certain levels in Mario games is a task that belongs to a group of problems known as NP-hard, where the complexity grows exponentially. This category is extremely difficult to compute for all but the smallest problems.

Now, Demaine and his team have gone one step further by showing that, for certain levels in Super Mario games, answering this question is not only hard, but impossible. This is the case for several titles in the series, including New Super Mario Bros and Super Mario Maker. “You can’t get any harder than this,” he says. “Can you get to the finish? There is no algorithm that can answer that question in a finite amount of time.”

While it may seem counterintuitive, problems in this undecidable category, known as RE-complete, simply cannot be solved by a computer, no matter how powerful, no matter how long you let it work.

Demaine concedes that a small amount of trickery was needed to make Mario levels fit this category. Firstly, the research looks at custom-made levels that allowed the team to place hundreds or thousands of enemies on a single spot. To do this they had to remove the limits placed by the game publishers on the number of enemies that can be present in a level.

They were then able to use the placement of enemies within the level to create an abstract mathematical tool called a counter machine, essentially creating a functional computer within the game.

That trick allowed the team to invoke another conundrum known as the halting problem, which says that, in general, there is no way to determine if a given computer program will ever terminate, or simply run forever, other than running it and seeing what happens.

These layers of mathematical concepts finally allowed the team to prove that no analysis of the game level can say for sure whether or not it can ever be completed. “The idea is that you’ll be able to solve this Mario level only if this particular computation will terminate, and we know that there’s no way to determine that, and so there’s no way to determine whether you can solve the level,” says Demaine.

For more such insights, log into www.international-maths-challenge.com.

*Credit for article given to Matthew Sparkes*


Study Shows the Power of Social Connections to Predict Hit Songs

Ever wondered how your friends shape your music taste? In a recent study, researchers at the Complexity Science Hub (CSH) demonstrated that social networks are a powerful predictor of a song’s future popularity. By analysing friendships and listening habits, they’ve boosted machine learning prediction precision by 50%.

“Our findings suggest that the social element is as crucial in music spread as the artist’s fame or genre influence,” says Niklas Reisz from CSH. By using information about listener social networks, along with common measures used in hit song prediction, such as how well-known the artist is and how popular the genre is, the researchers improved the precision of predicting hit songs from 14% to 21%. The study, published in Scientific Reports, underscores the power of social connections in music trends.

A deep dive into data

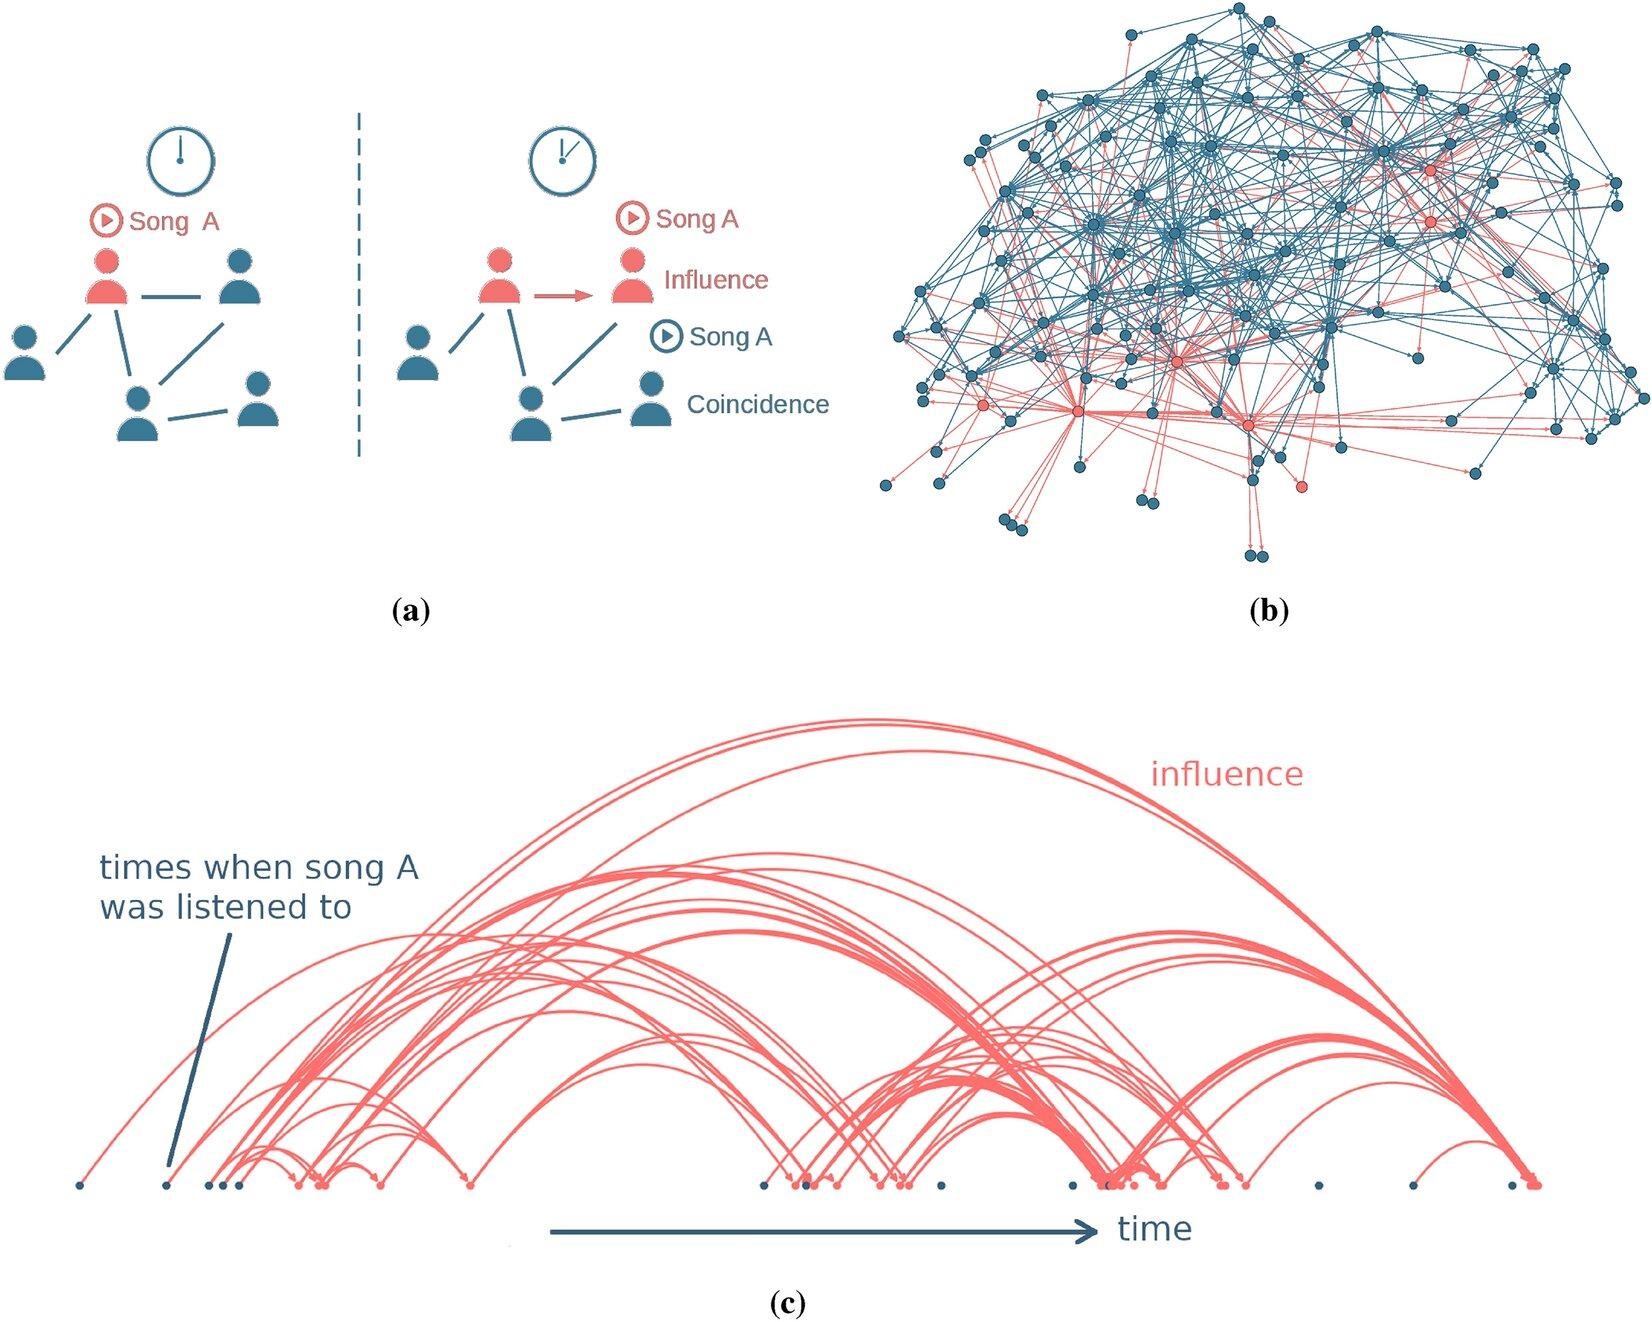
The CSH team analysed data from the music platform last.fm, analysing 2.7 million users, 10 million songs, and 300 million plays. With users able to friend each other and share music preferences, the researchers gained anonymized insights into who listens to what and who influences whom, according to Reisz.

For their model, the researchers worked with two networks: one mapping friendships and another capturing influence dynamics—who listens to a song and who follows suit. “Here, the nodes of the network are also people, but the connections arise when one person listens to a song and shortly afterwards another person listens to the same song for the first time,” explains Stefan Thurner from CSH.

Examining the first 200 plays of a new song, they predicted its chances of becoming a hit—defined as being in the top 1% most played songs on last.fm.

User influence

The study found that a song’s spread hinges on user influence within their social network. Individuals with a strong influence and large, interconnected friend circles accelerate a song’s popularity. According to the study, information about social networks and the dynamics of social influence enable much more precise predictions as to whether a song will be a hit or not.

“Our results also show how influence flows both ways—people who influence their friends are also influenced by them” explains CSH researcher Vito Servedio. “In this way, multi-level cascades can develop within a very short time, in which a song can quickly reach many other people, starting with just a few people.”

Social power in the music industry

Predicting hit songs is crucial for the music industry, offering a competitive edge. Existing models often focus on artist fame and listening metrics, but the CSH study highlights the overlooked social aspect—musical homophily, which is the tendency for friends to listen to similar music. “It was particularly interesting for us to see that the social aspect, musical homophily, has so far received very little attention—even though music has always had a strong social aspect,” says Reisz.

The study quantifies this social influence, providing insights that extend beyond music to areas like political opinion and climate change attitudes, according to Thurner.

For more such insights, log into our website https://international-maths-challenge.com

Credit of the article given to Complexity Science Hub Vienna


Wire-Cut Forensic Examinations Currently Too Unreliable For Court, New Study Says

A research article published June 10 in the Proceedings of the National Academy of Sciences highlights the importance of careful application of high-tech forensic science to avoid wrongful convictions.

In a study with implications for an array of forensic examinations that rely on “vast databases and efficient algorithms,” researchers found the odds of a false match significantly increase when examiners make millions of comparisons in a quest to match wires found at a crime scene with the tools allegedly used to cut them.

The rate of mistaken identifications could be as high as one in 10 or more, concluded the researchers, who are affiliated with the Center for Statistics and Applications in Forensic Evidence (CSAFE), based in Ames, Iowa.

“It is somewhat of a counterintuition,” said co-author Susan VanderPlas, an assistant professor of statistics at the University of Nebraska-Lincoln. “You are more likely to find the right match—but you’re also more likely to find the wrong match.”

VanderPlas worked as a research professor at CSAFE before moving to Nebraska in 2020. Co-authors of the study, “Hidden Multiple Comparisons Increase Forensic Error Rates,” were Heike Hoffmann and Alicia Carriquiry, both affiliated with CSAFE and Iowa State University’s Department of Statistics.

Wire cuts and tool marks are used frequently as evidence in robberies, bombings, and other crimes. In the case of wire cuts, tiny striations on the cut ends of a wire may be matched to one of many available tools in a toolbox or garage. Comparing the evidence to more tools increases the chances that similar striations may be found on unrelated tools, resulting in a false accusation and conviction.

Wire-cutting evidence has been at issue in at least two cases that garnered national attention, including one where the accused was linked to a bombing based on a small piece of wire, a tiny fraction of an inch in diameter, that was matched to a tool found among the suspect’s belongings.

“Wire-cutting evidence is used in court and, based on our findings, it shouldn’t be—at least not without presenting additional information about how many comparisons were made,” VanderPlas said.

Wire cutting evidence is evaluated by comparing the striations found on the cut end of a piece of wire against the cutting blades of tools suspected to have been used in the crime. In a manual test, the examiner slides the end of the wire along the path created along another piece of material cut by the same tool to see where the pattern of striations match.

An automated process uses a comparison microscope and pattern-matching algorithms, to find possible matches pixel by pixel.

This can result in thousands upon thousands of individual comparisons, depending upon the length of the cutting blade, diameter of the wire, and even the number of tools checked.

For example, VanderPlas said she and her husband tallied the various tin snips, wire cutters, pliers and similar tools stored in their garage and came up with a total of 7 meters in blade length.

Examiners may not even be aware of the number of comparisons they are making as they search for a matching pattern, because those comparisons are hidden in the algorithms.

“This often-ignored issue increases the false discovery rate, and can contribute to the erosion of public trust in the justice system through conviction of innocent individuals,” the study authors wrote.

Forensic examiners typically testify based upon subjective rules about how much similarity is required to make an identification, the study explained. The researchers could not obtain error rate studies for wire-cut examinations and used published error rates for ballistics examinations to estimate possible false discovery rates for wire-cut examinations.

Before wire-cut examinations are used as evidence in court, the researchers recommended that:

  • Examiners report the overall length or area of materials used in the examination process, including blade length and wirediameter. This would enable examination-wide error rates to be calculated.
  • Studies be conducted to assess both false discovery and false elimination error rates when examiners are making difficult comparisons. Studies should link the length and area of comparison to error rates.
  • The number of items searched, comparisons made and results returned should be reported when a database is used at any stage of the forensic evidence evaluation process.

The VanderPlas article joins other reports calling for improvements in forensic science in America. The National Academies Press, publisher of the PNAS journal and other publications of the National Academies of Sciences, Engineering and Medicine, also published the landmark 2009 report “Strengthening Forensic Science in the United States: A Path Forward.”


For more such insights, log into our website https://international-maths-challenge.com

Credit of the article given to University of Nebraska-Lincoln


What toilet paper and game shows can teach us about the spread of epidemics

How can we explain and predict human behaviour? Are mathematics and probability up to the task, or are humans too complex and irrational?

Often, people’s actions take us by surprise, particularly when they seem irrational. Take the COVID pandemic: one thing nobody saw coming was a rush on toilet paper that left supermarket shelves bare in many countries.

But by combining ideas from mathematics, economics and behavioural science, researchers were eventually able to make mathematical models of how panic spreads between people, which made sense of the toilet paper panic.

In new research published in the Journal of the Royal Society Interface, we have taken a similar approach to the spread of disease – and showed that human reactions to the spread of disease can be as important as the behaviour of the disease itself when it comes to determining how an outbreak develops.

The power of context

One thing we know is that context can shape people’s behaviour in surprising ways. A nightly example of this is the popular TV game show Deal or No Deal, in which contestants regularly turn down offers of free money because they hope they will get a larger sum later.

If you carry out a rational calculation of the probabilities, most of the time the contestant’s “best” move is to accept the offer. But in practice, people often turn down a reasonable offer and hold out for a tiny chance at the big bucks.

Would a person refuse $5,000 if they were offered it in any other context? In this situation, straightforward maths can’t predict how people will behave.


The science of irrationality

What if we go beyond maths? Behavioural science has much to say about what drives people to take specific actions.

In this case, it might suggest people behave more reasonably if they set a realistic goal (such as getting $5,000) and position the goal in a powerful motivational context (such as planning to use the money to pay for a holiday).

Yet time and again even people with clear, achievable goals are swept up by emotion and context. At the right time and place, they will believe that luck is with them and refuse a $5,000 offer in the hope of something bigger.

Nevertheless, researchers have found ways to understand the behaviour of Deal or No Deal contestants by combining ideas from mathematics, economics and the study of behaviour around risky choices.

In essence, the researchers found contestants’ decisions are “path-dependent”. This means their choice to accept a bank offer depends not only on their goal and the odds, but also the choices they have already made.

Group behaviours

Deal or No Deal, of course, is largely about individuals making decisions in a certain context. But when we’re trying to understand the spread of disease, we’re interested in how whole groups of people behave.

This is the realm of social psychology, where group behaviours and attitudes can influence individual actions. In some ways this makes groups easier to predict, and it’s where combining mathematics and behavioural science really starts to produce results.

Although some mass behaviours at the start of the COVID pandemic were highly visible – like panic-buying toilet paper – others were not. Mobility data from Google showed people were choosing to limit their own movement, for example, before any mandated restrictions were in place.

Feedback loops

Fear and perceived risk can promote self-preservation through positive mass behaviours. For example, as more sickness appears in the community, people are more likely to act to prevent themselves getting sick.

These actions in turn have a direct impact on the spread of the disease, which further affects human behaviour, and so on. Many mathematical models of how diseases spread have failed to take this feedback loop into account.

Our new study is a step toward combining population disease spread modelling with mass behaviour modelling, aimed at understanding the links between behaviour and infection.

Our framework accounts for dynamic and self-driven protective health behaviours in the presence of an infectious disease. This puts us in a better position to make informed choices and policy recommendations for future epidemics.

Notably, our approach allows us to understand how mass behaviours influence how great a burden the disease will impose on the population in the long term. There is still much work to develop in this area.

To better understand human behaviour from a mathematical perspective, we will need better data around human choices in the presence of an infectious disease. This lets us pick out patterns that can be used for prediction.

Predicting behaviour

So, to come back to the question: can we predict human behaviour? Well, it depends. Many factors contribute to our choices: emotion, context, risk perception, social observation, fear, excitement.

Understanding which of these factors to explore with mathematics is no easy feat. However, when society faces so many challenges related to changes in mass behaviour – from infectious diseases to climate change – using mathematics to describe and predict patterns is a powerful tool.

But no single discipline can provide the answer to global challenges which need changes in human behaviour at scale. We will need more interdisciplinary teams to achieve meaningful impacts.

For more such insights, log into our website https://international-maths-challenge.com

Credit of the article given to The Conversation


Mathematicians Can’t Agree What ‘Equals’ Means, And That’s A Problem

What does “equals” mean? For mathematicians, this simple question has more than one answer, which is causing issues when it comes to using computers to check proofs. The solution might be to tear up the foundations of maths.

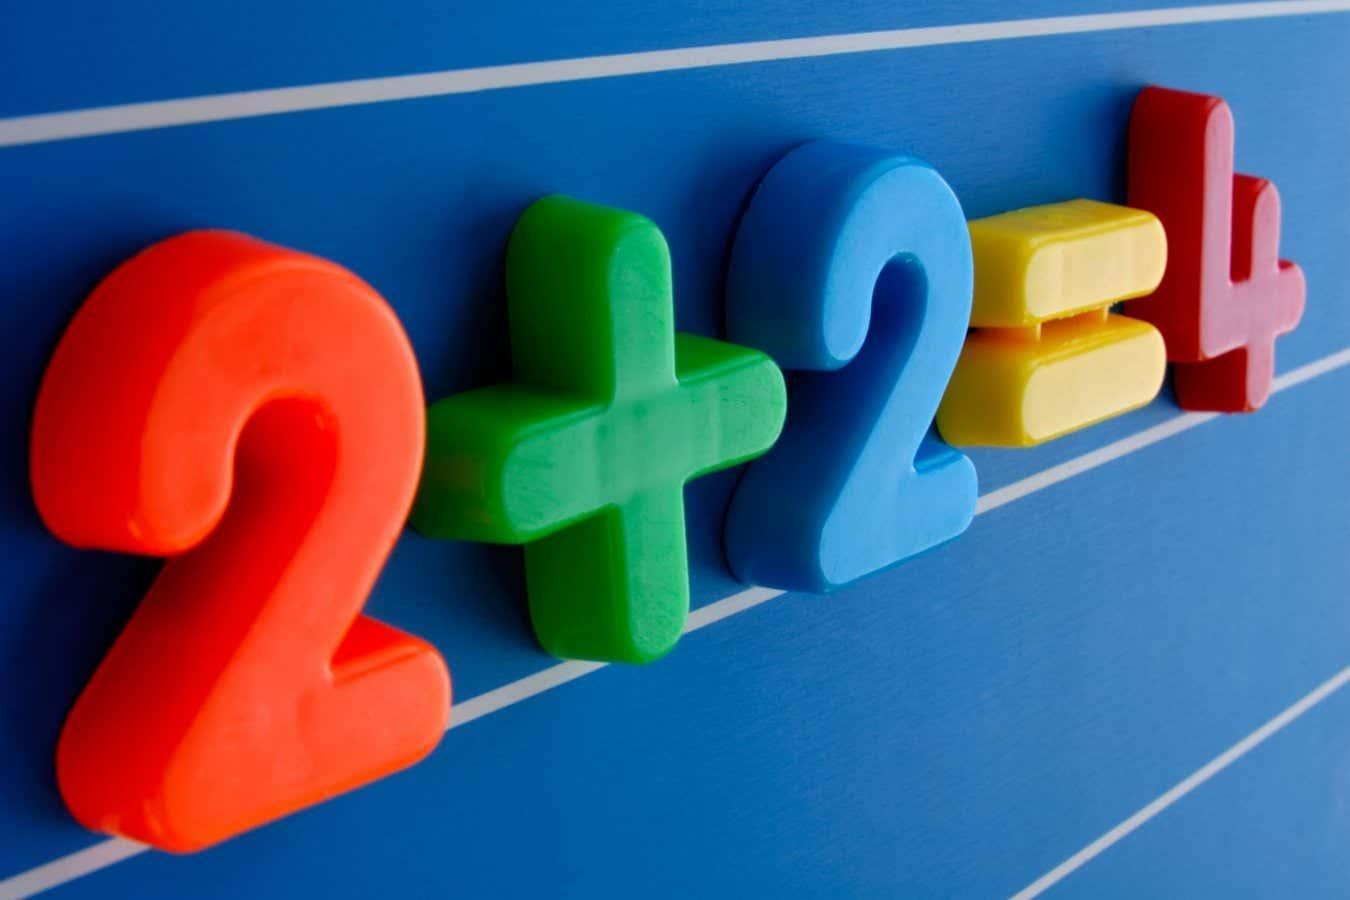
When you see “2 + 2 = 4”, what does “=” mean? It turns out that’s a complicated question, because mathematicians can’t agree on the definition of what makes two things equal.

While this argument has been quietly simmering for decades, a recent push to make mathematical proofs checkable by computer programs, called formalisation, has given the argument new significance.

“Mathematicians use equality to mean two different things, and I was fine with that,” says Kevin Buzzard at Imperial College London. “Then I started doing maths on a computer.” Working with computer proof assistants made him realise that mathematicians must now confront what was, until recently, a useful ambiguity, he says – and it could force them to completely redefine the foundations of their subject.

The first definition of equality will be a familiar one. Most mathematicians take it to mean that each side of an equation represents the same mathematical object, which can be proven through a series of logical transformations from one side to the other. While “=”, the equals sign, only emerged in the 16th century, this concept of equality dates back to antiquity.

It was the late 19th century when things began to change, with the development of set theory, which provides the logical foundations for most modern mathematics. Set theory deals with collections, or sets, of mathematical objects, and introduced another definition of equality: if two sets contain the same elements, then they are equal, similar to the original mathematical definition. For example, the sets {1, 2, 3} and {3, 2, 1} are equal, because the order of the elements in a set doesn’t matter.

But as set theory developed, mathematicians started saying that two sets were equal if there was an obvious way to map between them, even if they didn’t contain exactly the same elements, says Buzzard.

To understand why, take the sets {1, 2, 3} and {a, b, c}. Clearly, the elements of each set are different, so the sets aren’t equal. But there are also ways of mapping between the two sets, by identifying each letter with a number. Mathematicians call this an isomorphism. In this case, there are multiple isomorphisms because you have a choice of which number to assign to each letter, but in many cases, there is only one clear choice, called the canonical isomorphism.

Because a canonical isomorphism of two sets is the only possible way to link them, many mathematicians now take this to mean they are equal, even though it isn’t technically the same concept of equality that most of us are used to. “These sets match up with each other in a completely natural way and mathematicians realised it would be really convenient if we just call those equal as well,” says Buzzard.

Having two definitions for equality is of no real concern to mathematicians when they write papers or give lectures, as the meaning is always clear from the context, but they present problems for computer programs that need strict, precise instructions, says Chris Birkbeck at the University of East Anglia, UK. “We’re finding that we were a little bit sloppy all along, and that maybe we should fix a few things.”

To address this, Buzzard has been investigating the way some mathematicians widely use canonical isomorphism as equality, and the problems this can cause with formal computer proof systems.

In particular, the work of Alexander Grothendieck, one of the leading mathematicians of the 20th century, is currently extremely difficult to formalise. “None of the systems that exist so far capture the way that mathematicians such as Grothendieck use the equal symbol,” says Buzzard.

The problem has its roots in the way mathematicians put together proofs. To begin proving anything, you must first make assumptions called axioms that are taken to be true without proof, providing a logical framework to build upon. Since the early 20th century, mathematicians have settled on a collection of axioms within set theory that provide a firm foundation. This means they don’t generally have to use axioms directly in their day-to-day business, because common tools can be assumed to work correctly – in the same way you probably don’t worry about the inner workings of your kitchen before cooking a recipe.

“As a mathematician, you somehow know well enough what you’re doing that you don’t worry too much about it,” says Birkbeck. That falls down, however, when computers get involved, carrying out maths in a way that is similar to building a kitchen from scratch for every meal. “Once you have a computer checking everything you say, you can’t really be vague at all, you really have to be very precise,” says Birkbeck.

To solve the problem, some mathematicians argue we should just redefine the foundations of mathematics to make canonical isomorphisms and equality one and the same. Then, we can make computer programs work around that. “Isomorphism is equality,” says Thorsten Altenkirch at the University of Nottingham, UK. “I mean, what else? If you cannot distinguish two isomorphic objects, what else would it be? What else would you call this relationship?”

Efforts are already under way to do this in a mathematical field called homotopy type theory, in which traditional equality and canonical isomorphism are defined identically. Rather than trying to contort existing proof assistants to fit canonical isomorphism, says Altenkirch, mathematicians should adopt type theory and use alternative proof assistants that work with it directly.

Buzzard isn’t a fan of this suggestion, having already spent considerable effort using current tools to formalise mathematical proofs that are needed to check more advanced work, such as a proof of Fermat’s last theorem. The axioms of mathematics should be left as they are, rather than adopting type theory, and existing systems should be tweaked instead, he says. “Probably the way to fix it is just to leave mathematicians as they are,” says Buzzard. “It’s very difficult to change mathematicians. You have to make the computer systems better.”

For more such insights, log into www.international-maths-challenge.com.

*Credit for article given to Alex Wilkins*


How can we make good decisions by observing others? A videogame and computational model have the answer

How can disaster response teams benefit from understanding how people most efficiently pick strawberries together, or how they choose the perfect ice cream shop with friends?

All these scenarios are based on the very fundamental question of how and when human groups manage to adapt collectively to different circumstances. Two recent studies on collective dynamics by the Cluster of Excellence Science of Intelligence (SCIoI) in Berlin, Germany, lay the groundwork to promote better coordinated operations while showcasing the potential of the Cluster’s analytic-synthetic loop approach: an interconnection of a human-focused (analytic) study with a novel computer simulation (synthetic).

By understanding how individual decisions impact group performance, we can possibly enhance emergency services and everyday teamwork, and further develop effective decentralized robotic systems that could benefit society in multiple ways (think robots that explore potentially dangerous places such as a crumbling building).

How groups of people move and make collective decisions (analytic side)

Through a naturalistic immersive-reality experiment, Science of Intelligence researchers have presented new findings on the dynamics of human collective behaviour. The study “Collective incentives reduce over-exploitation of social information in unconstrained human groups,” published in Nature Communications, explores how individual decisions shape collective outcomes in realistic group settings.

In the experiment, groups of participants freely moved through a 3D virtual environment similar to a video game, searching for hidden treasures. This resembled scenario of hunting and gathering, extinguishing wildfires, or searching for survivors together.

The researchers varied how resources were distributed and how participants were incentivized. Individuals often benefited from staying close to others and taking advantage of their discoveries. However, on the group level, this caused poor group performance.

“It’s a bit like copying homework: You are benefitting yourself but not contributing to group performance in the long run,” said Dominik Deffner. “But it also turned out that rewards on the group level, similar to bonuses for team achievements, reduced this copying behaviour and thereby improved group performance.”

To extract individual decisions from naturalistic societal interactions, the researchers developed a computational modelhelping them to understand key decision-making processes. This model inferred sequences of decisions from visual and movement data and showed that group rewards made people less likely to follow social information, encouraging them to become more selective over time.

The study also looked at how groups moved and acted over time and space, finding a balance between exploring new areas and using known resources at different times. These findings are important for improving group strategies in many areas, like solving problems in businesses or improving search and rescue operations.

How visual perception and embodiment shapes collective decisions (synthetic side)

In a complementary study, called “Visual social information use in collective foraging” and published in PLOS Computational Biology, researchers introduced a new computational model that explores how individual decisions shape collective behaviour.

The model applies to any realistic situation where groups of people, animals, or robots are searching for rewards together. This computational model addresses two main questions: how do individuals make decisions according to visible information around them? And how do they move in a physical space at the same time?

In this study, a simulated swarm of robots searches for resources in a virtual playground very similar to the one by Deffner described above. The resources are in patches and when depleted, they reappear in new spots. The virtual robots can choose between exploring the environment to find new resource patches, following other robots consuming resources, or staying and consuming resources until they’re gone.

The findings show how simple decisions, for example where to go next, can lead to complex group behaviour.

“The environment plays an important role in how groups work efficiently together” said David Mezey. “When resources are concentrated, working closely together and relying on shared information is the most efficient solution. However, when the resources are spread out it’s better for individuals or smaller subgroups to work independently. This explains some everyday group behaviours that many of us may be familiar with.

“Imagine a group of firefighters tasked with putting out a large fire in the forest. If the flames are concentrated in one well-defined area, the best strategy would be for all of them to work together in that specific location. But, if the fire has already spread across patches, it is more effective for the firefighters to split into smaller subgroups to find and tackle the distributed patches independently.”

The study also highlights how physical and visual limitations affect group performance. The authors included real-world limitations in their computer simulations, for example, individuals bumping into each other when too close, or blocking each other’s views.

They discovered that these limitations can fundamentally change collective behaviour and, interestingly, in some cases, even improve group performance. For example, virtual robots with restricted vision focus only on nearby individuals, improving their search strategy. Imagine strawberry picking with friends: even if a friend finds some fruits far away from you, you might want to stay in your area to avoid reaching an already empty patch.

These limitations had similar effects on virtual robots, and this study shows why it’s so important to think about such limitations when studying group behaviour.

Analysing, synthesizing and looping back again

We’ve understood certain animal collective behaviours especially in fish, birds and sheep through simple interaction rules often based on physical principles. However, to understand collective behaviour in humans, we need to understand all the individual decisions that people make and the cognitive processes that produce them.

In the two studies, the researchers link individual cognition to collective outcomes in realistic environments and thus explain complex group outcomes based on individual decisions. In other words, insights from the human-focused study (analytic side) are used to create computational models (synthetic side) that can be applied to better understand phenomena such as collective behaviour and social learning (loop).

This provides a fruitful path forward, hopefully making it possible to understand, predict, and guide collective outcomes in crucial areas.Together, these studies offer a comprehensive understanding of the mechanisms linking individual cognition to collective outcomes in collective foraging tasks, providing new perspectives on optimizing collective performance across various fields. The implications for decentralized robotic systems are particularly promising.

Understanding realistic constraints on group performance might reshape how we develop efficient swarm robotic applications in the future.

For more insights like this, visit our website at www.international-maths-challenge.com.

Credit of the article given to Maria Ott, Technische Universität Berlin – Science of Intelligence


Decision-Making Analysis for a New Variant of the Classical Secretary Problem

The classic “secretary problem” involves interviewing job candidates in a random order. Candidates are interviewed one by one, and the interviewer ranks them. After each interview, the interviewer must either accept or reject the candidate. If they accept a candidate, the process stops; otherwise, the next candidate is interviewed and so on.

Of course, if a candidate is accepted, then a subsequent candidate who may well be better suited to the job will never be interviewed and so is never selected. Nevertheless, the goal is to maximize the probability of selecting the best candidate.

Since its introduction in the 1950s, this problem has been researched extensively because it is a fundamental example of optimal stopping problems. Many variants of the problem, such as multiple choices, regret-permit, and weighted versions, have been studied.

Research published in the International Journal of Mathematics in Operational Research has looked at a variant of the secretary problem.

Yu Wu of Southwest Jiaotong University in Chengdu, Sichuan, China, explains that in this variant the interviewer has a “look-ahead privilege” and can see some of the details regarding subsequent candidates before making a decision about the current interviewee at each step. Wu defines the degree of look-ahead privilege as the number of candidates interviewed between the first interview and the final decision.

In one sense, this version of the problem is a more realistic sequential interviewing scenario wherein the interviewer may well have seen the resumes of all candidates or perhaps even have met them all before the interviewing process begins.

This contrasts with the blind sequential interviewing of the classic problem and allows a decision to be deferred until subsequent candidates have been interviewed.

It should therefore allow a better decision to be made regarding the choice of candidate who is offered the job. This is the first time this variant has been studied in detail in this way.

Wu has proposed a general optimal decision strategy framework to maximize the probability of selecting the best candidate. He focuses on a specific look-ahead privilege structure, applying the strategy framework to derive a closed-form probability of success.

This provides for an optimal strategy. Computational experiments have been carried out to explore the relationships between the various factors in the process and to show how this variant of the problem can be solved.


For more such insights, log into our website https://international-maths-challenge.com

Credit of the article given to David Bradley, Inderscience


People Underestimate The Probability of Including at Least One Minority Member in a Group, Research Suggests

Human society includes various minority groups. However, it is often difficult to know whether someone is a minority member simply by looking at the person, as minority traits may not be visually apparent (e.g., sexual orientation, color vision deficiency). In addition, minorities may hide their minority traits or identities. Consequently, we may have been unaware of the presence of minorities in daily life. Probabilistic thinking is critical in such uncertain situations.

The people with whom we interact in our daily lives are typically a group of several dozen individuals (e.g., a school class). How do we judge the probability of including at least one minoritymember in such groups? For example, how does a school teacher estimate the probability of having a minority in the class?

Cognitive psychology states that humans often make unrealistic judgments about probabilities, such as risk. So, do we also misperceive the probability of minority inclusion in a group or can we accurately assess the probability through heuristics or knowledge?

Associate Professor Niimi of Niigata University demonstrates that people unrealistically underestimate such probabilities. The study is published in the Journal of Cognitive Psychology.

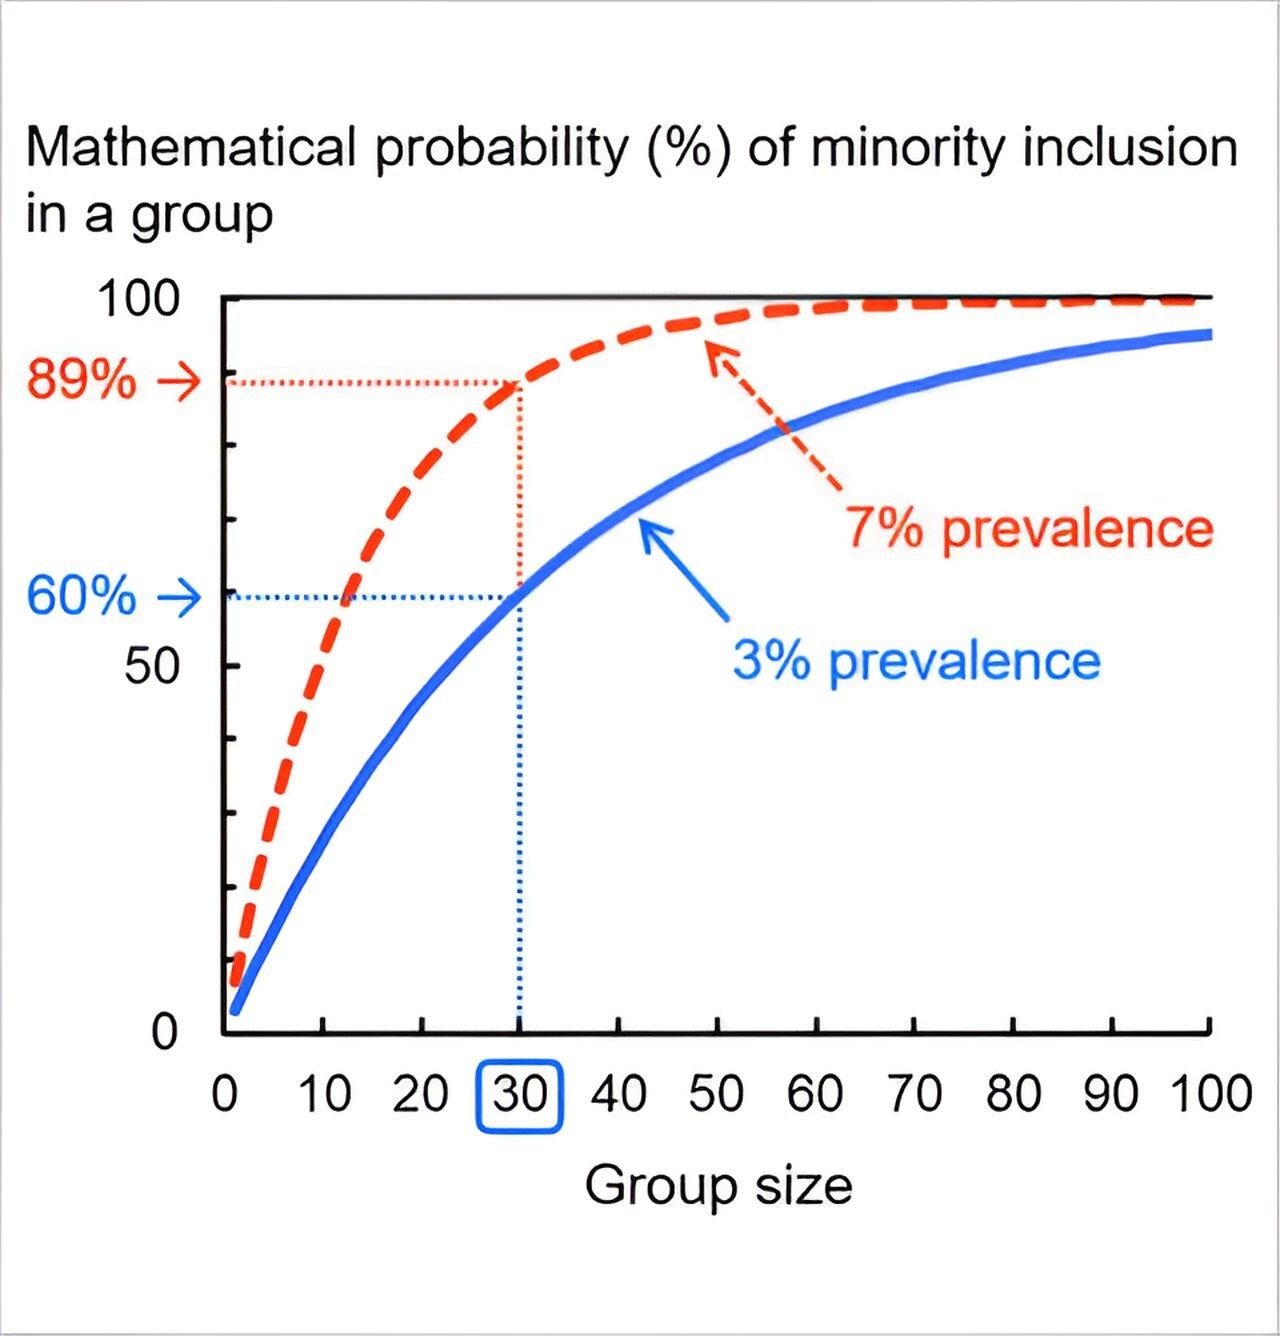
First, the researchers examine how the probabilities are computed mathematically. If the prevalence of the minority in question is 0.03 (3%) and the group size is 30, the probability of including one or more minority members in the group is one minus the probability that all 30 members are NOT the minority.

Because the probability that one person is not a minority is 0.97, the probability of minority inclusion is given by 1– (0.97)30 (if there is no other information). The computer tells us that the result is 0.60 (60%). When the minority prevalence is 7%, it increases to 89%. These mathematical probabilities appear to be higher than those of naive intuition.

Indeed, most respondents estimated probabilities far below the mathematical probabilities. The second image shows examples of the questions and results. Approximately 90% of the respondents estimated below-mathematical probabilities, and the majority of the estimates were lower than 10%. This underestimation was repeatedly observed under a variety of conditions (online worker and student samples, revised wording, etc.).

Why are the probabilities of minority inclusion underestimated? Is this a result of prejudice or stereotyping against minorities? The answer was “No.” The same underestimation occurred even when minorities unlikely to be associated with negative stereotypes were used (e.g., people with absolute pitch and fictional minorities). Of course, the mathematical calculations cannot be performed mentally. No wonder the respondents’ estimates were inaccurate.

The problem was why the estimates were not random, but strongly biased toward underestimation. Even if one does not know how to calculate it, one may have learned from daily experience that the probability of inclusion is much higher than the prevalence (e.g., the probability of including a woman in a group of randomly selected 100 individuals should be greater than 50%). However, the present results suggest that most people are unfamiliar with the concept of probability of inclusion and do not know how to think about it.

Further analysis revealed that the major source of underestimation was the use of heuristics, such as ignoring group size and reporting prevalence, or calculating the expected value of the number of minorities. Although most heuristics were erroneous, some yielded relatively reasonable estimates (e.g., assuming a high probability if the expected value exceeded one).

Underestimating the probability of minority inclusion may lead to the misconception that minorities are irrelevant in our daily lives. However, there was one promising finding in the present study.

When the respondents were given the mathematical probability of minority inclusion, their attitudes changed in favour of inclusive views about minorities compared to conditions in which mathematical probability was not given. Knowledge may compensate for cognitive bias.

For more such insights, log into our website https://international-maths-challenge.com

Credit of the article given to Niigata University


Data scientists aim to improve humanitarian support for displaced populations

In times of crisis, effective humanitarian aid depends largely on the fast and efficient allocation of resources and personnel. Accurate data about the locations and movements of affected people in these situations is essential for this.

Researchers from the University of Tokyo, working with the World Bank, have produced a framework to analyse and visualize population mobility data, which could help in such cases. The research is publishedin the journal Scientific Reports.

Wars, famines, outbreaks, natural disasters—there are unfortunately many reasons why populations might be forced or feel compelled to leave their homes in search of refuge elsewhere, and these cases continue to grow.

The United Nations estimated in 2023 that there were more than 100 million forcibly displaced people in the world. More than 62 million of these individuals are considered internally displaced people (IDPs), those in particularly vulnerable situations due to being stuck within the borders of their countries, from which they might be trying to flee.

The circumstances that displace populations are inevitably chaotic and certainly, but not exclusively, in cases of conflict, information infrastructure can be impeded. So, authorities and agencies trying to get a handle on crises are often operating with limited data on the people they are trying to help. But the lack of data alone is not the only problem; being able to easily interpret data, so that nonexperts can make effective decisions based on it, is also an issue, especially in rapidly evolving situations where the stakes, and tensions, are high.

“It’s practically impossible to provide aid agencies and others with accurate real time data on affected populations. The available data will often be too fragmented to be useful directly,” said Associate Professor Yuya Shibuya from the Interfaculty Initiative in Information Studies.

“There have been many efforts to use GPS data for such things, and in normal situations, it has been shown to be useful to model population behaviour. But in times of crisis, patterns of predictability break down and the quality of data decreases.

“As data scientists, we explore ways to mitigate these problems and have developed a tracking framework for monitoring population movements by studying IDPs displaced in Russia’s invasion of Ukraine in 2022.”

Even though Ukraine has good enough network coverage throughout to acquire GPS data, the data generated is not representative of the entire population. There are also privacy concerns, and likely other significant gaps in data due to the nature of conflict itself. As such, it’s no trivial task to model the way populations move.

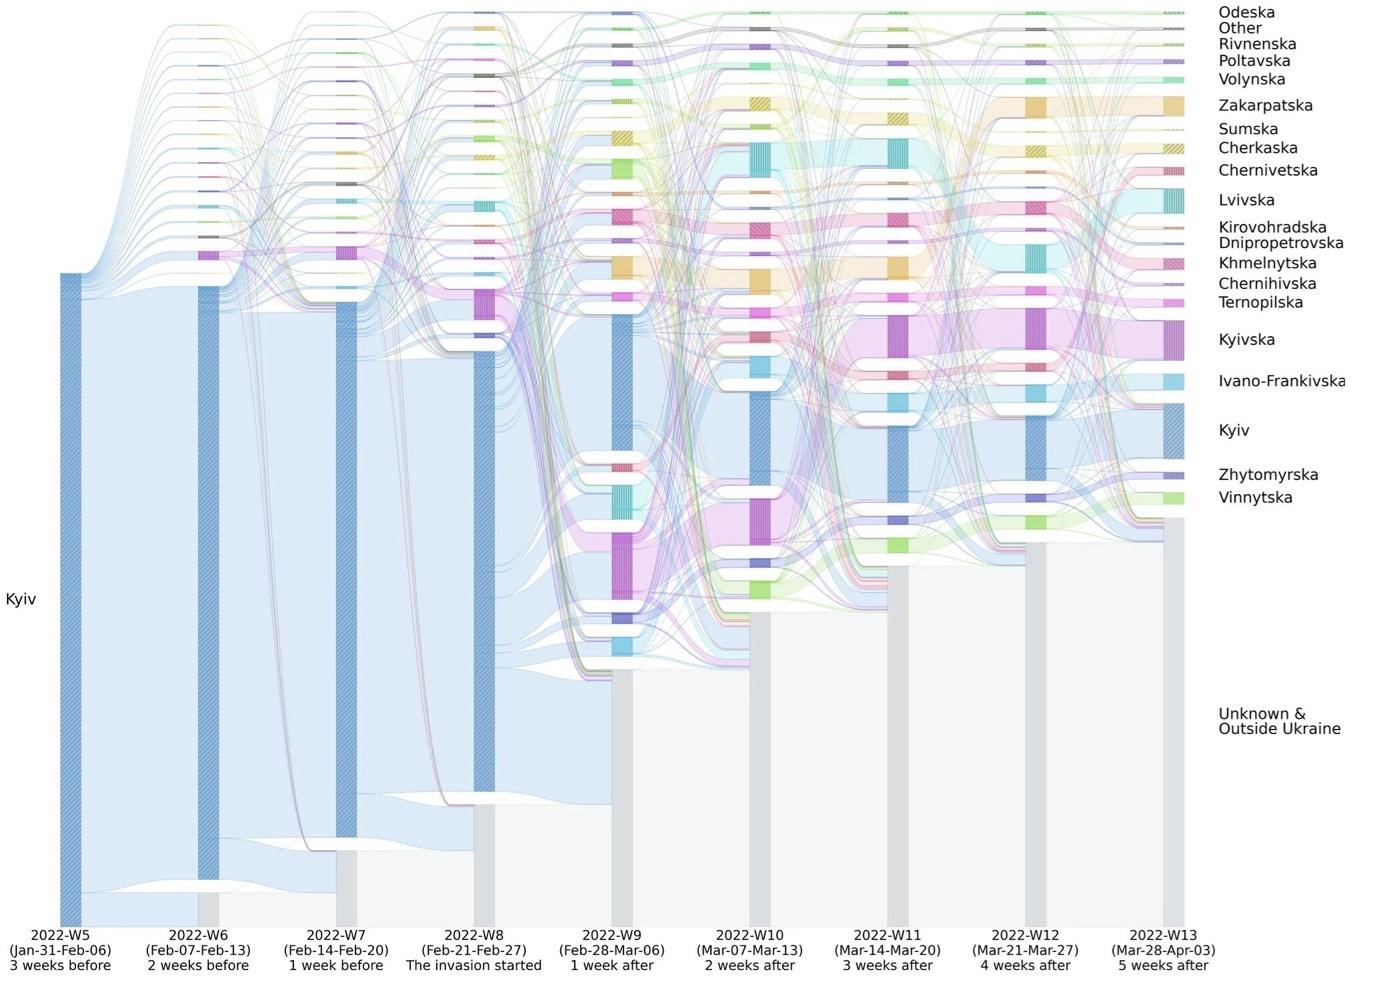
Shibuya and her team had access to a limited dataset which covered the period a few weeks before and a few weeks after the initial invasion on Feb. 24, 2022. This data contained more than 9 million location records from more than 100,000 anonymous IDPs who opted in to share their location data.

“From these records, we could estimate people’s home locations at the regional level based on regular patterns in advance of the invasion. To make sure this limited data could be used to represent the entire population, we compared our estimates to survey data from the International Organization for Migration of the U.N.,” said Shibuya.

“From there, we looked at when and where people moved just prior to and for some time after the invasion began. The majority of IDPs were from the capital, Kyiv, and some people left as early as five weeks before Feb. 24, perhaps in anticipation, though it was two weeks after that day that four times as many people left. However, a week later still, there was evidence some people started to return.”

That some people return to afflicted areas is just one factor that confounds population mobility models—in actual fact, people may move between locations, sometimes multiple times. Trying to represent this with a simple map with arrows to show populations could get cluttered fast. Shibuya’s team used color-coded charts to visualize its data, which allow you to see population movements in and out of regions at different times, or dynamic data, in a single image.

“WE want visualizations like these to help humanitarian agencies gauge how to allocate human resources and physical resources like food and medicine. As they tell you about dynamic changes in populations, not just A to B movements, WEthink it could mean aid gets to where it’s needed and when it’s needed more efficiently, reducing waste and overheads,” said Shibuya.

“Another thing we found that could be useful is that people’s migration patterns vary, and socioeconomic status seems to be a factor in this. People from more affluent areas tended to move farther from their homes than others. There is demographic diversity and good simulations ought to reflect this diversity and not make too many assumptions.”

The team worked with the World Bank on this study, as the international organization could provide the data necessary for the analyses. They hope to look into other kinds of situations too, such as natural disasters, political conflicts, environmental issues and more. Ultimately, by performing research like this, Shibuya hopes to produce better general models of human behaviour in crisis situations in order to alleviate some of the impacts those situations can create.


For more such insights, log into our website https://international-maths-challenge.com

Credit of the article given to University of Tokyo