What’s Pi Day all about? Math, science, pies and more

Math enthusiasts around the world, from college kids to rocket scientists, celebrate Pi Day on Thursday, which is March 14 or 3/14—the first three digits of an infinite number with many practical uses.

Around the world many people will mark the day with a slice of pie—sweet, savory or even pizza.

Simply put, pi is a mathematical constant that expresses the ratio of a circle’s circumference to its diameter. It is part of many formulas used in physics, astronomy, engineering and other fields, dating back thousands of years to ancient Egypt, Babylon and China.

Pi Day itself dates to 1988, when physicist Larry Shaw began celebrations at the Exploratorium science museum in San Francisco. The holiday didn’t really gain national recognition though until two decades later. In 2009, Congress designated every March 14 to be the big day—to hopefully spur more interest in math and science. Fittingly enough, the day is also Albert Einstein’s birthday.

Here’s a little more about the holiday’s origin and how it’s celebrated today.

WHAT IS PI?

Pi can calculate the circumference of a circle by measuring the diameter—the distance straight across the circle’s middle—and multiplying that by the 3.14-plus number.

It is considered a constant number and it is also infinite, meaning it is mathematically irrational. Long before computers, historic scientists such as Isaac Newton spent many hours calculating decimal places by hand. Today, using sophisticated computers, researchers have come up with trillions of digits for pi, but there is no end.

WHY IS IT CALLED PI?

It wasn’t given its name until 1706, when Welsh mathematician William Jones began using the Greek symbol for the number.

Why that letter? It’s the first Greek letter in the words “periphery” and “perimeter,” and pi is the ratio of a circle’s periphery—or circumference—to its diameter.

WHAT ARE SOME PRACTICAL USES?

The number is key to accurately pointing an antenna toward a satellite. It helps figure out everything from the size of a massive cylinder needed in refinery equipment to the size of paper rolls used in printers.

Pi is also useful in determining the necessary scale of a tank that serves heating and air conditioning systems in buildings of various sizes.

NASA uses pi on a daily basis. It’s key to calculating orbits, the positions of planets and other celestial bodies, elements of rocket propulsion, spacecraft communication and even the correct deployment of parachutes when a vehicle splashes down on Earth or lands on Mars.

Using just nine digits of pi, scientists say it can calculate the Earth’s circumference so accurately it only errs by about a quarter of an inch (0.6 centimeters) for every 25,000 miles (about 40,000 kilometers).

IT’S NOT JUST MATH, THOUGH

Every year the San Francisco museum that coined the holiday organizes events, including a parade around a circular plaque, called the Pi Shrine, 3.14 times—and then, of course, festivities with lots of pie.

Around the country, many events now take place on college campuses. For example, Nova Southeastern University in Florida will hold a series of activities, including a game called “Mental Math Bingo” and event with free pizza (pies)—and for dessert, the requisite pie.

“Every year Pi Day provides us with a way to celebrate math, have some fun and recognize how important math is in all our lives,” said Jason Gershman, chair of NSU’s math department.

At Michele’s Pies in Norwalk, Connecticut, manager Stephen Jarrett said it’s one of their biggest days of the year.

“We have hundreds of pies going out for orders (Thursday) to companies, schools and just individuals,” Jarrett said in an interview. “Pi Day is such a fun, silly holiday because it’s a mathematical number that people love to turn into something fun and something delicious. So people celebrate Pi Day with sweet pies, savory pies, and it’s just an excuse for a little treat.”

NASA has its annual “Pi Day Challenge” online, offering people plenty of games and puzzles, some of them directly from the space agency’s own playbook such as calculating the orbit of an asteroid or the distance a moon rover would need to travel each day to survey a certain lunar area.

WHAT ABOUT EINSTEIN?

Possibly the world’s best-known scientist, Einstein was born on March 14, 1879, in Germany. The infinite number of pi was used in many of his breakthrough theories and now Pi Day gives the world another reason to celebrate his achievements.

In a bit of math symmetry, famed physicist Stephen Hawking died on March 14, 2018, at age 76. Still, pi is not a perfect number. He once had this to say,

“One of the basic rules of the universe is that nothing is perfect. Perfection simply doesn’t exist. Without imperfection, neither you nor I would exist.”


For more such insights, log into our website https://international-maths-challenge.com

Credit of the article given to Curt Anderson


Paper offers a mathematical approach to modeling a random walker moving across a random landscape

Tiny particles like pollen grains move constantly, pushed and pulled by environmental forces. To study this motion, physicists use a “random walk” model—a system in which every step is determined by a random process. Random walks are useful for studying everything from tiny physics to diffusion to financial markets.

But what if the environment itself—and not just the walker—is random? “We can think of a town in which the elevation undulates in a random way, with the walker more likely to step downhill rather than uphill,” says physicist and SFI Professor Sidney Redner.

A fundamental question in this scenario, he says, is to determine the time for the system to move from one arbitrary point to another. This quantity is called the “first-passage time,” and researchers have solved it in one dimension, albeit using cumbersome calculations.

In a paper published in Physical Review E, Redner, together with SFI Program Postdoctoral Fellow James Holehouse, introduced a new way to efficiently determine all possible first-passage times and their probabilities. Their approach, which relies on heady math, captures the randomness of both the walker and the environment.

In the paper, they describe how to compute a “moment generating function”—a kind of mathematical machine for providing complete statistical information about the distribution of first-passage times.

Their approach could improve predictive analyses in a wide range of processes influenced by randomness, from changing biological populations to migration systems to the dynamics of financial instruments used to study markets. It builds on ideas that Redner first described in his 2001 book “A Guide to First Passage Processes” (and for which he’s preparing a second edition.)

Researchers typically approach first-passage problems using enormous simulations, which start with initial systems and run through time to predict the time to reach a certain state. “But simulations are a really poor way to study [these systems],” Holehouse says.

Redner adds, “If you simulate some of these systems, you’re guaranteed to get the wrong answer because you need to simulate so many instances of the system that to see the right answer would require a computation time that is beyond the age of the universe.”

For more such insights, log into our website https://international-maths-challenge.com

Credit of the article given to Santa Fe Institute


How do neural networks learn? A mathematical formula explains how they detect relevant patterns

Neural networks have been powering breakthroughs in artificial intelligence, including the large language models that are now being used in a wide range of applications, from finance, to human resources to health care. But these networks remain a black box whose inner workings engineers and scientists struggle to understand.

Now, a team led by data and computer scientists at the University of California San Diego has given neural networks the equivalent of an X-ray to uncover how they actually learn.

The researchers found that a formula used in statistical analysis provides a streamlined mathematical description of how neural networks, such as GPT-2, a precursor to ChatGPT, learn relevant patterns in data, known as features. This formula also explains how neural networks use these relevant patterns to make predictions.

“We are trying to understand neural networks from first principles,” said Daniel Beaglehole, a Ph.D. student in the UC San Diego Department of Computer Science and Engineering and co-first author of the study. “With our formula, one can simply interpret which features the network is using to make predictions.”

The team present their findings in the journal Science.

Why does this matter? AI-powered tools are now pervasive in everyday life. Banks use them to approve loans. Hospitals use them to analyse medical data, such as X-rays and MRIs. Companies use them to screen job applicants. But it’s currently difficult to understand the mechanism neural networks use to make decisions and the biases in the training data that might impact this.

“If you don’t understand how neural networks learn, it’s very hard to establish whether neural networks produce reliable, accurate, and appropriate responses,” said Mikhail Belkin, the paper’s corresponding author and a professor at the UC San Diego Halicioglu Data Science Institute. “This is particularly significant given the rapid recent growth of machine learning and neural net technology.”

The study is part of a larger effort in Belkin’s research group to develop a mathematical theory that explains how neural networks work. “Technology has outpaced theory by a huge amount,” he said. “We need to catch up.”

The team also showed that the statistical formula they used to understand how neural networks learn, known as Average Gradient Outer Product (AGOP), could be applied to improve performance and efficiency in other types of machine learning architectures that do not include neural networks.

“If we understand the underlying mechanisms that drive neural networks, we should be able to build machine learning models that are simpler, more efficient and more interpretable,” Belkin said. “We hope this will help democratize AI.”

The machine learning systems that Belkin envisions would need less computational power, and therefore less power from the grid, to function. These systems also would be less complex and so easier to understand.

Illustrating the new findings with an example

(Artificial) neural networks are computational tools to learn relationships between data characteristics (i.e. identifying specific objects or faces in an image). One example of a task is determining whether in a new image a person is wearing glasses or not. Machine learning approaches this problem by providing the neural network many example (training) images labeled as images of “a person wearing glasses” or “a person not wearing glasses.”

The neural network learns the relationship between images and their labels, and extracts data patterns, or features, that it needs to focus on to make a determination. One of the reasons AI systems are considered a black box is because it is often difficult to describe mathematically what criteria the systems are actually using to make their predictions, including potential biases. The new work provides a simple mathematical explanation for how the systems are learning these features.

Features are relevant patterns in the data. In the example above, there are a wide range of features that the neural networks learns, and then uses, to determine if in fact a person in a photograph is wearing glasses or not.

One feature it would need to pay attention to for this task is the upper part of the face. Other features could be the eye or the nose area where glasses often rest. The network selectively pays attention to the features that it learns are relevant and then discards the other parts of the image, such as the lower part of the face, the hair and so on.

Feature learning is the ability to recognize relevant patterns in data and then use those patterns to make predictions. In the glasses example, the network learns to pay attention to the upper part of the face. In the new Science paper, the researchers identified a statistical formula that describes how the neural networks are learning features.

Alternative neural network architectures: The researchers went on to show that inserting this formula into computing systems that do not rely on neural networks allowed these systems to learn faster and more efficiently.

“How do I ignore what’s not necessary? Humans are good at this,” said Belkin. “Machines are doing the same thing. Large Language Models, for example, are implementing this ‘selective paying attention’ and we haven’t known how they do it. In our Science paper, we present a mechanism explaining at least some of how the neural nets are ‘selectively paying attention.'”

For more such insights, log into our website https://international-maths-challenge.com

Credit of the article given to University of California – San Diego


Drawings of mathematical problems predict their resolution

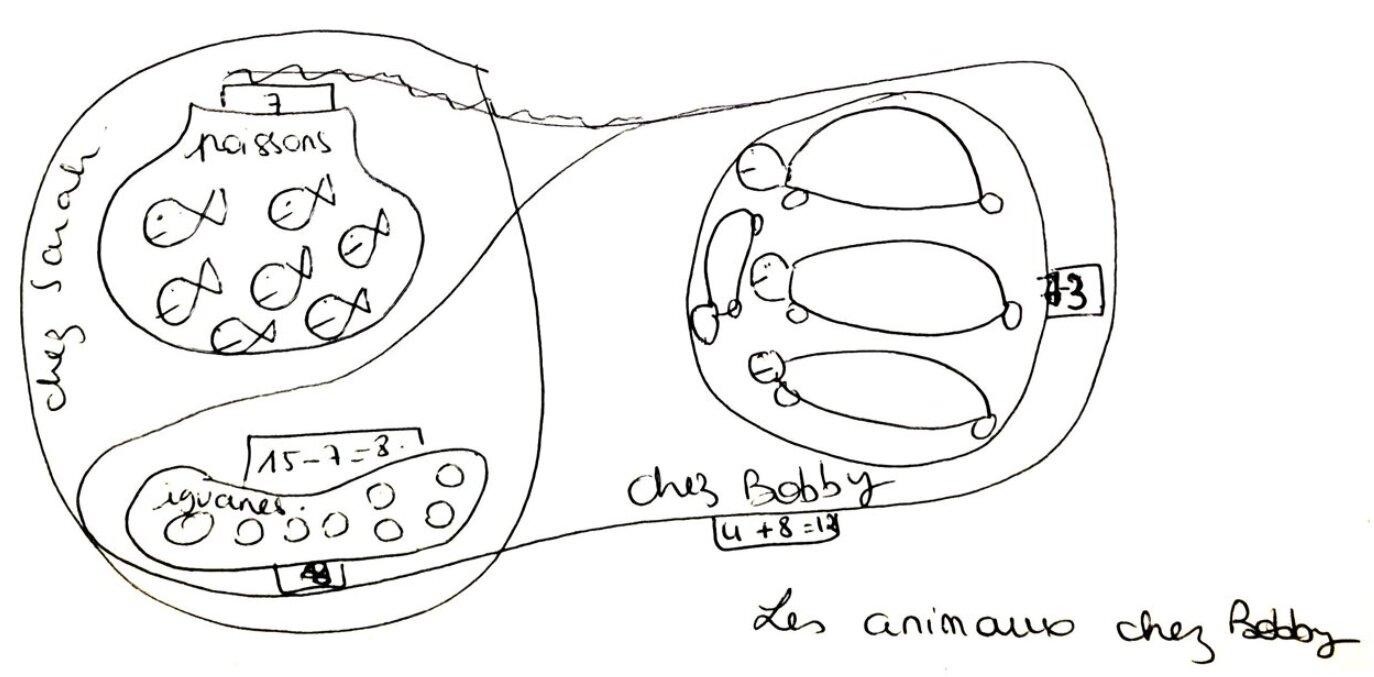
A team from the University of Geneva (UNIGE), in collaboration with CY Cergy Paris University (CYU) and University of Burgundy (uB), have analysed drawings made by children and adults when solving simple problems. The scientists found that, whatever the age of the participant, the most effective calculation strategies were associated with certain drawing typologies.

These results, published in the journal Memory & Cognition, open up new perspectives for the teaching of mathematics.

Learning mathematics often involves small problems, linked to concrete everyday situations. For example, pupils have to add up quantities of flour to make a recipe or subtract sums of money to find out what’s left in their wallets after shopping. They are thus led to translate statements into algorithmic procedures to find the solution.

This translation of words into solving strategies involves a stage of mental representation of mathematical information, such as numbers or the arithmetic operation to be performed, and non-mathematical information, such as the context of the problem.

The cardinal or ordinal dimensions of problems

Having a clearer idea of these mental representations would enable a better understanding of the choice of calculation strategies. Scientists from UNIGE, CYU and uB conducted a study with 10-year-old children and adults, asking them to solve simple problems with the instruction to use as few calculation steps as possible.

The participants were then asked to produce a drawing or diagram explaining their problem-solving strategy for each statement. The contexts of some problems called on the cardinal properties of numbers—the quantity of elements in a set—others on their ordinal properties—their position in an ordered list.

The former involved marbles, fishes, or books, for example: “Paul has 8 red marbles. He also has blue marbles. In total, Paul has 11 marbles. Jolene has as many blue marbles as Paul, and some green marbles. She has 2 green marbles less than Paul has red marbles. In total, how many marbles does Jolene have?”

The latter involved lengths or durations, for example: “Sofia traveled for 8 hours. Her trip started during the day. Sofia arrived at 11. Fred leaves at the same time as Sofia. Fred’s trip lasted 2 hours less than Sofia’s. What time was it when Fred arrived?”

Both of the above problems share the same mathematical structure, and both can be solved by a long strategy in 3 steps: 11–8 = 3; 8–2 = 6; 6 + 3 = 9, but also in a single calculation: 11–2 = 9, using a simple subtraction. However, the mental representations of these problems are very different, and the researchers wanted to determine whether the type of representations could predict the calculation strategy, in 1 or 3 steps, of those who solve them.

‘”Our hypothesis was that cardinal problems—such as the one involving marbles—would inspire cardinal drawings, i.e., diagrams with identical individual elements, such as crosses or circles, or with overlaps of elements in sets or subsets.

“Similarly, we assumed that ordinal problems—such as the one mentioning travel times—would lead to ordinal representations, i.e., diagrams with axes, graduations or intervals—and that these ordinal drawings would reflect participants’ representations and indicate that they would be more successful in identifying the one-step solution strategy,” explains Hippolyte Gros, former post-doctoral fellow at UNIGE’s Faculty of Psychology and Educational Sciences, associate professor at CYU, and first author of the study.

Identifying mental representations through drawings

These hypotheses were validated by analysing the drawings of 52 adults and 59 children. “We have shown that, irrespective of their experience—since the same results were obtained in both children and adults—the use of strategies by the participants depends on their representation of the problem, and that this is influenced by the non-mathematical information contained in the problem statement, as revealed by their drawings,” says Emmanuel Sander, full professor at the UNIGE’s Faculty of Psychology and Educational Sciences.

“Our study also shows that, even after years of experience in solving addition and subtraction, the difference between cardinal and ordinal problems remains very marked. The majority of participants were only able to solve problems of the second type in a single step.”

Improving mathematical learning through drawing analysis

The team also noted that drawings showing ordinal representations were more frequently associated with a one-step solution, even if the problem was cardinal. In other words, drawing with a scale or an axis is linked to the choice of the fastest calculation.

“From a pedagogical point of view, this suggests that the presence of specific features in a student’s drawing may or may not indicate that his or her representation of the problem is the most efficient one for meeting the instructions—in this case, solving with the fewest calculations possible,” observes Jean-Pierre Thibaut, full professor at the uB Laboratory for Research on Learning and Development.

“Thus, when it comes to subtracting individual elements, a representation via an axis—rather than via subsets—is more effective in finding the fastest method. Analysis of students’ drawings in arithmetic can therefore enable targeted intervention to help them translate problems into more optimal representations. One way of doing this is to work on the graphical representation of statements in class, to help students understand the most direct strategies,” concludes Gros.

For more such insights, log into our website https://international-maths-challenge.com

Credit of the article given to University of Geneva.


NASA Pi Day challenge serves up a mathematical marvel

March 14 marks the annual celebration of the mathematical constant pi, aka the Greek letter π. Its infinite number of digits is usually rounded to 3.14, hence the date of Pi Day. For some people, the occasion marks an annual excuse to eat pizza or pie (or both), but to truly honour this wondrously useful number, a serving of mathematics is in order, too. NASA is here to help.

Continuing a decade-long tradition, the Education Office at the agency’s Jet Propulsion Laboratory has cooked up a set of illustrated math problems involving real-life NASA science and engineering.

With the NASA Pi Day Challenge, students can use the mathematical constant to:

  • determine where the DSOC (Deep Space Optical Communications) technology demonstration aboard NASA’s Psyche spacecraft should aim a laser message containing a cat video so that it can reach Earth (and set a NASA record in the process)
  • figure out the change in asteroid Dimorphos’ orbit after NASA intentionally crashed its DART (Double Asteroid Redirection Test) spacecraft into its surface
  • measure how much data will be captured by the NISAR (NASA-ISRO Synthetic Aperture Radar) satellite each time it orbits our planet, monitoring Earth’s land and ice surfaces in unprecedented detail
  • calculate the distance a small rover must drive to map a portion of the lunar surface as part of NASA’s CADRE (Cooperative Autonomous Distributed Robotic Exploration) technology demonstration that’s headed to the moon

Answers to all four challenge questions will be available on March 15.

The NASA Pi Day Challenge is accompanied by other pi-related resources for educators, K-12 students, and parents, including lessons and teachable moments, downloadable posters, and illustrated web/mobile backgrounds. More than 40 puzzlers from previous challenges are also available.

For more such insights, log into our website https://international-maths-challenge.com

Credit of the article given to NASA


These 7 Mathematical Facts Will Blow Your Mind

What better way is there to celebrate pi day than with a slice of mathematics? Here are 7 mathematical facts to enjoy.

There’s a mathematical trick to get out of any maze

It will soon be 14 March and that means pi day. We like to mark this annual celebration of the great mathematical constant at New Scientist by remembering some of our favourite recent stories from the world of mathematics. We have extracted a list of surprising facts from them to whet your appetite, but for the full pi day feast click through for the entire articles. These are normally only available to subscribers but to honour the world’s circumferences and diameters we have decided to make them free for a limited time.

The world’s best kitchen tile

There is a shape called “the hat” that can completely cover a surface without ever creating a repeating pattern. For decades, mathematicians had wondered whether a single tile existed that could do such a thing. Roger Penrose discovered pairs of tiles in the 1970s that could do the job but nobody could find a single tile that when laid out would have the same effect. That changed when the hat was discovered last year.

Why you’re so unique

You are one in a million. Or really, it should be 1 in a 1010^68.  This number, dubbed the doppelgängion by mathematician Antonio Padilla, is so large it is hard to wrap your head around. It is 1 followed by 100 million trillion trillion trillion trillion trillion zeroes and relates to the chances of finding an exact you somewhere else in the universe. Imagining a number of that size is so difficult that the quantum physics required to calculate it seems almost easy in comparison. There are only a finite number of quantum states that can exist in a you-sized portion of space. You reach the doppelgängion by adding them all up. Padilla also wrote about four other mind-blowing numbers for New Scientist. Here they all are.

An amazing trick

There is a simple mathematical trick that will get you out of any maze: always turn right. No matter how complicated the maze, how many twists, turns and dead ends there are, the method always works. Now you know the trick, can you work out why it always leads to success?

And the next number is

There is a sequence of numbers so difficult to calculate that mathematicians have only just found the ninth in the series and it may be impossible to calculate the tenth. These numbers are called Dedekind numbers after mathematician Richard Dedekind and describe the number of possible ways a set of logical operations can be combined. When the set contains just a few elements, calculating the corresponding Dedekind number is relatively straightforward, but as the number of elements increases, the Dedekind number grows at “double exponential speed”. Number nine in the series is 42 digits long and took a month of calculation to find.

Can’t see the forest for the TREE(3)

There is a number so big that in can’t fit in the universe. TREE(3) comes from a simple mathematical game. The game involves generating a forest of trees using different combinations of seeds according to a few simple rules. If you have one type of seed, the largest forest allowed can have one tree. For two types of seed, the largest forest is three trees. But for three types of seed, well, the largest forest has TREE(3) trees, a number that is just too big for the universe.

The language of the universe

There is a system of eight-dimensional numbers called octonions that physicists are trying to use to mathematically describe the universe. The best way to understand octonions is first to consider taking the square root of -1. There is no such number that is the result of that calculation among the real numbers (which includes all the counting numbers, fractions, numbers like pi, etc.), so mathematicians add another called i. When combined with the real numbers, this gives a system called the complex numbers, which consist of a real part and an “imaginary part”, such as 3+7i. In other words, it is two-dimensional. Octonions arise by continuing to build up the system until you get to eight dimensions. It isn’t just mathematical fun and games though – there is reason to believe that octonions may be the number system we need to understand the laws of nature.

So many new solutions

Mathematicians went looking for solutions to the three-body problem and found 12,000 of them. The three-body problem is a classic astronomy problem of how three objects can form a stable orbit around each other. Such an arrangement is described by Isaac Newton’s laws of motion but actually finding permissible solutions is incredibly difficult. In 2007, mathematicians managed to find 1223 new solutions to the problem but this was greatly surpassed last year when a team found more than 12,000 more.

For more such insights, log into www.international-maths-challenge.com.

*Credit for article given to Timothy Revell*


How The Maths Behind Honeycombs Can Help You Work A Jigsaw Puzzle

Maths tells us the best way to cover a surface with copies of a shape – even when it comes to jigsaw puzzles, says Katie Steckles.

WHAT do a bathroom wall, a honeycomb and a jigsaw puzzle have in common? Obviously, the answer is mathematics.

If you are trying to cover a surface with copies of a shape – say, for example, you are tiling a bathroom – you ideally want a shape like a square or rectangle. They will cover the whole surface with no gaps, which is why these boring shapes get used as wall tiles so often.

But if your shapes don’t fit together exactly, you can still try to get the best coverage possible by arranging them in an efficient way.

Imagine trying to cover a surface with circular coins. The roundness of the circles means there will be gaps between them. For example, we could use a square grid, placing the coins on the intersections. This will cover about 78.5 per cent of the area.

But this isn’t the most efficient way: in 1773, mathematician Joseph-Louis Lagrange showed that the optimal arrangement of circles involves a hexagonal grid, like the cells in a regular honeycomb – neat rows where each circle sits nestled between the two below it.

In this situation, the circles will cover around 90.7 per cent of the space, which is the best you can achieve with this shape. If you ever need to cover a surface with same-size circles, or pack identical round things into a tray, the hexagon arrangement is the way to go.

But this isn’t just useful knowledge if you are a bee: a recent research paper used this hexagonal arrangement to figure out the optimal size table for working a jigsaw puzzle. The researchers calculated how much space would be needed to lay out the pieces of an unsolved jigsaw puzzle, relative to the solved version. Puzzle pieces aren’t circular, but they can be in any orientation and the tabs sticking out stop them from moving closer together, so each takes up a theoretically circular space on the table.

By comparing the size of the central rectangular section of the jigsaw piece to the area it would take up in the hexagonal arrangement, the paper concluded that an unsolved puzzle takes up around 1.73 times as much space.

This is the square root of three (√3), a number with close connections to the regular hexagon – one with a side length of 1 will have a height of √3. Consequently, there is also a √3 in the formula for the hexagon’s area, which is 3/2 × √3 × s2, where s is the length of a side. This is partly why it pops out, after some fortuitous cancellation, as the answer here.

So if you know the dimensions of a completed jigsaw puzzle, you can figure out what size table you need to lay out all the pieces: multiply the width and height, then multiply that by 1.73. For this ingenious insight, we can thank the bees.

For more such insights, log into www.international-maths-challenge.com.

*Credit for article given to Katie Steckles*


Mathematicians prove Pólya’s conjecture for the eigenvalues of a disk, a 70-year-old math problem

Is it possible to deduce the shape of a drum from the sounds it makes? This is the kind of question that Iosif Polterovich, a professor in the Department of Mathematics and Statistics at Université de Montréal, likes to ask. Polterovich uses spectral geometry, a branch of mathematics, to understand physical phenomena involving wave propagation.

Last summer, Polterovich and his international collaborators—Nikolay Filonov, Michael Levitin and David Sher—proved a special case of a famous conjecture in spectral geometry formulated in 1954 by the eminent Hungarian-American mathematician George Pólya.

The conjecture bears on the estimation of the frequencies of a round drum or, in mathematical terms, the eigenvalues of a disk.

Pólya himself confirmed his conjecture in 1961 for domains that tile a plane, such as triangles and rectangles. Until last year, the conjecture was known only for these cases. The disk, despite its apparent simplicity, remained elusive.

“Imagine an infinite floor covered with tiles of the same shape that fit together to fill the space,” Polterovich said. “It can be tiled with squares or triangles, but not with disks. A disk is actually not a good shape for tiling.”

The universality of mathematics

In an article published in the mathematical journal Inventiones Mathematicae, the researchers show that Pólya’s conjecture is true for the disk, a case considered particularly challenging.

Though their result is essentially of theoretical value, their proof method has applications in computational mathematics and numerical computation. The authors are now investigating this avenue.

“While mathematics is a fundamental science, it is similar to sports and the arts in some ways,” Polterovich said.

“Trying to prove a long-standing conjecture is a sport. Finding an elegant solution is an art. And in many cases, beautiful mathematical discoveries do turn out to be useful—you just have to find the right application.”

For more such insights, log into our website https://international-maths-challenge.com

Credit of the article to be given Béatrice St-Cyr-Leroux, University of Montreal


New statistical tool to distinguish shared and unique features in data from different sources

When facing a daunting dataset, Principal Component Analysis (PCA), known as PCA, can help distill complexity by finding a few meaningful features that explain the most significant proportion of the data variance.

However, PCA comes with the underlying assumption that all data sources are homogeneous.

The growth in Internet of Things connectivity poses a challenge as the data collected by “clients,” like patients, connected vehicles, sensors, hospitals or cameras, are incredibly heterogeneous. As this increasing array of technologies from smartwatches to manufacturing tools collect monitoring data, a new analytical tool is needed to disentangle heterogeneous data and characterize what is shared and unique across increasingly complex data from multiple sources.

“Identifying meaningful commonalities among these devices poses a significant challenge. Despite extensive research, we found no existing method that can provably extract both interpretable and identifiable shared and unique features from different datasets,” said Raed Al Kontar, an assistant professor of industrial and operations engineering.

To tackle this challenge, the University of Michigan researchers Niaichen Shi and Raed Al Kontar developed a new “personalized PCA,” or PerPCA, method to decouple the shared and unique components from heterogeneous data. The results will be published in the Journal of Machine Learning Research.

“The personalized PCA method leverages low-rank representation learning techniques to accurately identify both shared and unique components with good statistical guarantees,” said Shi, first author of the paper and a doctoral student of industrial and operations engineering.

“As a simple method that can effectively identify shared and unique features, we envision personalized PCA will be helpful in fields including genetics, image signal processing, and even large language models.”

Further increasing its utility, the method can be implemented in a fully federated and distributed manner, meaning that learning can be distributed across different clients, and raw data does not need to be shared; only the shared (and not unique) features are communicated across the clients.

“This can enhance data privacy and save communication and storage costs,” said Al Kontar.

With personalized PCA, different clients can collaboratively build strong statistical models despite the considerable differences in their data. The extracted shared and unique features encode rich information for downstream analytics, including clustering, classification, or anomaly detection.

The researchers demonstrated the method’s capabilities by effectively extracting key topics from 13 different data sets of U.S. presidential debate transcriptions from 1960 to 2020. They were able to discern shared and unique debate topics and keywords.

Personalized PCA leverages linear features that are readily interpretable by practitioners, further enhancing its use in new applications.

For more such insights, log into our website https://international-maths-challenge.com

Credit of the article to be given Patricia DeLacey, University of Michigan College of Engineering


Understanding how the brain works can transform how school students learn maths

School mathematics teaching is stuck in the past. An adult revisiting the school that they attended as a child would see only superficial changes from what they experienced themselves.

Yes, in some schools they might see a room full of electronic tablets, or the teacher using a touch-sensitive, interactive whiteboard. But if we zoom in on the details – the tasks that students are actually being given to help them make sense of the subject – things have hardly changed at all.

We’ve learnt a huge amount in recent years about cognitive science – how our brains work and how people learn most effectively. This understanding has the potential to revolutionise what teachers do in classrooms. But the design of mathematics teaching materials, such as textbooks, has benefited very little from this knowledge.

Some of this knowledge is counter-intuitive, and therefore unlikely to be applied unless done so deliberately. What learners prefer to experience, and what teachers think is likely to be most effective, often isn’t what will help the most.

For example, cognitive science tells us that practising similar kinds of tasks all together generally leads to less effective learning than mixing up tasks that require different approaches.

In mathematics, practising similar tasks together could be a page of questions each of which requires addition of fractions. Mixing things up might involve bringing together fractions, probability and equations in immediate succession.

Learners make more mistakes when doing mixed exercises, and are likely to feel frustrated by this. Grouping similar tasks together is therefore likely to be much easier for the teacher to manage. But the mixed exercises give the learner important practice at deciding what method they need to use for each question. This means that more knowledge is retained afterwards, making this what is known as a “desirable difficulty”.

Cognitive science applied

We are just now beginning to apply findings like this from cognitive science to design better teaching materials and to support teachers in using them. Focusing on school mathematics makes sense because mathematics is a compulsory subject which many people find difficult to learn.

Typically, school teaching materials are chosen by gut reactions. A head of department looks at a new textbook scheme and, based on their experience, chooses whatever seems best to them. What else can they be expected to do? But even the best materials on offer are generally not designed with cognitive science principles such as “desirable difficulties” in mind.

My colleagues and I have been researching educational designthat applies principles from cognitive science to mathematics teaching, and are developing materials for schools. These materials are not designed to look easy, but to include “desirable difficulties”.

They are not divided up into individual lessons, because this pushes the teacher towards moving on when the clock says so, regardless of student needs. Being responsive to students’ developing understanding and difficulties requires materials designed according to the size of the ideas, rather than what will fit conveniently onto a double-page spread of a textbook or into a 40-minute class period.

Switching things up

Taking an approach led by cognitive science also means changing how mathematical concepts are explained. For instance, diagrams have always been a prominent feature of mathematics teaching, but often they are used haphazardly, based on the teacher’s personal preference. In textbooks they are highly restricted, due to space constraints.

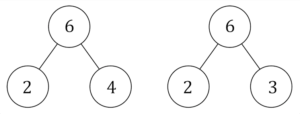
Often, similar-looking diagrams are used in different topics and for very different purposes, leading to confusion. For example, three circles connected as shown below can indicate partitioning into a sum (the “part-whole model”) or a product of prime factors.

These involve two very different operations, but are frequently represented by the same diagram. Using the same kind of diagram to represent conflicting operations (addition and multiplication) leads to learners muddling them up and becoming confused.

Number diagrams showing numbers that add together to make six and numbers that multiply to make six. Colin Foster

The “coherence principle” from cognitive science means avoiding diagrams where their drawbacks outweigh their benefits, and using diagrams and animations in a purposeful, consistent way across topics.

For example, number lines can be introduced at a young age and incorporated across many topic areas to bring coherence to students’ developing understanding of number. Number lines can be used to solve equations and also to represent probabilities, for instance.

Unlike with the circle diagrams above, the uses of number lines shown below don’t conflict but reinforce each other. In each case, positions on the number line represent numbers, from zero on the left, increasing to the right.

A number line used to solve an equation. Colin Foster

A number line used to show probability. Colin Foster

There are disturbing inequalities in the learning of mathematics, with students from poorer backgrounds underachieving relative to their wealthier peers. There is also a huge gender participation gap in maths, at A-level and beyond, which is taken by far more boys than girls.

Socio-economically advantaged families have always been able to buy their children out of difficulties by using private tutors, but less privileged families cannot. Better-quality teaching materials, based on insights from cognitive science, mitigate the impact for students who have traditionally been disadvantaged by gender, race or financial background in the learning of mathematics.

For more such insights, log into our website https://international-maths-challenge.com

Credit of the article given to SrideeStudio/Shutterstock