Time to abandon null hypothesis significance testing? Moving beyond the default approach

Researchers from Northwestern University, University of Pennsylvania, and University of Colorado published a new Journal of Marketing study that proposes abandoning null hypothesis significance testing (NHST) as the default approach to statistical analysis and reporting.

The study is titled “‘Statistical Significance’ and Statistical Reporting: Moving Beyond Binary” and is authored by Blakeley B. McShane, Eric T. Bradlow, John G. Lynch, Jr., and Robert J. Meyer.

Null hypothesis significance testing (NHST) is the default approach to statistical analysis and reporting in marketing and, more broadly, in the biomedical and social sciences. As practiced, NHST involves

  1. assuming that the intervention under investigation has no effect along with other assumptions,
  2. computing a statistical measure known as a P-value based on these assumptions, and
  3. comparing the computed P-value to the arbitrary threshold value of 0.05.

If the P-value is less than 0.05, the effect is declared “statistically significant,” the assumption of no effect is rejected, and it is concluded that the intervention has an effect in the real world. If the P-value is above 0.05, the effect is declared “statistically nonsignificant,” the assumption of no effect is not rejected, and it is concluded that the intervention has no effect in the real world.

Criticisms of NHST

Despite its default role, NHST has long been criticized by both statisticians and applied researchers, including those within marketing. The most prominent criticisms relate to the dichotomization of results into “statistically significant” and “statistically nonsignificant.”

For example, authors, editors, and reviewers use “statistical (non)significance” as a filter to select which results to publish. Meyer says that “this creates a distorted literature because the effects of published interventions are biased upward in magnitude. It also encourages harmful research practices that yield results that attain so-called statistical significance.”

Lynch adds that “NHST has no basis because no intervention has precisely zero effect in the real world and small P-values and ‘statistical significance’ are guaranteed with sufficient sample sizes. Put differently, there is no need to reject a hypothesis of zero effect when it is already known to be false.”

Perhaps the most widespread abuse of statistics is to ascertain where some statistical measure such as a P-value stands relative to 0.05 and take it as a basis to declare “statistical (non)significance” and to make general and certain conclusions from a single study.

“Single studies are never definitive and thus can never demonstrate an effect or no effect. The aim of studies should be to report results in an unfiltered manner so that they can later be used to make more general conclusions based on cumulative evidence from multiple studies. NHST leads researchers to wrongly make general and certain conclusions and to wrongly filter results,” says Bradlow.

P-values naturally vary a great deal from study to study,” explains McShane. As an example, a “statistically significant” original study with an observed P-value of p = 0.005 (far below the 0.05 threshold) and a “statistically nonsignificant” replication study with an observed P-value of p = 0.194 (far above the 0.05 threshold) are highly compatible with one another in the sense that the observed P-value, assuming no difference between them, is p= 0.289.

He adds that “however when viewed through the lens of ‘statistical (non)significance,’ these two studies appear categorically different and are thus in contradiction because they are categorized differently.”

Recommended changes to statistical analysis

The authors propose a major transition in statistical analysis and reporting. Specifically, they propose abandoning NHST—and the P-value thresholds intrinsic to it—as the default approach to statistical analysis and reporting. Their recommendations are as follows:

  • “Statistical (non)significance” should never be used as a basis to make general and certain conclusions.
  • “Statistical (non)significance” should also never be used as a filter to select which results to publish.
  • Instead, all studies should be published in some form or another.
  • Reporting should focus on quantifying study results via point and interval estimates. All of the values inside conventional interval estimates are at least reasonably compatible with the data given all of the assumptions used to compute them; therefore, it makes no sense to single out a specific value, such as the null value.
  • General conclusions should be made based on the cumulative evidence from multiple studies.
  • Studies need to treat P-values continuously and as just one factor among many—including prior evidence, the plausibility of mechanism, study design, data quality, and others that vary by research domain—that require joint consideration and holistic integration.
  • Researchers must also respect the fact that such conclusions are necessarily tentative and subject to revision as new studies are conducted.

Decisions are seldom necessary in scientific reporting and are best left to end-users such as managers and clinicians when necessary.

In such cases, they should be made using a decision analysis that integrates the costs, benefits, and probabilities of all possible consequences via a loss function (which typically varies dramatically across stakeholders)—not via arbitrary thresholds applied to statistical summaries such as P-values (“statistical (non)significance”) which, outside of certain specialized applications such as industrial quality control, are insufficient for this purpose.

For more such insights, log into our website https://international-maths-challenge.com

Credit of the article given to American Marketing Association


Tiny Balls Fit Best Inside A Sausage, Physicists Confirm

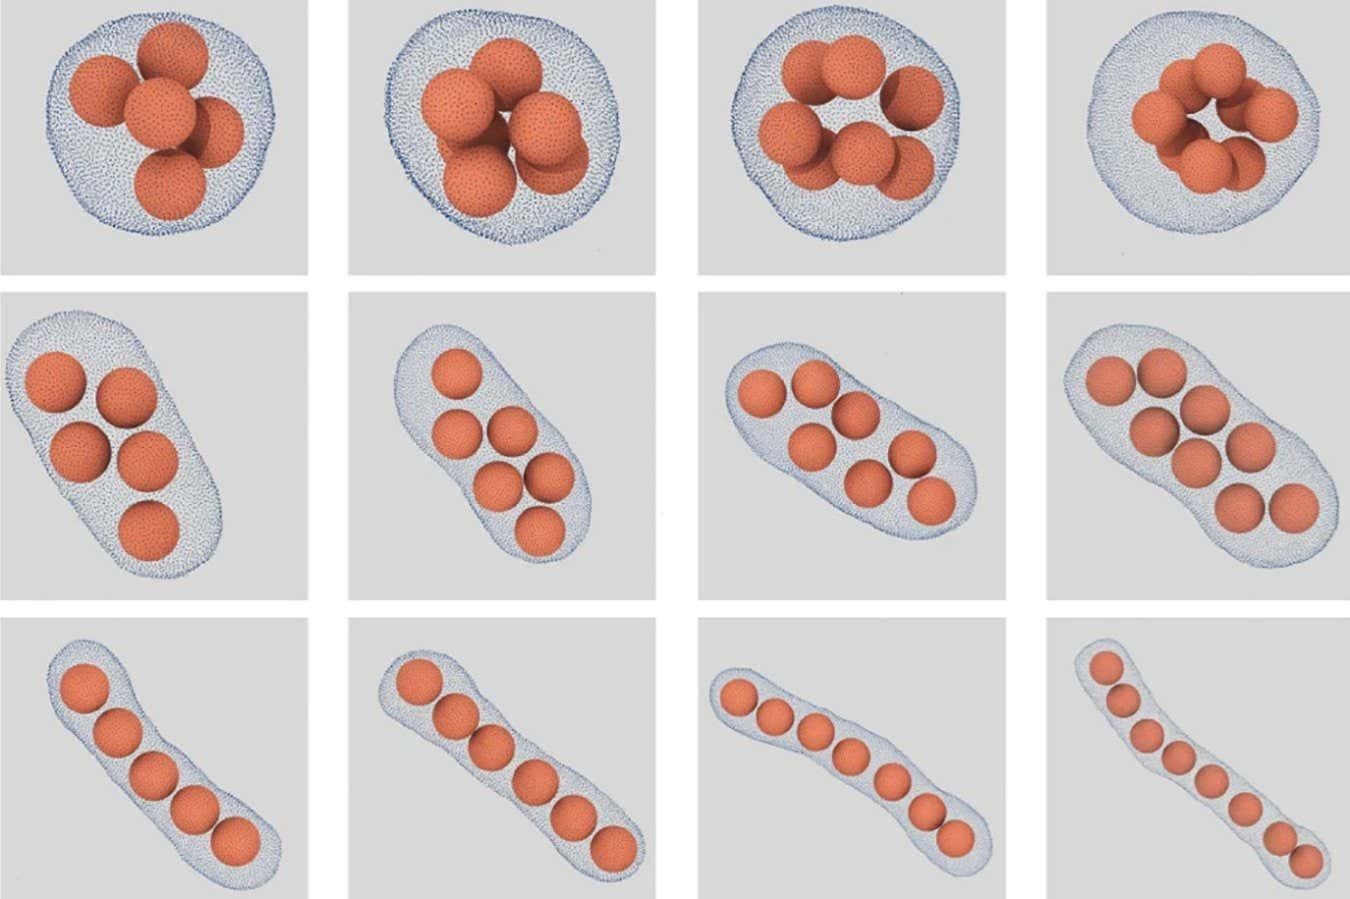
Mathematicians have long been fascinated by the most efficient way of packing spheres in a space, and now physicists have confirmed that the best place to put them is into a sausage shape, at least for small numbers of balls.

Simulations show microscopic plastic balls within a cell membrane

What is the most space-efficient way to pack tennis balls or oranges? Mathematicians have studied this “sphere-packing” problem for centuries, but surprisingly little attention has been paid to replicating the results in the real world. Now, physical experiments involving microscopic plastic balls have confirmed what mathematicians had long suspected – with a small number of balls, it is best to stick them in a sausage.

Kepler was the first person to tackle sphere packing, suggesting in 1611 that a pyramid would be the best way to pack cannonballs for long voyages, but this answer was only fully proven by mathematicians in 2014.

This proof only considers the best way of arranging an infinite number of spheres, however. For finite sphere packings, simply placing the balls in a line, or sausage, is more efficient until there are around 56 spheres. At this point, the balls experience what mathematicians call the “sausage catastrophe” and something closer to pyramid packing becomes more efficient.

But what about back in the real world? Sphere-packing theories assume that the balls are perfectly hard and don’t attract or repel each other, but this is rarely true in real life – think of the squish of a tennis ball or an orange.

One exception is microscopic polystyrene balls, which are very hard and basically inert. Hanumantha Rao Vutukuri at the University of Twente in the Netherlands and his team, who were unaware of mathematical sphere-packing theories, were experimenting with inserting these balls into empty cell membranes and were surprised to find them forming sausages.

“One of my students observed a linear packing, but it was quite puzzling,” says Vutukuri. “We thought that there was some fluke, so he repeated it a couple of times and every time he observed similar results,” says Vutukuri. “I was wondering, ‘why is this happening?’ It’s a bit counterintuitive.”

After reading up on sphere packing, Vutukuri and his team decided to investigate and carried out simulations for different numbers of polystyrene balls in a bag. They then compared their predictions with experiments using up to nine real polystyrene balls that had been squeezed into cell membranes immersed in a liquid solution. They could then shrink-wrap the balls by changing the concentration of the solution, causing the membranes to tighten, and see what formation the balls settled in using a microscope.

“For up to nine spheres, we showed, both experimentally and in simulations, that the sausage is the best packed,” says team member Marjolein Dijkstra at Utrecht University, the Netherlands. With more than nine balls, the membrane became deformed by the pressure of the balls. The team ran simulations for up to 150 balls and reproduced the sausage catastrophe, where it suddenly becomes more efficient to pack things in polyhedrons, with between 56  and 70 balls.

The sausage formation for a small number of balls is unintuitive, says Erich Müller at Imperial College London, but makes sense because of the large surface area of the membrane with respect to the balls at low numbers. “When dimensions become really, really small, then the wall effects become very important,” he says.

The findings could have applications in drug delivery, such as how to most efficiently fit hard antibiotic molecules, like gold, inside cell-like membranes, but the work doesn’t obviously translate at this point, says Müller.


For more such insights, log into www.international-maths-challenge.com.

*Credit for article given to Alex Wilkins*


The first validation of the Lillo Mike Farmer Model on a large financial market dataset

Economics and physics are distinct fields of study, yet some researchers have been bridging the two together to tackle complex economics problems in innovative ways. This resulted in the establishment of an interdisciplinary research field, known as econophysics, which specializes in solving problems rooted in economics using physics theories and experimental methods.

Researchers at Kyoto University carried out an econophysics study aimed at studying financial market behaviour using a statistical physics framework, known as the Lillo, Mike, and Farmer (LMF) model. Their paper, published in Physical Review Letters, outlines the first quantitative validation of a key prediction of this physics model, which the team used to analyse microscopic data containing fluctuations in the Tokyo Stock Exchange market spanning over a period of nine years.

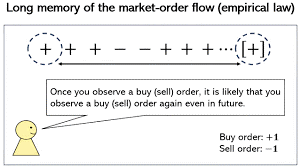
“If you observe the high-frequency financial data, you can find a slight predictability of the order signs regarding buy or sell market orders at a glance,” Kiyoshi Kanazawa, one of the researchers who carried out the study, told Phys.org.

“Lillo, Mike, and Farmer hypothetically modeled this appealing character in 2005, but the empirical validation of their model was absent due to a lack of large, microscopic datasets. We decided to solve this long-standing problem in econophysics by analysing large, microscopic data.”

The LMF model is a simple statistical physics model that describes so-called order-splitting behaviour. A key prediction of this model is that the order of signs representing buy or sell orders in the stock market is associated with the microscopic distribution of metaorders.

This hypothesis has been largely debated within the field of econophysics. So far, validating it was unfeasible, as it required large microscopic datasets representing financial market behaviour over the course of several years and with high resolution.

“The first key aspect of our study is that we used a large, microscopic dataset of the Tokyo Stock Exchange,” Kanazawa said. “Without such a unique dataset, it is challenging to validate the LMF model’s hypothesis. The second key point for us was to remove the statistical bias due to the long-memory character of the market-order flow. While statistical estimation is challenging regarding long-memory processes, we did our best to remove such biases using computational statistical methods.”

Kanazawa and his colleagues were the first to perform a quantitative test of the LMF model on a large microscopic financial market dataset. Notably, the results of their analyses were aligned with this model’s predictions, thus highlighting its promise for tackling economic problems and studying the financial market’s microstructure.

“Our work shows that the long memory in the market-order flows has microscopic information about the latent market demand, which might be used for designing new metrics for liquidity measurements,” Kanazawa said.

“We showed that the quantitative power of statistical physics in clarifying financial market behaviour with large, microscopic datasets. By analysing this microscopic dataset further, we would now like to establish a unifying theory of financial market microstructure parallel to the statistical physics programs from microscopic dynamics.”

For more such insights, log into our website https://international-maths-challenge.com

Credit of the article given to Ingrid Fadelli , Phys.org


AI can teach math teachers how to improve student skills

When middle school math teachers completed an online professional development program that uses artificial intelligence to improve their math knowledge and teaching skills, their students’ math performance improved.

My colleagues and I developed this online professional development program, which relies on a virtual facilitator that can—among other things—present problems to the teacher around teaching math and provide feedback on the teacher’s answers.

Our goal was to enhance teachers’ mastery of knowledge and skills required to teach math effectively. These include understanding why the mathematical rules and procedures taught in school work. The program also focuses on common struggles students have as they learn a particular math concept and how to use instructional tools and strategies to help them overcome these struggles.

We then conducted an experiment in which 53 middle school math teachers were randomly assigned to either this AI-based professional development or no additional training. On average, teachers spent 11 hours to complete the program. We then gave 1,727 of their students a math test. While students of these two groups of teachers started off with no difference in their math performance, the students taught by teachers who completed the program increased their mathematics performance by 0.18 of a standard deviation more on average. This is a statistically significant gain that is equal to the average math performance difference between sixth and seventh graders in the study.

Why it matters

This study demonstrates the potential for using AI technologies to create effective, widely accessible professional development for teachers. This is important because teachers often have limited access to high-quality professional development programs to improve their knowledge and teaching skills. Time conflicts or living in rural areas that are far from in-person professional development programs can prevent teachers from receiving the support they need.

Additionally, many existing in-person professional development programs for teachers have been shown to enhance participants’ teaching knowledge and practices but to have little impact on student achievement.

Effective professional development programs include opportunities for teachers to solve problems, analyse students’ work and observe teaching practices. Teachers also receive real-time support from the program facilitators. This is often a challenge for asynchronous online programs.

Our program addresses the limitations of asynchronous programs because the AI-supported virtual facilitator acts as a human instructor. It gives teachers authentic teaching activities to work on, asks questions to gauge their understanding and provides real-time feedback and guidance.

What’s next

Advancements in AI technologies will allow researchers to develop more interactive, personalized learning environments for teachers. For example, the language processing systems used in generative AI programs such as ChatGPT can improve the ability of these programs to analyse teachers’ responses more accurately and provide more personalized learning opportunities. Also, AI technologies can be used to develop new learning materials so that programs similar to ours can be developed faster.

More importantly, AI-based professional development programs can collect rich, real-time interaction data. Such data makes it possible to investigate how learning from professional development occurs and therefore how programs can be made more effective. Despite billions of dollars being spent each year on professional development for teachers, research suggests that how teachers learn through professional development is not yet well understood.

For more such insights, log into our website https://international-maths-challenge.com

Credit of the article given to Yasemin Copur-Gencturk, The Conversation


New math approach provides insight into memory formation

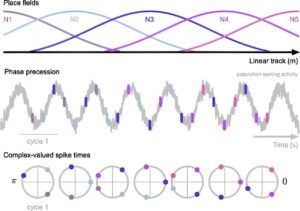
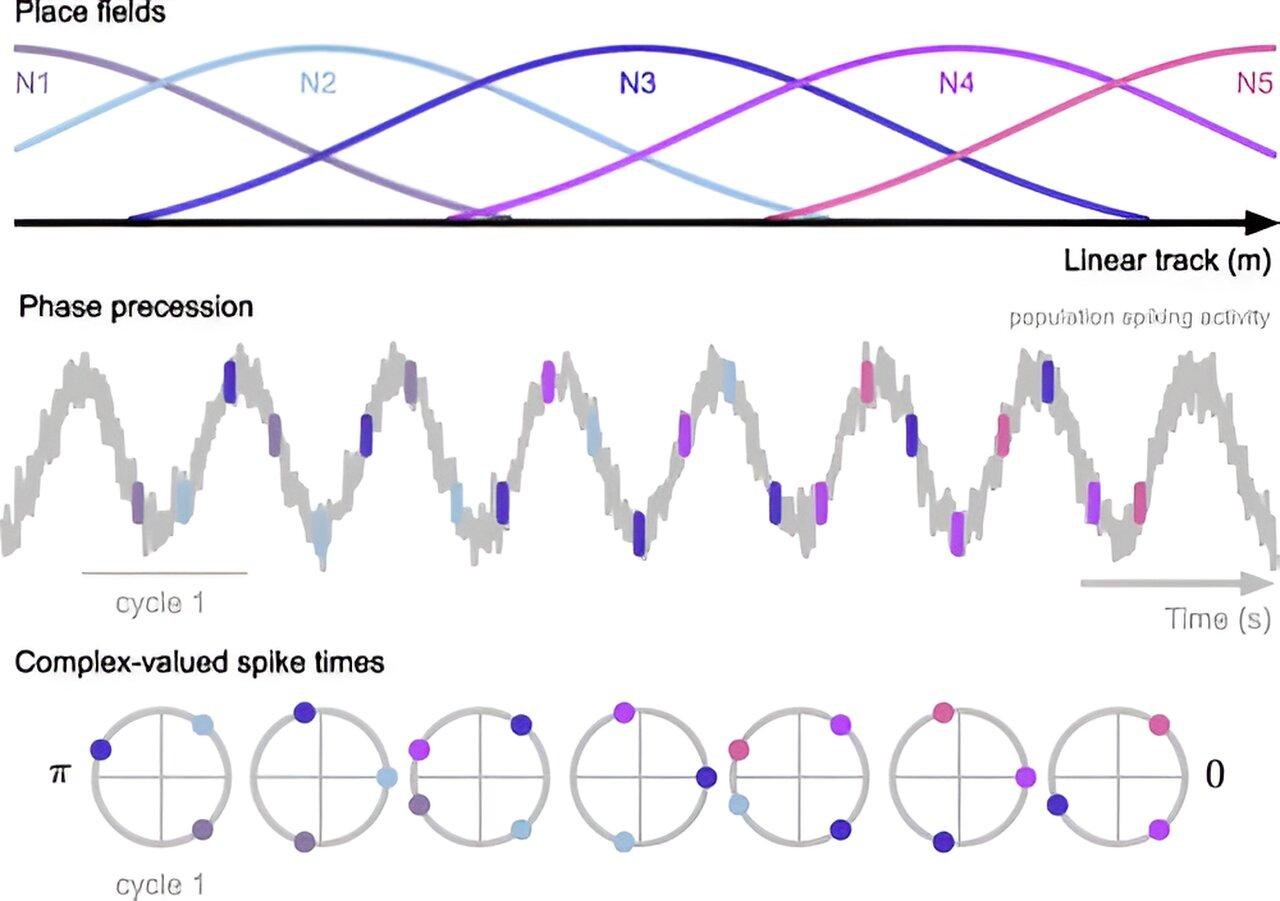
The simple activity of walking through a room jumpstarts the neurons in the human brain. An explosion of electrochemical events or “neuronal spikes” appears at various times during the action. These spikes in activity, otherwise known as action potentials, are electrical impulses that occur when neurons communicate with one another.

Researchers have long thought that spike rates are connected to behaviour and memory. When an animal moves through a corridor, neuronal spikes occur in the hippocampus—an area of the brain involved in memory formation—in a manner resembling a GPS map. However, the timing in which these spikes happen and their connection to events in real-time, was thought of as random until it was discovered that these spikes happen with a specific and precise pattern.

Developing a new approach to studying this phenomenon, Western University neuroscientists are now able to analyse the timing of neuronal spikes. Their research found that spike timing may be just as important as spike rate for behaviour and memory.

“More and more experimental evidence is accumulating for the importance of spike times in sensory, motor, and cognitive systems,” said Lyle Muller, senior author of the paper and assistant professor in the Faculty of Science.

“Yet, the exact computations that are being done through spike times remain unclear. One reason for this may be that there isn’t a clear mathematical language for talking about spike-time patterns across neurons—which is what we set out to develop.”

Published recently in the journal Physical Review E, the paper outlines a new mathematical technique to study the neural codes taking place during spike-time sequences.

“Neurons fire at really specific times with respect to an ‘internal clock,’ and we wanted to know why,” said Alex Busch, co-first author of the paper and a Western BrainsCAN Scholar. “If neurons are already keeping track of the animal’s position through spike rates, why do we need to have specific times on top of that? What additional information does that provide?”

Busch, along with co-first author Federico Pasini, assistant professor in the department of mathematics at Huron College, identified spike times from known experimental data. Studying the patterns as a code, the researchers were able to transfer the spike times into a mathematical equation.

“This is the first time we are able to ask what computation could be done with these spike times. What we found was that it’s more than just current location; the pattern of spike times actually creates a link between the recent past and future predictions that’s encoded in the timing of spikes itself,” said Busch, a Ph.D. student in the department of mathematics now working to create new mathematical approaches to analyse and understand spike times. “These are the sorts of patterns that may be important for learning and memory.”

Beyond giving researchers a method to study spike times and their relation to behaviour and memory, this study also paves the way for studying deficits found in neurodegenerative diseases. A better understanding of the significance of spike times may lead to a better understanding of what happens when spike patterns break down in Alzheimer’s disease and other memory disorders.

“If we have a language for spike times, we can understand the computations that might be occurring. If we can understand the computations, we can understand how they break down and suggest new techniques to fix them,” said Muller.

For more such insights, log into our website https://international-maths-challenge.com

Credit of the article given to Maggie MacLellan, University of Western Ontario


Math anxiety’ causes students to disengage, says study

A new Sussex study has revealed that “math anxiety” can lead to disengagement and create significant barriers to learning. According to charity National Numeracy, more than one-third of adults in the U.K. report feeling worried or stressed when faced with math, a condition known as math anxiety.

The new paper, titled “Understanding mathematics anxiety: loss aversion and student engagement” and published in Teaching Mathematics and its Applications finds that teaching which relies on negative framing, such as punishing students for failure, or humiliating them for being disengaged, is more likely to exacerbate math anxiety and disengagement.

The paper says that in order to successfully engage students in math, educators and parents must build a safe environment for trial and error and allow students space to make mistakes and stop learners from reaching the point where the threat of failure becomes debilitating.

Author Dr. C. Rashaad Shabab, Reader in Economics at the University of Sussex Business School, said, “As the government seeks to implement universal math education throughout higher secondary school, potentially a million more people will be required to study math who might otherwise have chosen not to.

“The results of this study deliver important guiding principles and interventions to educators and parents alike who face the prospect of teaching math to children who might be a little scared of it and so are at heightened risk of developing mathematics anxiety.

“Teachers should tell students to look at math as a puzzle, or a game. If we put a piece of a puzzle in the wrong place, we just pick it up and try again. That’s how math should feel. Students should be told that it’s okay to get it wrong, and in fact that getting it wrong is part of how we learn math. They should be encouraged to track their own improvement over time, rather than comparing their achievements with other classmates.

“All of these interventions, basically take the ‘sting’ out of getting it wrong, and it’s the fear of that ‘sting’ that keeps students from disengaging. The findings could pave the way for tailored interventions to support students who find themselves overwhelmed by the fear of failure.”

Using behavioural economics, which combines elements of economics and psychology to understand how and why people behave the way they do, the research, from the University of Sussex’s Business School, identifies math anxiety as a reason why even dedicated students can become disengaged. This often results in significant barriers to learning, both for the individual in question and others in the classroom.

The paper goes on to say that modern technology and elements of video game design can help those struggling with mathematics anxiety through a technique called “dynamic difficulty adjustment.” This would allow the development of specialist mathematics education computer programs to match the difficulty of math exercises to the ability of each student. Such a technique, if adopted, would keep the problems simple enough to avoid triggering anxiety, but challenging enough to improve learning.

For more such insights, log into our website https://international-maths-challenge.com

Credit of the article given to Tom Walters, University of Sussex


New theory links topology and finance

In a new study published in The Journal of Finance and Data Science, a researcher from the International School of Business at HAN University of Applied Sciences in the Netherlands introduced the topological tail dependence theory—a new methodology for predicting stock market volatility in times of turbulence.

“The research bridges the gap between the abstract field of topology and the practical world of finance. What’s truly exciting is that this merger has provided us with a powerful tool to better understand and predict stock market behaviour during turbulent times,” said Hugo Gobato Souto, sole author of the study.

Through empirical tests, Souto demonstrated that the incorporation of persistent homology (PH) information significantly enhances the accuracy of non-linear and neural network models in forecasting stock market volatility during turbulent periods.

“These findings signal a significant shift in the world of financial forecasting, offering more reliable tools for investors, financial institutions and economists,” added Souto.

Notably, the approach sidesteps the barrier of dimensionality, making it particularly useful for detecting complex correlations and nonlinear patterns that often elude conventional methods.

“It was fascinating to observe the consistent improvements in forecasting accuracy, particularly during the 2020 crisis,” said Souto.

The findings are not confined to one specific type of model. It spans across various models, from linear to non-linear, and even advanced neural network models. These findings open the door to improved financial forecasting across the board.

“The findings confirm the theory’s validity and encourage the scientific community to delve deeper into this exciting new intersection of mathematics and finance,” concluded Souto.

For more such insights, log into our website https://international-maths-challenge.com

Credit of the article given to KeAi Communications Co.


Coping with uncertainty in customer demand: How mathematics can improve logistics processes

How do you distribute drinking water fairly across an area recently hit by a natural disaster? Or how can you make sure you have enough bottles of water, granola bars and fruit in your delivery van to refill all the vending machines at a school when you don’t know how full they are?

Eindhoven University of Technology researcher Natasja Sluijk has developed mathematical models to address these challenges in transportation planning. On Thursday 23 November she successfully defended her dissertation at the Department of Industrial Engineering & Innovation Sciences.

Sluijk obtained her master’s degree at Erasmus University in the field of Operations Research, an area of research focused on the application of mathematical methods in order to optimize processes.

“I’ve always been interested in mathematics and I decided I wanted to do something with it,” she says. On top of that, her father and grandfather, both of whom used to be truck drivers, fueled her interest in transportation and logistics. “That’s how the seed was planted.” The Ph.D. candidate is also very intrigued by uncertainty. “Well, in my research that is, not in my life,” she adds with a laugh. Her doctoral research is where these worlds meet.

Reducing emissions

Her dissertation can be divided into two parts. The first part focuses on so-called two-echelon distribution. “First, you transport the goods in big trucks, because that way you can take many items at once, so you need fewer drivers and you reduce the costs,” she explains.

However, due to environmental zones and emissions regulations, trucks cannot enter cities, which is why smaller vehicles take over the goods at the city limits and bring them to their final destination. These include bicycle couriers or electric vans, which are smaller and more compact.

By dividing the distribution chain into two steps, you can keep costs low while still complying with regulations. Not only does the use of greener vehicles in cities reduce emissions, it also reduces noise pollution and parking problems. “These are the reasons why more and more research is being conducted on two-echelon distribution, on how to optimize it and how to plan routes efficiently,” says Sluijk.

Customer demand uncertainty

The primary focus of her doctoral research is dealing with uncertain customer demand. Normally, a route plan is drawn up for a set of customers with known locations and demands. But what if you don’t know in advance exactly how much you need to deliver?

Sluijk did not include home package deliveries in her research, but rather focused on deliveries from companies to other companies, the so-called B2B market. “Think, for example, of deliveries to locations that require product restocking, such as vending machines,” she explains.

“What you can see in advance is how much has been sold, but it’s only when you arrive at the vending machine that you can see the current demand. Basically, between the time of planning and the time of delivery, the demand can change.” As such, the challenge here is to meet all demands without being left with a surplus of goods.

Sluijk has developed exact mathematical models and algorithms that allow for better handling of uncertain customer demand and optimal route planning solutions within a two-echelon distribution. This enables us to improve the structure of the two-echelon distribution system, making it more sustainable and cost-efficient.

“The most optimal solution ultimately depends on the company’s exact goals,” she emphasizes. Do they want as many satisfied customers as possible or do they prioritize low costs? The mathematical models make it possible to calculate different scenarios and, for example, accurately assess how enhancing customer service affects costs.

Fair distribution

In the second part of her dissertation, she focuses on situations where the total demand exceeds the capacity, in other words, the amount you can supply. Besides cost and efficiency, fairness is another important consideration here.

“For example, I arrive at a customer who asks for eight items, but I decide to supply only six so that I have enough left for the other customers in the delivery route. If I don’t do this, I disadvantage the customers later in the route,” she explains.

The key question here is: how do you ensure a fair distribution of goods when the customer demand is uncertain? Sluijk developed mathematical models that ensure everyone is treated equally. “This is something that has to be done proportionally, because if a customer asks for a hundred items, supplying one fewer item is much less of an issue than if they asked for only five items. So that’s how we factor that in,” she explains.

Humanitarian organizations

The models are applicable not only in B2B supply chains, but also in non-commercial sectors, such as humanitarian organizations. “Suppose there has been a natural disaster and you need to deliver water to different locations, but you don’t know exactly how much to deliver to each location,” she says.

“The same thing applies to food banks; they often collect the food at a central location and then distribute it among the regions.” In these situations, it is crucial to fairly distribute the available resources between the different locations.

Here, the exact methods she has developed can be of great help. “However, we still need to bridge the gap between theory and practice; but in principle, the models are widely applicable and provide a good starting point in the search for desirable solutions. Not only do mathematical models help you arrive at solutions, they also allow you to properly substantiate the decisions made. That is the most transparent approach and also prevents arguments,” she concludes.

For more such insights, log into our website https://international-maths-challenge.com

Credit of the article given to Eindhoven University of Technology


New research demonstrates more effective method for measuring impact of scientific publications

Newly published research reexamines the evaluation of scientific findings, proposing a network-based methodology for contextualizing a publication’s impact.

This new method, which is laid out in an article co-authored by Alex Gates, an assistant professor with the University of Virginia’s School of Data Science, will allow the scientific community to more fairly measure the impact of interdisciplinary scientific discoveries across different fields and time periods.

The findings are published in the journal Proceedings of the National Academy of Sciences.

The impact of a scientific publication has long been quantified by citation count. However, this approach is vulnerable to variations in citation practices, limiting the ability of researchers to accurately appraise the true importance of a scientific achievement.

Recognizing this shortcoming, Gates and his co-authors—Qing Ke of the School of Data Science at City University of Hong Kong and Albert-László Barabási of Northeastern University—propose a network-normalized impact measure. By normalizing citation counts, their approach will help the scientific community avoid biases when assessing a diverse body of scientific findings—both going forward and retrospectively.

In addition to the published findings, the authors have also implemented the method in an open-source package where anyone who is interested can find instructions on how to try this approach themselves on different examples of scientific research.

Gates joined UVA’s School of Data Science in 2022.

For more such insights, log into our website https://international-maths-challenge.com

Credit of the article given to University of Virginia