How master chess players choose their opening gambits

What influences the choices we make, and what role does the behaviour of others have on these choices? These questions underlie many aspects of human behaviour, including the products we buy, fashion trends, and even the breed of pet we choose as our companion.

Now, a new Stanford study that used population and statistical models to analyse the frequency of specific moves in 3.45 million chess games helps reveal the factors that influence chess players’ decisions. The researchers’ analysis of chess games revealed three types of biases described by the field of cultural evolution, which uses ideas from biology to explain how behaviours are passed from person to person. Specifically, they found evidence of players copying winning moves (success bias), choosing atypical moves (anti-conformity bias), and copying moves by celebrity players (prestige bias).

The study summarizing their results was published Nov. 15 in the Proceedings of the Royal Society B: Biological Sciences.

“We are all subject to biases,” said Marcus Feldman, the Burnet C. and Mildred Finley Wohlford Professor in the Stanford School of Humanities and Sciences and senior author. “Most biases are acquired from our parents or learned from our teachers, peers, or relatives.”

Feldman, a professor of biology, co-founded the field of cultural evolution 50 years ago with the late Luca Cavalli-Sforza, professor of genetics at Stanford School of Medicine, as a framework for studying changes in human behaviour that can be learned and transmitted between people. In the past, many studies of cultural evolution were theoretical because large datasets of cultural behaviour didn’t exist. But now they do.

The way chess is played has evolved over time too.

“Over the last several hundred years, paintings of chess playing show a change from crowded disorganized scenes to the quiet concentration we associate with the game today,” said Noah Rosenberg, the Stanford Professor in Population Genetics and Society in H&S.

“In the 18th century, players subscribed to a knightly sort of behaviour,” said Egor Lappo, lead author and a graduate student in Rosenberg’s lab. “Even if a move obviously led to a win, if it could be interpreted as cowardly, the player would reject it. Today, this is no longer the case.”

“The thesis of the paper is that when an expert player makes a move, many factors could influence move choice,” Rosenberg said. “The baseline is to choose a move randomly among the moves played recently by other expert players. Any deviations from this random choice are known in the field of cultural evolution as cultural biases.”

“In the mid-century players eschewed the Queen’s Gambit,” Feldman said. “There didn’t seem to be anything rational about this choice. In a large database of chess games by master-level players, the players’ biases can change over time, and that makes chess an ideal subject to use to explore cultural evolution.”

Playing the game

Chess is often called a game of perfect information because all pieces and their positions are clearly visible to both players. Yet simply knowing the present location of all pieces won’t win a chess game. Games are won by visualizing the future positions of pieces, and players develop this skill by studying the moves made by top chess players in different situations.

Fortunately for chess players (and researchers), the moves and game outcomes of top-level chess matches are recorded in books and, more recently, online chess databases.

In chess, two players take turns moving white (player 1) and black (player 2) pieces on a board checkered with 64 positions. The player with the white pieces makes the first move, each piece type (e.g., knight, pawn) moves a specific way, and (except for a special move called castling) each player moves one piece each turn.

There are few move options in the opening (beginning) of a chess game, and players often stick to tried-and-true sequences of moves, called lines, which are frequently given names like Ruy Lopez and the Frankenstein-Dracula Variation. The opening lines of master and grandmaster (top-level) players are often memorized by other players for use in their own games.

The researchers considered chess matches of master-level players between 1971 and 2019, millions of which have been digitized and are publicly available for analysis by enthusiasts.

“We used a population genetics model that treats all chess games played in a year as a population,” Lappo said. “The population of games in the following year is produced by players picking moves from the previous year to play in their own games.”

To search for possible cultural biases in the dataset of chess moves and games, the researchers used mathematical models to describe patterns that correspond to each kind of bias. Then they used statistical methods to see if the data matched (“fit”) the patterns corresponding to those cultural biases.

A value consistent with players choosing randomly from the moves played the year before indicated there was no cultural bias. This was the average “baseline” strategy. Success bias (copying winning moves) corresponded to values that were played by winning players in the previous year. Prestige bias (copying celebrity moves) corresponded to values that matched the frequencies of lines and moves played by the top 50 players in the previous year. Anti-conformity bias (unpopular moves) corresponded to choosing moves played infrequently in the previous year.

In the paper, the researchers focused on three frequently played moves at different depths of the opening to explore possible biases in early game play—the Queen’s Pawn opening, the Caro-Kann opening, and the Najdorf Sicilian opening.

Before the Queen’s Gambit was cool

For a game that is synonymous with strategy, relatively little is known about the factors that could affect a player’s choice of strategy. This study revealed evidence of cultural biases in the openings of master-level games played between 1971 and 2019.

In the Queen’s Pawn opening, players sometimes choose outlandish moves to rattle their opponents (anti-conformity bias). In the Caro-Kann opening, the study found that players mimic moves associated with winning chess games more often than expected by chance (success bias). And in the Najdorf Sicilian, players copy moves played by top players in famous games (prestige bias).

“The way people get their information about chess games changed between 1971 and 2019,” Rosenberg said. “It is easier now for players to see recent games of master- and grandmaster-level players.”

“The data also show that over time it is increasingly hard for the player with white pieces to make use of their first-move advantage,” Lappo said.

Many of the results align with ideas that are common knowledge among chess players, such as the concept that playing well-known lines is generally preferable to in-the-moment strategies in the opening. The researchers suggest that their statistical approach could be applied to other games and cultural trends in areas where long-term data on choices exist.

“This dataset makes questions related to the theory of cultural evolution useful and applicable in a way that wasn’t possible before,” Feldman said. “The big questions are what behaviour is transmitted, how is it transmitted, and to whom is it transmitted. With respect to the moves we analysed, Egor has the answers, and that is very satisfying.”

For more such insights, log into our website https://international-maths-challenge.com

Credit of the article given to Holly Alyssa MacCormick, Stanford University


The math problem that took nearly a century to solve

We’ve all been there: staring at a math test with a problem that seems impossible to solve. What if finding the solution to a problem took almost a century? For mathematicians who dabble in Ramsey theory, this is very much the case. In fact, little progress had been made in solving Ramsey problems since the 1930s.

Now, University of California San Diego researchers Jacques Verstraete and Sam Mattheus have found the answer to r(4,t), a longstanding Ramsey problem that has perplexed the math world for decades.

What was Ramsey’s problem, anyway?

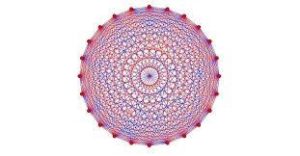
In mathematical parlance, a graph is a series of points and the lines in between those points. Ramsey theory suggests that if the graph is large enough, you’re guaranteed to find some kind of order within it—either a set of points with no lines between them or a set of points with all possible lines between them (these sets are called “cliques”). This is written as r(s,t) where s are the points with lines and t are the points without lines.

To those of us who don’t deal in graph theory, the most well-known Ramsey problem, r(3,3), is sometimes called “the theorem on friends and strangers” and is explained by way of a party: in a group of six people, you will find at least three people who all know each other or three people who all don’t know each other. The answer to r(3,3) is six.

“It’s a fact of nature, an absolute truth,” Verstraete states. “It doesn’t matter what the situation is or which six people you pick—you will find three people who all know each other or three people who all don’t know each other. You may be able to find more, but you are guaranteed that there will be at least three in one clique or the other.”

What happened after mathematicians found that r(3,3) = 6? Naturally, they wanted to know r(4,4), r(5,5), and r(4,t) where the number of points that are not connected is variable. The solution to r(4,4) is 18 and is proved using a theorem created by Paul Erdös and George Szekeres in the 1930s.

Currently r(5,5) is still unknown.

A good problem fights back

Why is something so simple to state so hard to solve? It turns out to be more complicated than it appears. Let’s say you knew the solution to r(5,5) was somewhere between 40–50. If you started with 45 points, there would be more than 10234 graphs to consider.

“Because these numbers are so notoriously difficult to find, mathematicians look for estimations,” Verstraete explained. “This is what Sam and I have achieved in our recent work. How do we find not the exact answer, but the best estimates for what these Ramsey numbers might be?”

Math students learn about Ramsey problems early on, so r(4,t) has been on Verstraete’s radar for most of his professional career. In fact, he first saw the problem in print in Erdös on Graphs: His Legacy of Unsolved Problems, written by two UC San Diego professors, Fan Chung and the late Ron Graham. The problem is a conjecture from Erdös, who offered $250 to the first person who could solve it.

“Many people have thought about r(4,t)—it’s been an open problem for over 90 years,” Verstraete said. “But it wasn’t something that was at the forefront of my research. Everybody knows it’s hard and everyone’s tried to figure it out, so unless you have a new idea, you’re not likely to get anywhere.”

Then about four years ago, Verstraete was working on a different Ramsey problem with a mathematician at the University of Illinois-Chicago, Dhruv Mubayi. Together they discovered that pseudorandom graphs could advance the current knowledge on these old problems.

In 1937, Erdös discovered that using random graphs could give good lower bounds on Ramsey problems. What Verstraete and Mubayi discovered was that sampling from pseudorandom graphs frequently gives better bounds on Ramsey numbers than random graphs. These bounds—upper and lower limits on the possible answer—tightened the range of estimations they could make. In other words, they were getting closer to the truth.

In 2019, to the delight of the math world, Verstraete and Mubayi used pseudorandom graphs to solve r(3,t). However, Verstraete struggled to build a pseudorandom graph that could help solve r(4,t).

He began pulling in different areas of math outside of combinatorics, including finite geometry, algebra and probability. Eventually he joined forces with Mattheus, a postdoctoral scholar in his group whose background was in finite geometry.

“It turned out that the pseudorandom graph we needed could be found in finite geometry,” Verstraete stated. “Sam was the perfect person to come along and help build what we needed.”

Once they had the pseudorandom graph in place, they still had to puzzle out several pieces of math. It took almost a year, but eventually they realized they had a solution: r(4,t) is close to a cubic function of t. If you want a party where there will always be four people who all know each other or t people who all don’t know each other, you will need roughly t3 people present. There is a small asterisk (actually an o) because, remember, this is an estimate, not an exact answer. But t3 is very close to the exact answer.

The findings are currently under review with the Annals of Mathematics. A preprint can be viewed on arXiv.

“It really did take us years to solve,” Verstraete stated. “And there were many times where we were stuck and wondered if we’d be able to solve it at all. But one should never give up, no matter how long it takes.”

Verstraete emphasizes the importance of perseverance—something he reminds his students of often. “If you find that the problem is hard and you’re stuck, that means it’s a good problem. Fan Chung said a good problem fights back. You can’t expect it just to reveal itself.”

Verstraete knows such dogged determination is well-rewarded: “I got a call from Fan saying she owes me $250.”

For more such insights, log into our website https://international-maths-challenge.com

Credit of the article given to University of California – San Diego


Mathematician creates mass extinction model regarding climate change and adaptation

A RUDN University mathematician and a colleague developed a theoretical model of mass extinction. The model for the first time took into account two important factors—the inverse effect of vegetation on climate change and the evolutionary adaptation of species. The results were published in Chaos, Solitons & Fractals.

Over the past half-billion years, there have been five known major mass extinctions, when the number of species dropped by more than half. Several dozen smaller extinctions also occurred. There is debate about the causes of mass extinctions of species. Among them are global warming and cooling. However, exactly what climate change factors lead to extinction and what processes occur is unknown.

A RUDN mathematician and a colleague have built a theoretical model of mass extinction due to climate change taking into account important parameters that have so far been overlooked.

“Mass extinctions are an important part of the history of life on Earth. It is widely believed that the main cause of mass extinction is climate change. A significant change in the Earth’s average temperature leads to global warming or cooling and triggers various mechanisms that may lead to species extinction.”

“Over the past two decades, significant progress has been made in understanding the underlying causes and triggers, but many questions remain open. For example, it is well known that not every climate change in Earth’s history has resulted in a mass extinction. Therefore, there must be factors or feedback that weaken the impact of climate change,” said Sergei Petrovsky, professor at RUDN University.

The mathematicians took into account that some key players in climate change, such as vegetation, contribute to active feedback. The ratio of solar radiation reflected by the Earth to the total (albedo) depends, among other things, on the properties of the surface, that is, on its coverage with vegetation. A second important factor that is commonly overlooked is how species adapt to climate change.

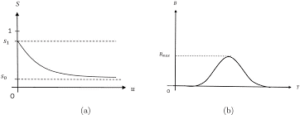
Analysis of the mathematical model showed that whether a species goes extinct depends on the delicate balance between the scale of climate change and the speed of evolutionary response. It also turned out that adaptation of species can lead to so-called false extinction when population density remains low for a long time, but then recovers to a safe value.

Mathematicians also verified the adequacy of the model by comparing its predictions with paleontological data. Extinction frequency distributions are consistent with data obtained from fossil analysis.

“Our model shows how climate-vegetation interactions and the evolutionary response of individual species affect extinction. These two factors are important but are practically not studied. The model’s predictions about the extent of extinction are generally consistent with paleontological data.”

“Although fossil evidence provides, at best, only a partial picture of the true scale of the extinction, with softer-bodied species typically disappearing without leaving any trace. The question of how it will change if data on soft-bodied species is included in the analysis remains open. This may partly explain the discrepancy between our model and fossil data,” said Sergei Petrovsky, professor at RUDN University.

For more such insights, log into our website https://international-maths-challenge.com

Credit of the article given to Scientific Project Lomonosov


How To Perfectly Wrap Gifts Of All Shapes And Sizes Using Maths

Reduce wastage and enjoy deeply satisfying neat folds by applying a little geometry to your gift-wrapping, says Katie Steckles.

Wrapping gifts in paper involves converting a 2D shape into a 3D one, which presents plenty of geometrical challenges. Mathematics can help with this, in particular by making sure that you are using just the right amount of paper, with no wastage.

When you are dealing with a box-shaped gift, you might already wrap the paper around it to make a rectangular tube, then fold in the ends. With a little measuring, though, you can figure out precisely how much paper you will need to wrap a gift using this method, keeping the ends nice and neat.

For example, if your gift is a box with a square cross-section, you will need to measure the length of the long side, L, and the thickness, T, which is the length of one side of the square. Then, you will need a piece of paper measuring 4 × T (to wrap around the four sides with a small overlap) by L + T. Once wrapped around the shape, a bit of paper half the height of the square will stick out at each end, and if you push the four sides in carefully, you can create diagonal folds to make four points that meet neatly in the middle. The square ends of the gift make this possible (and deeply satisfying).

Similarly, if you are wrapping a cylindrical gift with diameter D (such as a candle), mathematics tells us you need your paper to be just more than π × D wide, and L + D long. This means the ends can be folded in – possibly less neatly – to also meet exactly in the middle (sticky bows are your friend here).

How about if your gift is an equilateral triangular prism? Here, the length of one side of the triangle gives the thickness T, and your paper should be a little over 3 × T wide and L + (2 × T) long. The extra length is needed because it is harder to fold the excess end bits to make the points meet in the middle. Instead, you can fold the paper to cover the end triangle exactly, by pushing it in from one side at a time and creating a three-layered triangle of paper that sits exactly over the end.

It is also possible to wrap large, flat, square-ish gifts using a diagonal method. If the diagonal of the top surface of your box is D, and the height is H, you can wrap it using a square piece of paper that measures a little over D + (√2 × H) along each side.

Place your gift in the centre of the paper, oriented diagonally, and bring the four corners to meet in the middle of your gift, securing it with one piece of tape or a sticky bow. This will cover all the faces exactly, and look pretty smart too.

For maximum mathematical satisfaction, what you want is to get the pattern on the paper to line up exactly. This is easier for a soft gift, where you can squash it to line up the pattern, but will only work with a box if the distance around it is exactly a multiple of the width of the repeat on the pattern. Otherwise, follow my example (above) and get your own custom wrapping paper printed!

For more such insights, log into www.international-maths-challenge.com.

*Credit for article given to Katie Steckles*


Coin tosses are not 50/50: Researchers find a slight bias

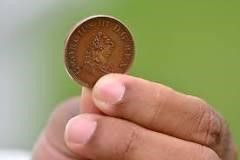
Want to get a slight edge during a coin toss? Check out which side is facing upwards before the coin is flipped –- then call that same side.

This tactic will win 50.8 percent of the time, according to researchers who conducted 350,757-coin flips.

For the preprint study, which was published on the arXiv database last week and has not yet been peer-reviewed, 48 people tossed coins of 46 different currencies.

They were told to flip the coins with their thumb and catch it in their hand—if the coins fell on a flat surface that could introduce other factors such as bouncing or spinning.

Frantisek Bartos, of the University of Amsterdam in the Netherlands, told AFP that the work was inspired by 2007 research led by Stanford University mathematician Persi Diaconis—who is also a former magician.

Diaconis’ model proposed that there was a “wobble” and a slight off-axis tilt that occurs when humans flip coins with their thumb, Bartos said.

Because of this bias, they proposed it would land on the side facing upwards when it was flipped 51 percent of the time—almost exactly the same figure borne out by Bartos’ research.

While that may not seem like a significant advantage, Bartos said it was more of an edge that casinos have against “optimal” blackjack players.

It does depend on the technique of the flipper. Some people had almost no bias while others had much more than 50.8 percent, Bartos said.

For people committed to choosing either heads or tails before every toss, there was no bias for either side, the researchers found.

None of the many different coins showed any sign of bias either.

Happily, achieving a fair coin flip is simple: just make sure the person calling heads or tails cannot see which side is facing up before the toss.

‘It’s fun to do stupid stuff’

Bartos first heard of the bias theory while studying Bayesian statistics during his master’s degree and decided to test it on a massive scale.

But there was a problem: he needed people willing to toss a lot of coins.

At first, he tried to persuade his friends to flip coins over the weekend while watching “Lord of the Rings”.

“But nobody was really down for that,” he said.

Eventually Bartos managed to convince some colleagues and students to flip coins whenever possible, during lunch breaks, even while on holiday.

“It will be terrible,” he told them. “But it’s fun to do some stupid stuff from time to time.”

The flippers even held weekend-long events where they tossed coins from 9am to 9pm. A massage gun was deployed to soothe sore shoulders.

Countless decisions have been made by coin tosses throughout human history.

While writing his paper, Bartos visited the British Museum and learned that the Wright brothers used one to determine who would attempt the first plane flight.

Coin tosses have also decided numerous political races, including a tied 2013 mayoral election in the Philippines.

But they are probably most common in the field of sport. During the current Cricket World Cup, coin tosses decide which side gets to choose whether to bat or field first.

For more such insights, log into our website https://international-maths-challenge.com

Credit of the article given to Daniel Lawler


Improved information and communication technology infrastructure leads to better math skills, research suggests

Students who are more digitally skilled also perform better in math. New research from Renae Loh and others at Radboud University shows that in countries with better availability of information and communication technology (ICT) in schools, math performance benefits greatly. It further suggests that improving the ICT environment in schools can reduce inequality in education between countries. The paper is published in European Educational Research Journal today.

For anyone growing up today, ICT skills play a tremendously important role. Today’s youth constantly come into contact with technology throughout their life, both in work and leisure. Though previous studies have shown the importance of ICT skills in students’ learning outcomes, a new study focuses specifically on its relevance to math and how that differs between countries.

“Both ICT and math rely on structural and logical thinking, which is why ICT skills overlap with and boosts math learning. But we were also curious to find out how much of that depends on a country’s ICT environment,” says Renae Loh, primary author of the paper and a sociologist at Radboud University.

Benefits of a strong ICT infrastructure

Loh and her colleagues used data from the 2018 PISA Study and compares 248,720 students aged 15 to 16 across 43 countries. Included in this data is information about the ICT skills of these students. They were asked whether they read new information on digital devices, and if they would try to solve problems with those devices themselves, among other questions. The more positively students responded to these questions, the more skilled in ICT the researchers judged these students to be.

Loh says, “What we found is that students get more educational benefit out of their digital skills in countries with a strong ICT infrastructure in education. This is likely because the more computers and other digital tools are available to them in their studies, the more they were able to put those skills to use, and the more valued these skills were. It is not a negligible difference either.”

“A strong ICT infrastructure in education could boost what math performance benefits students gain from their digital skills by about 60%. Differences in ICT infrastructure in education accounted for 25% of the differences between countries in how much math benefits students gain from their digital skills. It is also a better indicator than, for example, looking at a more general indicator of country wealth, because it is more pinpointed and more actionable.”

Reducing inequality

Especially notable to Loh and her colleagues was the difference that was apparent between countries with a strong ICT infrastructure, and countries without. “It was surprisingly straightforward, in some ways: the higher the computer-to-student ratio in a country, the stronger the math performance. This is consistent with the idea that these skills serve as a learning and signaling resource, at least for math, and students need opportunities to put these resources to use.”

Loh points out that there are limits to the insight offered by the data, however. “Our study doesn’t look at the process of how math is taught in these schools, specifically. Or how the ICT infrastructure is actually being used. Future research might also puzzle over how important math teachers themselves believe ICT skills to be, and if that belief and their subsequent teaching style influences the development of students, too.”

“There is still vast inequality in education around the world,” warns Loh. “And now there’s an added ICT dimension. Regardless of family background, gender, and so on, having limited access to ICT or a lack in digital skills is a disadvantage in schooling. What is clear is that the school environment is important here. More targeted investments in a robust ICT infrastructure in education would help in bridging the educational gap between countries and may also help to address inequalities in digital skills among students in those countries.”

For more such insights, log into our website https://international-maths-challenge.com

Credit of the article given to Radboud University


How Spiral Search Patterns And Lateral Thinking Cracked Our Puzzle

Rob Eastaway and Brian Hobbs take over our maths column to reveal who solved their puzzle and won a copy of their New Scientist puzzle book, Headscratchers.

When solving problems in the real world, it is rare that the solution is purely mathematical, but maths is often a key ingredient. The puzzle we set a few weeks ago (New Scientist, 30 September, p 45) embraced this by encouraging readers to come up with ingenious solutions that didn’t have to be exclusively maths-based.

Here is a reminder of the problem: Prince Golightly found himself tied to a chair near the centre of a square room, in the dark, with chained monsters in the four corners and an escape door in the middle of one wall. With him, he had a broom, a dictionary, some duct tape, a kitchen clock and a bucket of water with a russet fish.

John Offord was one of several readers to spot an ambiguity in our wording. Four monsters in each corner? Did this mean 16 monsters? John suggested the dictionary might help the captors brush up on their grammar.

The russet fish was deliberately inserted as a red herring (geddit?), but we loved that some readers found ways to incorporate it, either as a way of distracting the monsters or as a source of valuable protein for a hungry prince. Dave Wilson contrived a delightful monster detector, while Glenn Reid composed a limerick with the solution of turning off the computer game and going to bed.

And so to more practical solutions. Arlo Harding and Ed Schulz both suggested ways of creating a torch by igniting assorted materials with an electric spark from the light cable. But Ben Haller and Chris Armstrong had the cleverest mathematical approach. After locating the light fitting in the room’s centre with the broom, they used duct tape and rope to circle the centre, increasing the radius until they touched the wall at what must be its centre, and then continued circling to each wall till they found the escape door. Meanwhile, the duo of Denise and Emory (aged 11) used Pythagoras’s theorem to confirm the monsters in the corners would be safely beyond reach. They, plus Ben and Chris, win a copy of our New Scientist puzzle book Headscratchers.

It is unlikely you will ever have to escape monsters in this way, but spiral search patterns when visibility is limited are employed in various real-world scenarios: rescuers probing for survivors in avalanches, divers performing underwater searches and detectives examining crime scenes, for example. Some telescopes have automated spiral search algorithms that help locate celestial objects. These patterns allow for thorough searches while ensuring you don’t stray too far from your starting point.

Of course, like all real-world problems, mathematical nous isn’t enough. As our readers have displayed, lateral thinking and the ability to improvise are human skills that help us find the creative solutions an algorithm would miss.

For more such insights, log into www.international-maths-challenge.com.

*Credit for article given to Rob Eastaway and Brian Hobbs*