Human crowds are best modelled by a ‘visual neighbourhood’

Human crowd dynamics are best predicted by a visual neighbourhood model, based on the visual fields of each person in the crowd. Birds flock, fish school, and human crowds, too, move in a collective motion pattern. Understanding human crowd behaviour can be useful for preventing jams, crushes, and stampedes. Mathematical models of collective motion are typically based on characterizing the local interactions between individuals.

One popular approach, called a metric model, is to quantify forces of attraction, repulsion, and velocity alignment for all neighbours within a fixed radius from the focal individual. Alternatively, in a topological model the focal individual might be influenced by a fixed number of near neighbours, regardless of the distance to the focal individual.

For their study published in PNAS Nexus, Trenton Wirth and colleagues asked participants to walk in real and virtual crowds of varying densities, then changed the walking direction of some neighbours to see how the participants responded. The authors found that the data produced was better predicted by the metric model than by the topological model.

But the best model was based on the visual motions of the neighbours the focal individual could see. In dense crowds, near neighbours may partially or completely block the view of more distant neighbours, removing the distant neighbours from the focal pedestrian’s input. Pursuing a visual model promises more realistic simulations of crowd dynamics, according to the authors.

For more such insights, log into our website https://international-maths-challenge.com

Credit of the article given to PNAS Nexus


Machine learning model analyses why couples break up

What does artificial intelligence offer that goes beyond traditional statistical models, such as regression analysis, to investigate the behaviour of households, in particular the factors that cause the separation of couples and dissolution of the conjugal bond?

With Bruno Arpino (University of Florence) and Marco Le Moglie (Catholic University of Milan) we have analysed data for over 2,000 German married or cohabiting couples, who were followed for a dozen years on average by the annual GSOEP survey (German Socio-Economic Panel), with more than 900 ending in separation.

By adopting a machine learning approach (specifically, Random Survival Forests) the procedure found on its own the relationship between the various factors contained in the database. In this case it considered more than 40 factors, from age to education level, from health to psychology traits: the mass of raw data was fed to ML, without making precise hypotheses, but simply indicating as event of interest the break-up of the union, and the algorithm indicated the influence of each factor contained in the data. The variables that pose the greatest threat to the stability of a union have been identified with an accuracy of 70% (a predictive ability that outperforms the 50% achieved by traditional regression methods).

Not only was ML able to discover the factors behind the breakup of couples, but it was also able to use this knowledge to predict the end of a union before it happens. This is also because, instead of submitting all the data available to an ad hoc algorithm, half were used to instruct the algorithm itself and the validity of the results was verified with the other half of the dataset.

The results of the analysis are very interesting, above all because the ML methodology is able to weigh the relative importance of various factors in causing the breakup. Factors that had been particularly influential in previous studies have instead lost their relevance here, like unemployment, and the partner’s high level of education and income.

The four major risk factors, that emerged from the study are in descending order: personal satisfaction, the woman’s quantity of paid work, some personality factors and age.

The strongest predictor of separation is personal satisfaction: if both partners are dissatisfied, obviously the couple won’t last. Less obvious is that a strong drop in conjugal stability emerges when the woman is very satisfied with the union but the man much less so, while the reverse effect is less evident. If the woman works many hours outside the home, the risk of separation or divorce is higher, even when the man is more involved in domestic chores (but this result is nothing new and according to the existing literature it depends on the greater agency and independence of working women.

As for personality traits, high extraversion in men (classically linked to a higher infidelity) and low openness in women, less adaptable to the changes brought about by cohabitation, are the traits that more strongly associated with the end of a couple. Also a low level of conscientiousness in both partners (understood as organizational capacity in daily life, and therefore—if low—as disorder and inability to respect commitments) does not help to stay together. But also a too high or too low level of neuroticism can be a problem. This result can be interpreted as the fact that suffering from excessive anxiety, jealousy, guilt, worry or anger clearly complicates the relationship.

This is true above all for women, but, on the other hand, those who don’t feel this type of emotion could lead their partners to read that personality trait as lack of interest (men, in this case). However, no pairing of personalities was determined that is more strongly associated with the breakup of the relationship. Finally, considering age, very young couples tend to be more unstable, but for women stability in relationships intensifies after the age of 40, while this is not the case for men.

ML analysis is not without limitations. In this case a major one is that it refers only to Germany and also has few details on the psychological aspects of the two partners. However, from a methodological point of view, the study demonstrates the great potential of ML techniques in demographic and sociological research in general, highlighting their ability to monitor and analyse a large number of predictive factors, to automatically find linear or non-linear relations, additive or non-additive relations between these factors and the outcome of interest, with greater precision and more robustness of estimates against collinearity than commonly used methods.

For more such insights, log into our website https://international-maths-challenge.com

Credit of the article given to Letizia Mencarini, Bocconi University


Study: German youth show weaker performance in math, reading and science compared to 2018

Young people in Germany are less proficient in mathematics, reading and science as compared to 2018. This is revealed in a PISA study. About one-third of the 15-year-olds tested achieved only a very low level of proficiency in at least one of the three subjects. The results confirmed a downward trend already in evidence in the preceding PISA studies. The mathematics and reading scores of German students are only at OECD average levels. They remain above that level only in natural sciences.

The PISA studies are regular assessments of the ability of 15-year-old students to solve problems in mathematics, reading and science in real-world contexts as they approach the end of compulsory schooling. The current study, coordinated by the Organization for Economic Cooperation and Development (OECD) and conducted in Germany by the Center for International Student Assessment (ZIB) at the Technical University of Munich (TUM), was carried out in the spring of 2022.

In many OECD countries the average scores in mathematics and reading skills were lower as compared to the previous PISA study in 2018. Scores were also down in natural sciences, although to a lesser extent.

In Germany the decrease in scores was larger than average in all three subjects. As a result, Germany is now significantly above the OECD average (492 vs. 485 points) only in natural sciences. In mathematics (475 vs. 472 points) and reading (480 vs. 476 points), the results now match the OECD average, which has also fallen in both subjects.

After the first PISA study in 2000, Germany initially achieved improvements in its results and was able to maintain them at a high level. In the most recent PISA rounds, however, there were signs of a negative trend. The scores in mathematics and natural sciences are now below those of the PISA studies in the 2000s, when those subjects were assessed in detail for the first time (mathematics: PISA 2003; natural sciences: PISA 2006). The reading scores of the current study are around the same as in PISA 2000, when that subject was a focal point for the first time.

Only a few OECD countries were able to improve some of their results between 2018 and 2022, for example Japan in reading and Italy, Ireland and Latvia in science. In mathematics, students in Japan and Korea show the highest average performance. The top countries in reading are Ireland, Japan, Korea and Estonia. Japan, Korea, Estonia and Canada have the best results in natural sciences.

Focus of the eighth PISA study: Mathematics

In the eighth Program for International Student Assessment (PISA) study, the skills were assessed of a representative selection of approximately 6,100 15-year-old secondary school students attending around 260 schools of all types in Germany. Students also answered a questionnaire about learning conditions, attitudes and social background. School principals, teachers and parents answered questions on the lesson structure, classroom resources and the role of learning in the home. Approximately 690,000 students took part in the study worldwide. Every PISA cycle has a focus subject. This time it was mathematics.

The German part of the study was headed by the ZIB on behalf of the Standing Conference of the Ministers of Education and Cultural Affairs (KMK) and the Federal Ministry of Education and Research. Partners in the ZIB, alongside TUM, are the Leibniz Institute for Research and Information in Education (DIPF) and the Leibniz Institute for Pedagogy of Natural Sciences and Mathematics (IPN).

More students at low proficiency levels

According to the test scores, the study classifies the students in six proficiency levels. Students whose skills do not exceed proficiency level 1 require additional support in order to meet the demands of vocational training or further schooling and participate fully in society.

About one-third of the 15-year-olds achieved only these very low proficiency levels in at least one of the three tested subjects. Around one in six have significant deficiencies in all three subjects. The percentages of these particularly low-performing students have increased significantly since 2018. They now stand at 30% in mathematics, 26% in reading and 23% in science.

At the other end of the scale are the highly proficient students. In mathematics and reading they now represent only 9% and 8% of the total, respectively, while in natural sciences their share of the total remained unchanged, at around 10%.

The pandemic factor

The students’ answers to the questionnaires point to possible reasons for the lower scores: First, the researchers believe that school closures during the COVID pandemic negatively affected the ability to learn skills. In Germany schools made less use of digital media than the OECD average and relied more on materials mailed to students. “By comparison with other countries, Germany was not well prepared for distance learning in terms of digital hardware—but then caught up,” says study head Prof. Doris Lewalter, an educational researcher at TUM and managing director of the ZIB. Fewer than half of the low-proficiency students made use of available remedial options.

However, the analysis of the international data shows no systematic link between the decreases in proficiency between 2018 and 2022 and the duration of school closures. Some countries with relatively few school closure days have significantly lower scores than in 2018 while others, with higher numbers of days lost, show only small decreases or even slightly higher scores.

Language difficulties as a factor

A second possible factor to explain the results in the study’s focal area of mathematics: in Germany there is still a strong link between students’ proficiency in mathematics and the socio-economic status of their families and their immigrant background. Today’s 15-year-olds who themselves have immigrated to Germany are significantly less proficient at mathematics than the same group in 2012, when this question was last investigated. German is spoken less often in the homes of these students than in those of comparable students in 2012.

“This conclusion is only a partial explanation of the overall results, however,” says Prof. Lewalter. “The mathematical scores of non-immigrant students are also lower than in 2012—and even more so than for German-born children of immigrant parents.”

The factor of interest and motivation

To explain the long-term negative trend, the researchers therefore also take the students’ responses to the questionnaire regarding motivation, attitudes and classroom conditions. Compared to 2012, the students showed less enjoyment and interest in mathematics. The subject was also causing them more anxiety. In addition, the 15-year-olds see fewer potential benefits from learning mathematics.

“The results also show that the students feel less supported by their mathematics teachers. But this support is a key prerequisite for good instruction. In addition, the students have only limited awareness of teachers’ efforts to make lessons relevant to real-world contexts. This makes it more difficult for them to recognize the importance of mathematics in their lives—which can in turn decrease their motivation for the subject,” says Prof. Lewalter.

‘A big push’

As key conclusions from the PISA results, the educational researchers recommend:

  • A systematic diagnosis and development of linguistic and reading proficiency from pre-school to the secondary level. “German language skills are the foundation of success at school,” says Prof. Lewalter.
  • Ongoing development of instruction and the inclusion of digital media. “The students’ living realities are constantly changing and, along with them, the baseline conditions for applying mathematics, reading and science skills,” says Prof. Lewalter.
  • Needs-oriented resource allocation to better equip schools with large numbers of students from disadvantaged families and with immigrant backgrounds.

“After the first PISA study in 2000, Germany was able to significantly improve students’ skills with effective support programs,” says Prof. Lewalter. “With a big push, combining the efforts of policy makers, schools and society, we can do it again.”

For more such insights, log into our website https://international-maths-challenge.com

Credit of the article given to Technical University Munich


Mathematical model based on psychology predicts who will buy trendy products

It’s often risky to introduce new products to the market. In fact, statistics show that between 40 to 90 percent of new products fail. A key component of product adoption is consumer psychology. While there are a few theories that attempt to explain why certain people are not likely to accept novelties, a new study takes a slightly different approach.

Florida Atlantic University and collaborators developed and introduced a new mathematical innovation model, grounded in psychology, to provide both qualitative and quantitative predictions of adoption trends for new products.

The objective of the study was to test the researchers’ hypothesis that the most innovative people are making purchasing decisions independently of others, highly innovative people are more likely to adopt when the adoption trend has an increasing rate of growth (accelerating trend), moderately innovative people are more likely to adopt when the adoption trend has a positive rate of growth (increasing trend), and the least innovative people pay attention only to the total number of adoptions when making the purchasing decision.

Researchers divided people/adopters into four categories: innovator, early adopter, majority and laggard. They applied their innovation model to predict sales data of 200 products of a supermarket chain over four years. They assigned particular preferences for various adoption trends based on the adopters’ psychological profiles and generated forecasts for retail sales. They then compared the performance of their innovation model in predicting sales with two other commonly used innovation models and one financial time series model.

Results of the study, published in the journal Physica A: Statistical Mechanics and its Applications, offer a new psychological interpretation of probably the most popular, existing adoption model used widely in marketing today.

Key findings reveal that different adopter groups are looking for particular properties of adoption trends to inform their purchasing decisions and that those properties can be formulated mathematically with testable predictions. Importantly, their innovation adoption model outperformed two behavioural models, and the BASS model, which has become the standard model in business innovation forecasts.

Findings point to the evidence of customers’ behaviour based by these four groups, but more importantly, illustrate the usefulness in quantifying psychological behaviour in a general social context, especially with respect to innovation.

“We assumed that individuals’ decisions regarding the purchase of a new product are driven by the perceived type of adoption trend,” said Andrzej Nowak, Ph.D., co-author and a professor of psychology in FAU’s Charles E. Schmidt College of Science.

“Innovators look for new products and try them out first, regardless of what anyone else is doing. Early adopters, who look for new future successful products, try to get them early. They react to the value of the second derivative of cumulative sales when making decisions. The majority are interested in products quickly gaining popularity and are more likely to buy when the first derivative of cumulative sales is high. The laggards see only the total number of adopters, which is cumulative sales, as a convincing reason to buy.”

The authors say that companies that want to survive and flourish in today’s fast-changing market need to constantly innovate and adapt to the changing conditions, customers’ sentiment, and emerging trends.

“Further research in the area of retail product sales forecasting is extremely important since accurate models of product adoption can help companies reduce waste from unsold products, which in many cases also can affect the environment and decrease storage costs,” said Nowak.

For more such insights, log into our website https://international-maths-challenge.com

Credit of the article given to Florida Atlantic University


How Maths Reveals The Best Time to Add Milk For Hotter Tea

If you want your cup of tea to stay as hot as possible, should you put milk in immediately, or wait until you are ready to drink it? Katie Steckles does the sums.

Picture the scene: you are making a cup of tea for a friend who is on their way and won’t be arriving for a little while. But – disaster – you have already poured hot water onto a teabag! The question is, if you don’t want their tea to be too cold when they come to drink it, do you add the cold milk straight away or wait until your friend arrives?

Luckily, maths has the answer. When a hot object like a cup of tea is exposed to cooler air, it will cool down by losing heat. This is the kind of situation we can describe using a mathematical model – in this case, one that represents cooling. The rate at which heat is lost depends on many factors, but since most have only a small effect, for simplicity we can base our model on the difference in temperature between the cup of tea and the cool air around it.

A bigger difference between these temperatures results in a much faster rate of cooling. So, as the tea and the surrounding air approach the same temperature, the heat transfer between them, and therefore cooling of the tea, slows down. This means that the crucial factor in this situation is the starting condition. In other words, the initial temperature of the tea relative to the temperature of the room will determine exactly how the cooling plays out.

When you put cold milk into the hot tea, it will also cause a drop in temperature. Your instinct might be to hold off putting milk into the tea, because that will cool it down and you want it to stay as hot as possible until your friend comes to drink it. But does this fit with the model?

Let’s say your tea starts off at around 80°C (176°F): if you put milk in straight away, the tea will drop to around 60°C (140°F), which is closer in temperature to the surrounding air. This means the rate of cooling will be much slower for the milky tea when compared with a cup of non-milky tea, which would have continued to lose heat at a faster rate. In either situation, the graph (pictured above) will show exponential decay, but adding milk at different times will lead to differences in the steepness of the curve.

Once your friend arrives, if you didn’t put milk in initially, their tea may well have cooled to about 55°C (131°F) – and now adding milk will cause another temperature drop, to around 45°C (113°F). By contrast, the tea that had milk put in straight away will have cooled much more slowly and will generally be hotter than if the milk had been added at a later stage.

Mathematicians use their knowledge of the rate at which objects cool to study the heat from stars, planets and even the human body, and there are further applications of this in chemistry, geology and architecture. But the same mathematical principles apply to them as to a cup of tea cooling on your table. Listening to the model will mean your friend’s tea stays as hot as possible.

For more such insights, log into www.international-maths-challenge.com.

*Credit for article given to Katie Steckles*


Math teachers hold a bias against girls when the teachers think gender equality has been achieved, says study

Math teachers who believe women no longer face discrimination tend to be biased against girls’ ability in math. This is what we found through an experiment we conducted with over 400 elementary and middle school math teachers across the United States. Our findings were published in a peer-reviewed article that appeared in April 2023 in the International Journal of STEM Education.

For our experiment, we asked teachers to evaluate a set of student solutions to math problems. The teachers didn’t know that gender- and race-specific names, such as Tanisha and Connor, had been randomly assigned to the solutions. We did this so that if they evaluated identical student work differently, it would be because of the gender- and race-specific names they saw, not the differences in student work. The idea was to see if the teachers had any unconscious biases.

After the teachers evaluated the student solutions, we asked a series of questions about their beliefs and experiences. We asked if they felt society had achieved gender equality. We asked them whether they felt anxious about doing math. We asked whether they felt students’ ability in math was fixed or could be improved. We also asked teachers to think about their own experience as math students and to report how frequently they experienced feelings of unequal treatment because of their race or gender.

We then investigated if these beliefs and experiences were related to how they evaluated the math ability of students of different genders or racial groups.

Consistent with our prior work, we found that implicit bias against girls arises in ambiguous situations—in this case, when student solutions were not completely correct.

Further, for teachers who believed that U.S. society had achieved gender equality, they tended to rate a student’s ability higher when they saw a male student name than when they saw a female student name for the same student work.

Teachers’ unconscious gender biases in math classes have been documented repeatedly.

Our study identifies factors that underlie such biases; namely, that biases are stronger among teachers who believe that gender discrimination is not a problem in the United States. Understanding the relationship between teachers’ beliefs and biases can help teacher educators create effective and targeted interventions to remove such biases from classrooms.

Our findings also shed light on potential reasons that males tend to have higher confidence in math and stick with math-intensive college majors even when they’re not high performers.

One big remaining question is how to create targeted interventions to help teachersovercome such biases. Evidence suggests that unconscious biases come into play in situations where stereotypes might emerge. Further, research suggests that these unconscious biases can be suppressed only when people are aware of them and motivated to restrain them.

Since bias may take on different forms in different fields, a one-time, one-size-fits-all anti-bias training may not have a lasting effect. We think it’s worthwhile to investigate if it’s more effective to provide implicit bias training programs that are specific to the areas where bias is revealed.

For more such insights, log into our website https://international-maths-challenge.com

Credit of the article given to Yasemin Copur-Gencturk, Ian Thacker and Joseph Cimpian, The Conver


Math unlocks molecular interactions that open window to how life evolved

A “window to evolution” has opened after mathematicians uncovered the universal explanatory framework for how molecules interact with one another to adapt to new and variable conditions while maintaining tight control over key survival properties.

Landmark research published in Nature Communications by mathematicians Dr. Robyn Araujo at QUT and Professor Lance Liotta of George Mason University in the U.S. sets out the definitive picture of biological adaptation at the level of intermolecular interactions.

Dr. Araujo, from the QUT School of Mathematical Sciences, said the research findings represented a blueprint for adaptation-capable signaling networks across all domains of life and for the design of synthetic biosystems.

“Our study considers a process called robust perfect adaptation (RPA) whereby biological systems, from individual cells to entire organisms, maintain important molecules within narrow concentration ranges despite continually being bombarded with disturbances to the system,” Dr. Araujo said.

“Until now, no one had a general way to explain how this vital process was orchestrated at the molecular level through the vast, complex, often highly intricate networks of chemical reactions among different types of molecules, mostly proteins.

“We have now solved this problem, having discovered fundamental molecular-level design principles that organize all forms of biological complexity into robustness-promoting, and ultimately, survival-promoting, chemical reaction structures.”

Dr. Araujo said they had found that collections of interacting molecules in living systems cannot simply “transmit” biochemical signals but must actually make “computations” on these signals.

“These complex intermolecular interactions must implement a special type of regulation known as integral control—a design strategy known to engineers for almost a century.

“However, signaling networks in nature are vastly different, having evolved to rely on the physical interactions between discrete molecules. So, nature’s ‘solutions’ operate through remarkable and highly intricate collections of interactions, without engineering’s specially designed, integral-computing components, and often without feedback loops.

“We show that molecular network structures use a form of integral control in which multiple independent integrals, each with a very special and simple structure, can collaborate to confer the capacity for adaptation on specific molecules.

“Using an algebraic algorithm based on this finding, we have been able to demonstrate the existence of embedded integrals in biologically important chemical reaction networks whose ability to exhibit adaptation could never before be explained by any systematic method.”

Professor Liotta said the quest to uncover the fundamental design principles of biological systems throughout nature is considered to be one of the most important and far-reaching grand challenges in the life sciences.

“On the basis of this ground-breaking new research, RPA currently stands alone as a keystone biological response for which there now exists a universal explanatory framework.

“It’s a framework that imposes strict and inviolable design criteria on arbitrarily large and complex networks, and one that now accounts for the subtleties of intricate intermolecular interactions at the network microscale.

“At a practical level, this discovery could provide a completely fresh approach to tackle grand challenges in personalized medicine such as cancer drug resistance, addiction, and autoimmune diseases.”

For more such insights, log into our website https://international-maths-challenge.com

Credit of the article given to Queensland University of Technology


Venn: The man behind the famous diagrams, and why his work still matters today

April 2023 marks the 100th anniversary of the death of mathematician and philosopher John Venn. You may well be familiar with Venn diagrams—the ubiquitous pictures of typically two or three intersecting circles, illustrating the relationships between two or three collections of things.

For example, during the pandemic, Venn diagrams helped to illustrate symptoms of COVID-19 that are distinct from seasonal allergies. They are also often taught to school children and are typically part of the early curriculum for logic and databases in higher education.

Venn was born in Hull, UK, in 1834. His early life in Hull was influenced by his father, an Anglican priest—it was expected John would follow in his footstep. He did initially begin a career in the Anglican church, but later moved into academia at the University of Cambridge.

One of Venn’s major achievements was to find a way to visualize a mathematical area called set theory. Set theory is an area of mathematics which can help to formally describe properties of collections of objects.

For example, we could have a set of cars, C. Within this set, there could be subsets such as the set of electric cars, E, the set of petrol based cars, say P, and the set of diesel powered cars, D. Given these, we can operate on them, for example, to apply car charges to the sets P and D, and a discount to the set E.

These sorts of operations form the basis of databases, as well as being used in many fundamental areas of science. Other major works of Venn’s include probability theory and symbolic logic. Venn had initially used diagrams developed by the Swiss mathematician Leonard Euler to show some relationships between sets, which he then developed into his famous Venn diagrams.

Venn used the diagrams to prove a form of logical statement known as a categorical syllogism. This can be used to model reasoning. Here’s an example: “All computers need power. All AI systems are computers.” We can chain these together to the conclusion that “all AI systems need power.”

Today, we are familiar with such reasoning to illustrate how different collections relate to each other. For example, the SmartArt tool in Microsoft products lets you create a Venn diagram to illustrate the relationships between different sets. In our earlier car example, we could have a diagram showing electric cars, E, and petrol powered cars, P. The set of hybrid cars that have a petrol engine would be in the intersection of P and E.

Logic and computing

The visualization of sets (and databases) is helpful, but the importance of Venn’s work then—and now—is the way they allowed proof of George Boole’s ideas of logic as a formal science.

Venn used his diagrams to illustrate and explore such “symbolic logic”—defending and extending it. Symbolic logic underpins modern computing, and Boolean logic is a key part of the design of modern computer systems—making his work relevant today.

Venn’s work was also crucial to the work of philosopher Bertrand Russell, showing that there are problems that are unsolvable. We can express such problems with sets, in which each is an unsolvable problem. One such unsolvable problem can be expressed with the “Barber paradox.” Suppose we had an article in Wikipedia containing all the articles that don’t contain themselves—a set. Is this new article itself in that set?

Luckily we can visualize that with a Venn diagram with two circles, where one circle is the set of entries that don’t include themselves, A, and the other circle is the set of entries that do include themselves, B.

We can then ask the question: where do we put the article that contains all the articles that don’t contain themselves? Have a think about it, then see where you would put it.

The problem is that it cannot be on the left, as it would contain itself, and would therefore be inconsistent. And it cannot be on the right, as then it would be missing, or incomplete. And it can’t be in both. It must be in one or the other. This paradox illustrates how unsolvable statements can arise—they are valid in terms of expressing them within the logical system, but ultimately unanswerable. We could possibly extend our system to solve this, but then we would end up with another unanswerable question.

Venn’s diagrams were crucial in understanding this. And this area of science is still important, for example when considering the limitations of machine learning and AI, where we may ask questions that cannot be answered.

Venn also had an interest in building mechanical machines—including a bowling machinewhich proved so effective it was able to bowl out some top Australian batsmen of the day.

Following his abstract work on logic, he developed the concept of a logical-diagram machine with a lot of processing power: though this brilliant idea from 1881 would take many decades to appear as modern computers.

We remember Venn here in Hull, with a bridge close to his birthplace decorated with Venn circle inspired artwork. At the University of Hull’s main administration building, there’s an intersection of management and academia which is called the Venn building.

For more such insights, log into our website https://international-maths-challenge.com

Credit of the article given to Neil Gordon, The Conversation


Expert reveals the fascinating link between math and card shuffling

Mathematics sometimes impacts our lives in seemingly unsuspecting ways, including card shuffling.

Math can answer the age-old question of how many times a deck of cards needs to be shuffled to ensure the cards are thoroughly mixed. It can even reveal the best method for dealing cards.

Jason Fulman, professor of mathematics at the USC Dornsife College of Letters, Arts and Sciences, studies card shuffling using math. He shares what is known on the topic in an upcoming book, “The Mathematics of Shuffling Cards” (American Mathematical Society), which he co-wrote with acclaimed mathematician Persi Diaconis. The book is due out in June.

Card shuffling is a numbers game

Among the many insights Fulman provides is that the number of shuffles required to thoroughly mix a deck of 52 cards depends on the shuffle type used.

The riffle shuffle—splitting the deck roughly in half then using the thumbs to quickly interleave the cards—is the most efficient. It requires just seven shuffles to mix a deck well.

Scattering the cards out flat on the table and randomly spreading them over each other, called “smooshing,” requires 30 to 60 seconds for thorough mixing.

The overhand method—taking sections of a stacked deck and moving them over to make a new stack—must be repeated a whopping 10,000 times to mix the cards well.

What the cards are being used for makes a difference, too. In blackjack, for example, card suits don’t matter, and certain cards are equivalent, so just four or five riffle shuffles are plenty for mixing.

Then there’s magic. Perfect shuffles can restore a deck to its original order, and specific sequences of shuffles can move a card to a desired position, enabling a magician to control the cards in a way that seems magical.

For mathematicians, fairness is a big deal

Fulman also explores card dealing, a key to ensuring fairness in card games.

Two commonly used methods of card dealing are the cyclic method and back-and-forth. In the cyclic method, cards are dealt in a repeating sequence such as one, two, three, four, one, two, three, four. Back-and-forth uses alternating directions such as one, two, three, four followed by four, three, two, one.

Back and forth dealing is faster and improves the cards’ randomness, thus requiring fewer shuffles for a well-mixed deck.

Card shuffling is not just fun and games

Card shuffling has practical applications beyond card games, magic tricks and gambling.

Analysing the mixing time of shuffling helps computer scientists determine the optimal distribution of files and folders in databases. And biologists have considered the mixing time of shuffles to study the order of genes, which can help them estimate the evolutionary distance between two organisms, Fulman says.

Studying “patience sorting,” dealing cards into piles, sheds light on passenger airline boarding, and researchers study card shuffling in hopes of understanding and improving traffic flow.

But mathematicians still puzzle over many questions about card shuffling, Fulman says.

For instance, they want to know the number of shuffles required to thoroughly mix a deck using the almost perfect shuffle technique employed by Las Vegas casino dealers, who perform “neater” riffle shuffles achieving near-perfect alternation from one hand to the other.

They also remain stumped by the optimal guessing strategy to maximize the expected number of correct guesses when turning up cards one at a time after a series of riffle shuffles. An answer to this question is also of interest to gamblers, who want to be able to guess as many correct cards as possible, and to casino executives, who want gamblers to be able to guess as few correct cards as possible.

But given enough time, the odds are that mathematicians like Fulman will sort out these and many other card-shuffling conundrums.

For more such insights, log into our website https://international-maths-challenge.com

Credit of the article given to Ileana Wachtel, University of Southern California


Punctuation in literature of major languages is intriguingly mathematical

A moment’s hesitation… Yes, a full stop here—but shouldn’t there be a comma there? Or would a hyphen be better? Punctuation can be a nuisance; it is often simply neglected. Wrong! The most recent statistical analyses paint a different picture: punctuation seems to “grow out” of the foundations shared by all the (examined) languages, and its features are far from trivial.

To many, punctuation appears as a necessary evil, to be happily ignored whenever possible. Recent analyses of literature written in the world’s current major languages require us to alter this opinion. In fact, the same statistical features of punctuation usage patterns have been observed in several hundred works written in seven, mainly Western, languages.

Punctuation, all ten representatives of which can be found in the introduction to this text, turns out to be a universal and indispensable complement to the mathematical perfection of every language studied. Such a remarkable conclusion about the role of mere commas, exclamation marks or full stops comes from an article by scientists from the Institute of Nuclear Physics of the Polish Academy of Sciences (IFJ PAN) in Cracow, published in the journal Chaos, Solitons & Fractals.

“The present analyses are an extension of our earlier results on the multifractal features of sentence length variation in works of world literature. After all, what is sentence length? It is nothing more than the distance to the next specific punctuation mark— the full stop. So now we have taken all punctuation marks under a statistical magnifying glass, and we have also looked at what happens to punctuation during translation,” says Prof. Stanislaw Drozdz (IFJ PAN, Cracow University of Technology).

Two sets of texts were studied. The main analyses concerning punctuation within each language were carried out on 240 highly popular literary works written in seven major Western languages: English (44), German (34), French (32), Italian (32), Spanish (32), Polish (34) and Russian (32). This particular selection of languages was based on a criterion: the researchers assumed that no fewer than 50 million people should speak the language in question, and that the works written in it should have been awarded no fewer than five Nobel Prizes for Literature.

In addition, for the statistical validity of the research results, each book had to contain at least 1,500 word sequences separated by punctuation marks. A separate collection was prepared to observe the stability of punctuation in translation. It contained 14 works, each of which was available in each of the languages studied (two of the 98 language versions, however, were omitted due to their unavailability).

In total, authors in both collections included such writers as Conrad, Dickens, Doyle, Hemingway, Kipling, Orwell, Salinger, Woolf, Grass, Kafka, Mann, Nietzsche, Goethe, La Fayette, Dumas, Hugo, Proust, Verne, Eco, Cervantes, Sienkiewicz or Reymont.

The attention of the Cracow researchers was primarily drawn to the statistical distribution of the distance between consecutive punctuation marks. It soon became evident that in all the languages studied, it was best described by one of the precisely defined variants of the Weibull distribution.

A curve of this type has a characteristic shape: it grows rapidly at first and then, after reaching a maximum value, descends somewhat more slowly to a certain critical value, below which it reaches zero with small and constantly decreasing dynamics. The Weibull distribution is usually used to describe survival phenomena (e.g. population as a function of age), but also various physical processes, such as increasing fatigue of materials.

“The concordance of the distribution of word sequence lengths between punctuation marks with the functional form of the Weibull distribution was better the more types of punctuation marks we included in the analyses; for all marks the concordance turned out to be almost complete. At the same time, some differences in the distributions are apparent between the different languages, but these merely amount to the selection of slightly different values for the distribution parameters, specific to the language in question. Punctuation thus seems to be an integral part of all the languages studied,” notes Prof. Drozdz.

After a moment he adds with some amusement: “…and since the Weibull distribution is concerned with phenomena such as survival, it can be said with not too much tongue-in-cheek that punctuation has in its nature a literally embedded struggle for survival.”

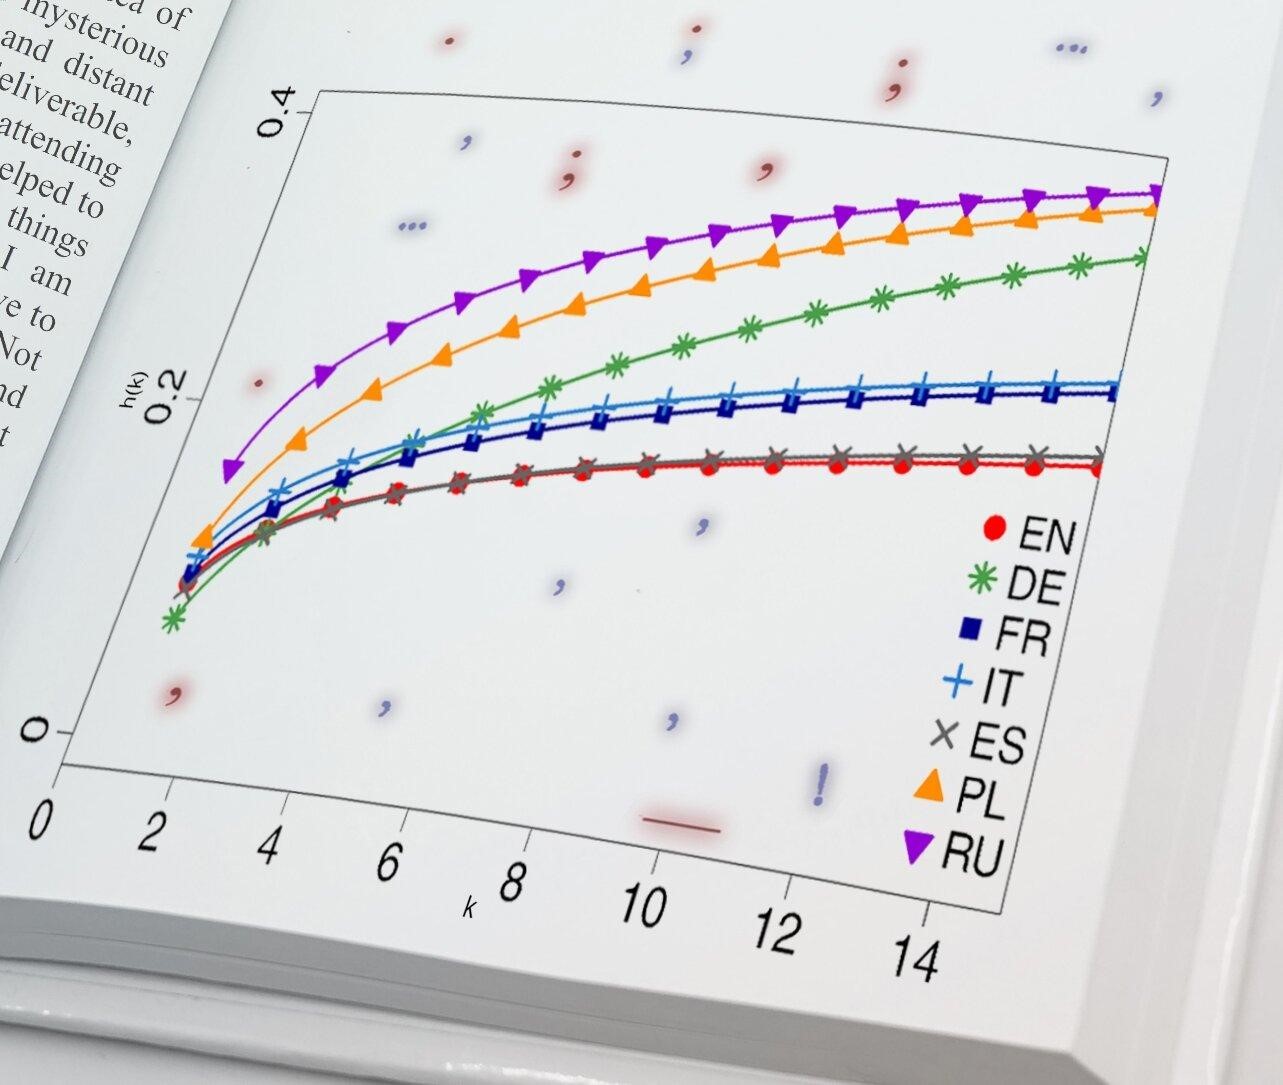
The next stage of the analyses consisted of determining the hazard function. In the case of punctuation, it describes how the conditional probability of success—i.e., the probability of the next punctuation mark—changes if no such mark has yet appeared in the analysed sequence.

The results here are clear: the language characterized by the lowest propensity to use punctuation is English, with Spanish not far behind; Slavic languages proved to be the most punctuation-dependent. The hazard function curves for punctuation marks in the six languages studied appeared to follow a similar pattern, they differed mainly in vertical shift.

German proved to be the exception. Its hazard function is the only one that intersects most of the curves constructed for the other languages. German punctuation thus seems to combine the punctuation features of many languages, making it a kind of Esperanto punctuation.

The above observation dovetails with the next analysis, which was to see whether the punctuation features of original literary works can be seen in their translations. As expected, the language most faithfully transforming punctuation from the original language to the target language turned out to be German.

In spoken communication, pauses can be justified by human physiology, such as the need to catch one’s breath or to take a moment to structure what is to be said next in one’s mind. And in written communication?

“Creating a sentence by adding one word after another while ensuring that the message is clear and unambiguous is a bit like tightening the string of a bow: it is easy at first, but becomes more demanding with each passing moment. If there are no ordering elements in the text (and this is the role of punctuation), the difficulty of interpretation increases as the string of words lengthens. A bow that is too tight can break, and a sentence that is too long can become unintelligible. Therefore, the author is faced with the necessity of ‘freeing the arrow’, i.e. closing a passage of text with some sort of punctuation mark. This observation applies to all the languages analysed, so we are dealing with what could be called a linguistic law,” states Dr. Tomasz Stanisz (IFJ PAN), first author of the article in question.

Finally, it is worth noting that the invention of punctuation is relatively recent—punctuation marks did not occur at all in old texts. The emergence of optimal punctuation patterns in modern written languages can therefore be interpreted as the result of their evolutionary advancement. However, the excessive need for punctuation is not necessarily a sign of such sophistication.

English and Spanish, contemporarily the most universal languages, appear, in the light of the above studies, to be less strict about the frequency of punctuation use. It is likely that these languages are so formalized in terms of sentence construction that there is less room for ambiguity that would need to be resolved with punctuation marks.

For more such insights, log into our website https://international-maths-challenge.com

Credit of the article given to The Henryk Niewodniczanski Institute of Nuclear Physics Polish Academy of Sciences