Here’s the best way to shuffle a pack of cards – with a little help from some maths

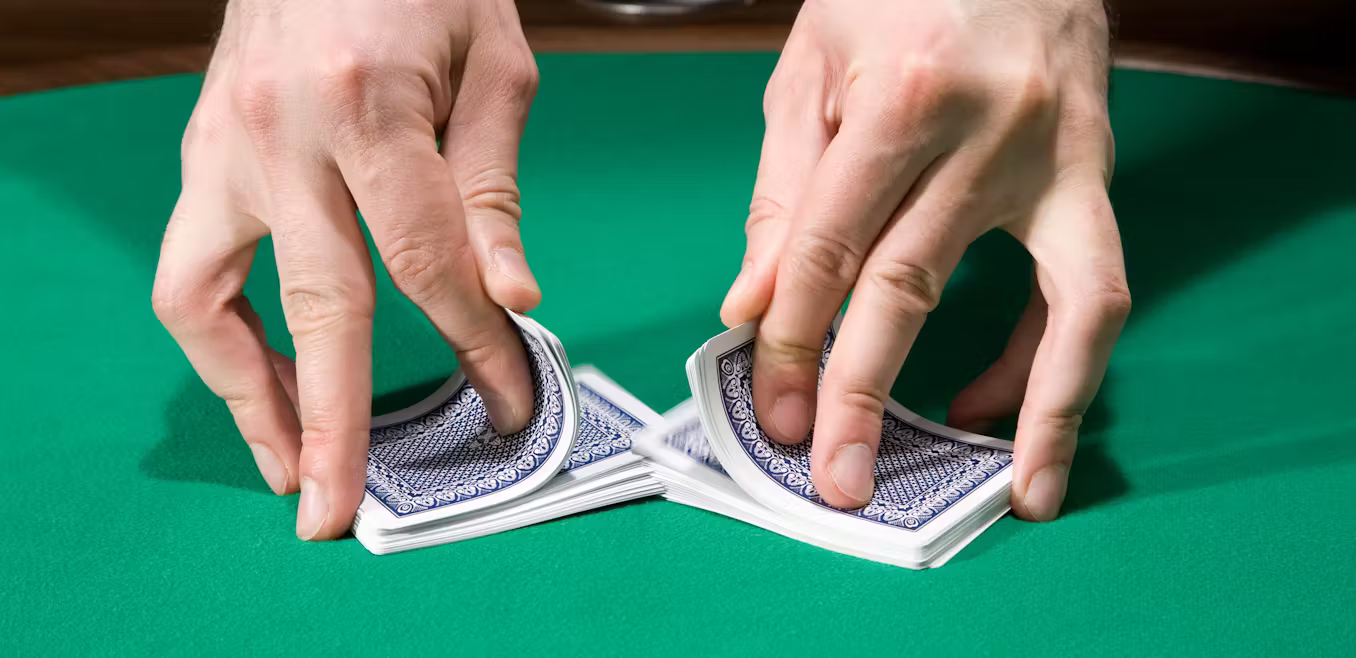
Shuffling a pack of cards isn’t as easy as you think, not if you want to truly randomise the cards. Most people will give a pack a few shuffles with the overhand or riffle methods (where the pack is split and the two halves are interweaved). But research has shown this isn’t enough to produce a sufficiently random order to make sure the card game being played is completely fair and to prevent people cheating.

As I wrote in a recent article about card counting, not having an effective shuffling mechanism can be a serious problem for casinos:

Players have used shuffle tracking, where blocks of cards are tracked so that you have some idea when they will appear. If you are given the option to cut the pack, you try and cut the pack near where you think the block of cards you are tracking is so that you can bet accordingly. A variant on this is to track aces as, if you know when one is likely to appear, you have a distinct advantage over the casino.

So how can you make sure your cards are well and truly shuffled?

To work out how many ways there are of arranging a standard 52-card deck, we multiply 52 by all the numbers that come before it (52 x 51 x 50 … 3 x 2 x 1). This is referred to as “52 factorial” and is usually written as “52!” by mathematicians. The answer is so big it’s easier to write it using scientific notation as 8.0658175e+67, which means it’s a number beginning with 8, followed by 67 more digits.

To put this into some sort of context, if you dealt one million hands of cards every second, it would take you 20 sexdecillion, or 20,000,000,000,000,000,000,000,000,000,000,000,000,000,000,000,000,000, years to deal the same number of hands as there are ways to arrange a deck of cards.

You would think that it would be easy to get a random order from that many permutations. In fact, every arrangement is, in a sense, random. Even one where the cards are ordered by suit and then rank could be considered random. It is only the interpretation we put on this order that would make most people not consider it random. This is the same as the idea that the lottery is less likely to throw up the numbers one to six, whereas in reality this combination is just as probable as any other.

In theory, you could shuffle a deck so that the cards emerged in number order (all the aces, followed by all the twos, followed by all the threes and so on), with each set of numbers in the same suit order (say spades, hearts, diamonds and clubs). Most people would not consider this random, but it is just as likely to appear as any other specific arrangement of cards (very unlikely). This is an extreme example but you could come up with an arrangement that would be seen as random when playing bridge because it offered the players no advantage, but wouldn’t be random for poker because it produced consistently strong hands.

But what would a casino consider random? Mathematicians have developed several ways of measuring how random something is. Variation distance and separation distance are two measures calculated by mathematical formulas. They have a value of 1 for a deck of cards in perfect order (sorted by numbers and suits) and lower values for more mixed arrangements. When the values are less than 0.5, the deck is considered randomly shuffled. More simply, if you can guess too many cards in a shuffled deck, then the deck is not well shuffled.

Persi Diaconis is a mathematician who has been studying card shuffling for over 25 years. Together with and Dave Bayer, he worked out that to produce a mathematically random pack, you need to use a riffle shuffle seven times if you’re using the variation distance measure, or 11 times using the separation distance. The overhand shuffle, by comparison, requires 10,000 shuffles to achieve randomness.

“The usual shuffling produces a card order that is far from random,” Diaconis has said. “Most people shuffle cards three or four times. Five times is considered excessive”.

But five is still lower than the number required for an effective shuffle. Even dealers in casinos rarely shuffle the required seven times. The situation is worse when more than one deck is used, as is the case in blackjack. If you are shuffling two decks, you should shuffle nine times and for six decks you need to shuffle twelve times.

Many casinos now use automatic shuffling machines. This not only speeds up the games but also means that shuffles can be more random, as the machines can shuffle for longer than the dealers. These shuffling machines also stop issues such as card counting and card tracking.

But even these machines are not enough. In another study, Diaconis and his colleagues were asked by a casino to look at a new design of a card shuffling machine that the casino had built. The researchers found that the machine was not sufficiently random, as they simply did not shuffle enough times. But using the machine twice would resolve the problem.

So next time you’re at a casino, take a look at how many times the dealers shuffle. The cards may not be as random as you think they are, which could be to your advantage.

For more insights like this, visit our website at www.international-maths-challenge.com.
Credit of the article given to Graham Kendall

Eleven games and activities for parents to encourage maths in early learning

How can parents best help their children with their schooling without actually doing it for them? This article is part of our series on Parents’ Role in Education, focusing on how best to support learning from early childhood to Year 12.

Before beginning official schooling, parents can give their young children a boost in learning mathematics by noticing, exploring and talking about maths during everyday activities at home or out and about.

New research shows that parents play a key role in helping their children learn mathematics concepts involving time, shape, measurement and number. This mathematical knowledge developed before school is predictive of literacy and numeracy achievements in later grades.

One successful approach for strengthening the role of parents in mathematics learning is Let’s Count, implemented by The Smith Family. This builds on parents’ strengths and capabilities as the first mathematics educators of their children.

The Let’s Count longitudinal evaluation findings show that when early years educators encourage parents and families to confidently notice, explore and talk about mathematics in everyday activities, their young children’s learning flourishes.

Indeed, children whose families had taken part in Let’s Count showed greater mathematical skills than those in a comparison group whose families had not participated. For example, they were more successful with correctly making a group of seven (89% versus 63%); continuing patterns (56% versus 34%); and counting collections of 20 objects (58% versus 37%).

These findings, among many others, are a strong endorsement of the power of families helping their children to learn about mathematics in everyday contexts.

What parents can do to promote maths every day

Discussing and exploring mathematics with children requires no special resources. Instead, what is needed is awareness and confidence for parents about how to engage.

However, our research shows that one of the biggest barriers to this is parents’ lack of confidence in leading maths education at home.

Through examining international research, we identified the type of activities that are important for early maths learning which are easy for parents to use. These include:

  1. Comparing objects and describing which is longer, shorter, heavier, or holds less.
  2. Playing with and describing 2D shapes and 3D objects.
  3. Describing where things are positioned, for example, north, outside, behind, opposite.
  4. Describing, copying, and extending patterns found in everyday situations.
  5. Using time-words to describe points in time, events and routines (including days, months, seasons and celebrations).
  6. Comparing and talking about the duration of everyday events and the sequence in which they occur.
  7. Saying number names forward in sequence to ten (and eventually to 20 and beyond).
  8. Using numbers to describe and compare collections.
  9. Using perceptual and conceptual subitising (recognising quantities based on visual patterns), counting and matching to compare the number of items in one collection with another.
  10. Showing different ways to make a total (at first with models and small numbers).
  11. Matching number names, symbols and quantities up to ten.

Games to play using everyday situations

Neuroscience research has provided crucial evidence about the importance of early nurturing and support for learning, brain development, and the development of positive dispositions for learning.

Early brain development or “learning” is all about the quality of children’s sensory and motor experiences within positive and nurturing relationships and environments. This explains why programs such as Let’s Count are successful.

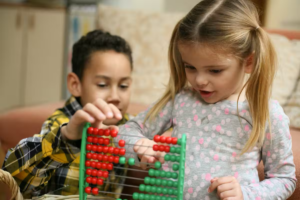
Sometimes it can be difficult to come up with activities and games to play that boost children’s mathematics learning, but there are plenty. For example, talk with your children as you prepare meals together. Talk about measuring and comparing ingredients and amounts.

You can play children’s card games and games involving dice, such as Snakes and Ladders, or maps, shapes and money. You can also read stories and notice the mathematics – the sequence of events, and the descriptions of characters and settings.

Although these activities may seem simple and informal, they build on what children notice and question, give families the chance to talk about mathematical ideas and language, and show children that maths is used throughout the day.

Parents are encouraged to provide learning opportunities that are engaging and relevant to their children. www.shutterstock.com

Make it relevant to them

Most importantly, encouraging maths and numeracy in young children relies on making it appealing and relevant to them.

For example, when you take your child for a walk down the street, in the park or on the beach, bring their attention to the objects around them – houses, cars, trees, signs.

Talk about the shapes and sizes of the objects, talk about and look for similarities and differences (for example: let’s find a taller tree or a heavier rock), count the number of cars parked in the street or time how long it takes to reach the next corner.

Discuss the temperature or the speed of your walking pace.

Collect leaves or shells, and make repeating patterns on the sand or grass, or play Mathematical I Spy (I spy with my little eye, something that’s taller than mum).

It is never too soon to begin these activities. Babies who are only weeks old notice differences in shapes and the number of objects in their line of sight.

So, from the earliest of ages, talk with your child about the world around them, being descriptive and using mathematical words. As they grow, build on what they notice about shapes, numbers, and measures. This is how you teach them mathematics.

For more insights like this, visit our website at www.international-maths-challenge.com.
Credit of the article given to Sivanes Phillipson, Ann Gervasoni


AI Translates Maths Problems Into Code To Make Them Easier To Solve

An artificial intelligence that can turn mathematical concepts written in English into a formal proving language for computers could make problems easier for other AIs to solve.

Maths can be difficult for a computer to understand

An artificial intelligence can translate maths problems written in plain English to formal code, making them easier for computers to solve in a crucial step towards building a machine capable of discovering new maths.

Computers have been used to verify mathematical proofs for some time, but they can only do it if the problems have been prepared in a specifically designed proving language, rather than for the mix of mathematical notation and written text used by mathematicians. This process, known as formalisation, can take years of work for just a single proof, so only a small fraction of mathematical knowledge has been formalised and then proved by a machine.

Yuhuai Wu at Google and his colleagues used a neural network called Codex created by AI research company OpenAI. It has been trained on large amounts of text and programming data from the web and can be used by programmers to generate workable code.

Proving languages share similarities with programming languages, so the team decided to see if Codex could formalise a bank of 12,500 secondary school maths competition problems. It was able to translate a quarter of all problems into a format that was compatible with a formal proof solver program called Isabelle. Many of the unsuccessful translations were the result of the system not understanding certain mathematical concepts, says Wu. “If you show the model with an example that explains that concept, the model can then quickly pick it up.”

To test the effectiveness of this auto-formalisation process, the team then applied Codex to a set of problems that had already been formalised by humans. Codex generated its own formal versions of these problems, and the team used another AI called MiniF2F to solve both versions.

The auto-formalised problems improved MiniF2F’s success rate from 29 per cent to 35 per cent, suggesting that Codex was better at formalising these problems than the humans were.

It is a modest improvement, but Wu says the team’s work is only a proof of concept. “If the goal is to train a machine that is capable of doing the same level of mathematics as the best humans, then auto-formalisation seems to be a very crucial path towards it,” says Wu.

Improving the success rate further would allow AIs to compete with human mathematicians, says team member Albert Jiang at the University of Cambridge. “If we get to 100 per cent, we will definitely be creating an artificial intelligence agent that’s able to win an International Maths Olympiad gold medal,” he says, referring to the top prize in a leading maths competition.

While the immediate goal is to improve the auto-formalisation models, and automated proving machines, there could be larger implications. Eventually, says Wu, the models could uncover areas of mathematics currently unknown to humans.

The capacity for reasoning in such a machine could also make it well-suited for verification tasks in a wide range of fields. “You can verify whether a piece of software is doing exactly what you asked it to do, or you can verify hardware chips, so it has applications in financial trading algorithms and hardware design,” says Jiang.

It is an exciting development for using machines to find new mathematics, says Yang-Hui He at the London Institute for Mathematical Sciences, but the real challenge will be in using the model on mathematical research, much of which is written in LaTeX, a typesetting system. “We only use LaTeX because it types nicely, but it’s a natural language in some sense, it has its own rules,” says He.

Users can define their own functions and symbols in LaTeX that might only be used in a single mathematical paper, which could be tricky for a neural network to tackle that has only been trained on the plain text, says He.

For more such insights, log into www.international-maths-challenge.com.

*Credit for article given to Alex Wilkins*


“X” Marks the Spot: Finding the Center of Mass

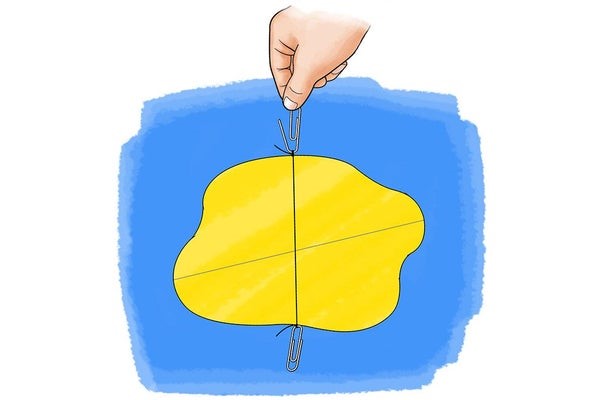
Credit: Can you find the center of a shape? You’ll be able to–even for the oddest oblong creation–with this simple science activity. No strings attached (okay, maybe one)!  George Retseck

A centering science activity

Introduction
With a little time, you can probably find the center of simple shapes such as circles and squares pretty easily. But how do you find the “middle” of an irregular shape such as a drawing of a dog or a cat? This project will show you how to do it using nothing but string and paper clips!

Background
How do you define the exact center of an object? One way to do this is to find the object’s center of mass. The center of mass is the point about which an object will balance if you try to rest it on your fingertip. Or if you hang an object, for example a picture frame from a nail, the center of mass will hang directly below the nail.

For symmetrical objects, finding the center of mass is relatively easy. For example, for a rectangular picture frame, you know the center of mass is in the middle of the rectangle and you can find that with a ruler. When you hang the picture frame, you will make sure it is centered on the nail—otherwise it will tip to one side and will be off-center. The same applies to other symmetrical objects such as a spherical basketball; you know the center of mass is in the middle of the sphere.

What about irregularly shaped objects such as a dog or cat or person? Now finding the center of mass is not so easy! This activity will show you how to find the center of mass for any two-dimensional shape you cut out of paper using a trick that has to do with the hanging picture frame mentioned above. If you hang a shape from a single point, you know the center of mass will always rest directly below that point. So, if you hang a shape from two different points (one at a time) and draw a line straight down from each point, the center of mass is where those lines intersect. This technique can be used for any irregular two-dimensional shape. Don’t believe it? Try this activity to find out!

Materials

  • Paper (Heavier paper, such as construction paper, card stock or thin cardboard from the side of a cereal box will work best.)
  • Scissors (Have an adult help with cutting if necessary—especially on thicker materials.)
  • String
  • Pencil
  • Ruler
  • Two paper clips or a pushpin and another small, relatively heavy object you can tie to the string (such as a metal washer)

Preparation

  • Cut a piece of string about one foot long and tie a paper clip to each end. (Alternatively, you can use any other small object such as a metal washer on one end—this will serve as a weight—and any other small, pointy object like a needle or pushpin on the other end—this will be used to puncture the paper.)

Procedure

  • Start with an easy shape: Cut out a rectangular piece of paper or cardboard. Can you guess where the center of mass of the rectangle is? If so, use a ruler to measure where you think it will be and mark this spot with your pencil.
  • Punch several small holes around the edge of the paper. Make them as close to the edge as possible without ripping the paper. (This is important for the accuracy of this technique). The exact location of the holes does not matter but this technique will work best if you space them all the way around the edge (not just put two holes right next to each other).
  • Now poke one end of one paper clip (or pushpin) through one of the holes to act like a hanging hook. Make sure the paper can swing easily from the hook and does not get stuck (Rotate it back and forth a few times to loosen the hole if necessary).
  • Hold on to your “hook” and hold the paper up against the wall. Let the paper swing freely and make sure the string can hang straight down and does not get stuck.
  • Use a pencil and ruler to draw a straight line on the paper along the string. Does this line go through the center of mass you predicted earlier?
  • Now, hang your paper from a different hole and repeat the process. Where does this line intersect the first line?
  • Repeat the process several more times with different holes. Do all the lines intersect at the same point?
  • Now cut out an irregular shape. You can cut out a “blob” or draw something like a dog or cat and then cut out the outline. Make sure the shape you cut out remains stiff and flat. (That is, do not cut very thin sections that might be floppy.) Can you use a ruler to predict where the center of mass of your irregular shape will be? This is much harder!
  • Punch holes around the edge of your irregular shape and repeat the activity. One at a time, hang the shape and the string from one of the holes and draw a line along the string. Where do the lines intersect? Does this match up with what you predicted?
  • Extra: If you use a stiff enough material to cut out your shape (such as cardboard), can you try balancing it on your fingertip at the center of mass? What happens if you try to balance it about another point?

Observations and results
You should have found that the center of mass of the rectangle is right in the middle of the piece—halfway along the width and halfway along the height. You can easily locate this spot with a ruler. Then, when you hang the rectangle from a hole on its edge, the string should always pass through this point, regardless of which hole you use. Whereas it is much harder to predict the center of mass for an irregular shape, the same principle holds true.

Regardless of what point you hang the irregular shape from, the string will always pass through the center of mass. So, if you hang it from two or more points (one at a time), you can find the intersection of these lines—and that is the center of mass.

Note that due to small variables in the activity (such as friction on the hook that prevents the paper from rotating perfectly or the holes not being close enough to the edge of the paper), if you draw multiple lines, they might not all intersect in exactly the same place but they should still be fairly close to one another.

For more insights like this, visit our website at www.international-maths-challenge.com.

Credit of the article given to Ben Finio & Science Buddies


What Are the Chances?

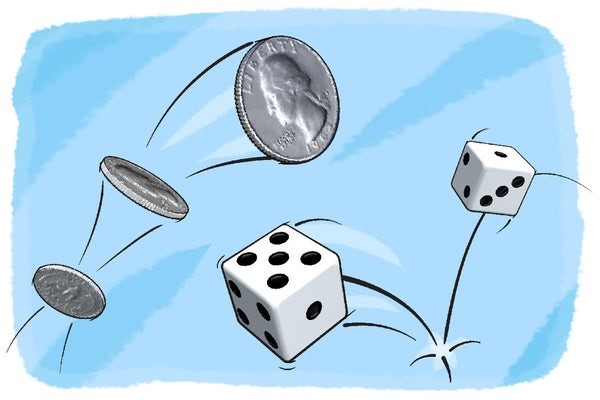
Credit: Heads or tails: Is it a 50-50 chance? Crunch some numbers and flip some coins to find out! George Retseck

A probabilistic science project from Science Buddies

Introduction
Have you ever heard anyone say the chance of something happening is “50–50”? What does that actually mean? This phrase has something to do with probability. Probability tells you how likely it is that an event will occur. This means that for certain events you can actually calculate how likely it is that they will happen. In this activity, you will do these calculations and then test them to see whether they hold true for reality!

Background
Probability allows us to quantify the likelihood an event will occur. You might be familiar with words we use to talk about probability, such as “certain,” “likely,” “unlikely,” “impossible,” and so on. You probably also know that the probability of an event happening spans from impossible, which means that this event will not happen under any circumstance, to certainty, which means that an event will happen without a doubt. In mathematics, these extreme probabilities are expressed as 0 (impossible) and 1 (certain). This means a probability number is always a number from 0 to 1. Probability can also be written as a percentage, which is a number from 0 to 100 percent. The higher the probability number or percentage of an event, the more likely is it that the event will occur.

The probability of a certain event occurring depends on how many possible outcomes the event has. If an event has only one possible outcome, the probability for this outcome is always 1 (or 100 percent). If there is more than one possible outcome, however, this changes. A simple example is the coin toss. If you toss a coin, there are two possible outcomes (heads or tails). As long as the coin was not manipulated, the theoretical probabilities of both outcomes are the same–they are equally probable. The sum of all possible outcomes is always 1 (or 100 percent) because it is certain that one of the possible outcomes will happen. This means that for the coin toss, the theoretical probability of either heads or tails is 0.5 (or 50 percent).

It gets more complicated with a six-sided die. In this case if you roll the die, there are 6 possible outcomes (1, 2, 3, 4, 5 or 6). Can you figure out what the theoretical probability for each number is? It is 1/6 or 0.17 (or 17 percent). In this activity, you will put your probability calculations to the test. The interesting part about probabilities is that knowing the theoretical likelihood of a certain outcome doesn’t necessarily tell you anything about the experimental probabilities when you actually try it out (except when the probability is 0 or 1). For example, outcomes with very low theoretical probabilities do actually occur in reality, although they are very unlikely. So how do your theoretical probabilities match your experimental results? You will find out by tossing a coin and rolling a die in this activity.

Materials

  • Coin
  • Six-sided die
  • Paper
  • Pen or pencil

Preparation

  • Prepare a tally sheet to count how many times the coin has landed on heads or tails.
  • Prepare a second tally sheet to count how often you have rolled each number with the die.

Procedure

  • Calculate the theoretical probability for a coin to land on heads or tails, respectively. Write the probabilities in fraction form. What is the theoretical probability for each side? 
  • Now get ready to toss your coin. Out of the 10 tosses, how often do you expect to get heads or tails?
  • Toss the coin 10 times. After each toss, record if you got heads or tails in your tally sheet.
  • Count how often you got heads and how often you got tails. Write your results in fraction form. For example, 3 tails out of 10 tosses would be 3/10 or 0.3. (The denominator will always be the number of times you toss the coin, and the numerator will be the outcome you are measuring, such as the number of times the coin lands on tails.) You could also express the same results looking at heads landings for the same 10 tosses. So that would be 7 heads out of 10 tosses: 7/10 or 0.7. Do your results match your expectations?
  • Do another 10 coin tosses. Do you expect the same results? Why or why not?
  • Compare your results from the second round with the ones from the first round. Are they the same? Why or why not?
  • Continue tossing the coin. This time toss it 30 times in a row. Record your results for each toss in your tally sheet. What results do you expect this time?
  • Look at your results from the 30 coin tosses and convert them into fraction form. How are they different from your previous results for the 10 coin tosses?
  • Count how many heads and tails you got for your total coin tosses so far, which should be 50. Again, write your results in fraction form (with the number of tosses as the denominator (50) and the result you are tallying as the numerator). Does your experimental probability match your theoretical probability from the first step? (An easy way to convert this fraction into a percentage is to multiply the denominator and the numerator each by 2, so 50 x 2 = 100. And after you multiply your numerator by 2, you will have a number that is out of 100—and a percentage.)
  • Calculate the theoretical probability for rolling each number on a six-sided die. Write the probabilities in fraction form. What is the theoretical probability for each number?
  • Take the dice and roll it 10 times. After each roll, record which number you got in your tally sheet. Out of the 10 rolls, how often do you expect to get each number?
  • After 10 rolls, compare your results (written in fraction form) with your predictions. How close are they?
  • Do another 10 rolls with the dice, recording the result of each roll. Do your results change?
  • Now roll the dice 30 times in a row (recording the result after each roll). How often did you roll each number this time?
  • Count how often you rolled each number in all combined 50 rolls. Write your results in fraction form. Does your experimental probability match your theoretical probability? (Use the same formula you used for the coin toss, multiplying the denominator and the numerator each by 2 to get the percentage.)
  • Compare your calculated probability numbers with your actual data for both activities (coin and dice). What do your combined results tell you about probability?
  • Extra: Increase the number of coin tosses and dice rolls even further. How do your results compare with the calculated probabilities with increasing number of events (tosses or rolls)? 
  • Extra: Look up how probabilities can be represented by probability trees. Can you draw a probability tree for the coin toss and dice roll?
  • Extra: If you are interested in more advanced probability calculations, find out how you can calculate the probability of a recurring event, for example: How likely it is that you would get two heads in a row when tossing a coin? 

Observations and Results
Calculating the probabilities for tossing a coin is fairly straightforward. A coin toss has only two possible outcomes: heads or tails. Both outcomes are equally likely. This means that the theoretical probability to get either heads or tails is 0.5 (or 50 percent). The probabilities of all possible outcomes should add up to 1 (or 100 percent), which it does. When you tossed the coin 10 times, however, you most likely did not get five heads and five tails. In reality, your results might have been 4 heads and 6 tails (or another non-5-and-5 result). These numbers would be your experimental probabilities. In this example, they are 4 out of 10 (0.4) for heads and 6 out of 10 (0.6) for tails. When you repeated the 10 coin tosses, you probably ended up with a different result in the second round. The same was probably true for the 30 coin tosses. Even when you added up all 50 coin tosses, you most likely did not end up in a perfectly even probability for heads and tails. Your experimental probabilities thus probably didn’t match your calculated (theoretical) probabilities.

You likely observed a similar phenomenon when rolling the dice. Although the theoretical probability for each number is 1 out of 6 (1/6 or 0.17), in reality your experimental probabilities probably looked different. Instead of rolling each number 17 percent out of your total rolls, you might have rolled them more or less often.

If you continued tossing the coin or rolling the dice, you probably have observed that the more trials (coin tosses or dice rolls) you did, the closer the experimental probability was to the theoretical probability. Overall these results mean that even if you know the theoretical probabilities for each possible outcome, you can never know what the actual experimental probabilities will be if there is more than one outcome for an event. After all, a theoretical probability is just predicting how the chances are that an event or a specific outcome occurs—it won’t tell you what will actually happen!

For more insights like this, visit our website at www.international-maths-challenge.com.

Credit of the article given to Science Buddies & Svenja Lohner