Mathematics of scale: Big, small and everything in between

Breathe. As your lungs expand, air fills 500 million tiny alveoli, each a fraction of a millimeter across. As you exhale, these millions of tiny breaths merge effortlessly through larger and larger airways into one ultimate breath.

These airways are fractal.

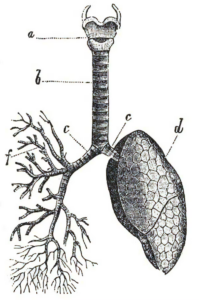
The branches within lungs are an example of self-similarity. Brockhaus and Efron Encyclopedic Dictionary/Wikimedia

Fractals are a mathematical tool for describing objects with detail at every scale. Mathematicians and physicists like me use fractals and related concepts to understand how things change going from small to big.

You and I translate between vastly different scales when we think about how our choices affect the world. Is this latte contributing to climate change? Should I vote in this election?

These conceptual tools apply to the body as well as landscapes, natural disasters and society.

Fractals everywhere

In 1967, mathematician Benoit Mandelbrot asked, “How long is the coast of Britain?”

It’s a trick question. The answer depends on how you measure it. If you trace the outline on a map, you get one answer, but if you walk the coastline with a meter stick, the result is quite different. Anyone who has tried to estimate the length of a rugged hiking trail from a map knows the treachery of the large-scale picture.

Satellite image of Great Britain and Northern Ireland. NASA

That’s because lungs, the British coastline and hiking trails all have fractality: their length, number of branches or some other quantity depends on the scale or resolution you use to measure them.

The coastline is also self-similar – it’s made out of smaller copies of itself. Fern fronds, trees, snail shells, landscapes, the silhouettes of mountains and river networks all look like smaller versions of themselves.

That’s why, when you’re looking at an aerial photograph of a landscape, it’s often hard to tell whether the scale bar should be 50 km or 500 m.

Your lungs are self-similar, because the body finely calibrates each branch in exact proportions, making each branch a smaller replica of the previous. This modular design makes lungs efficient at any size. Think of a child and an adult, or a mouse, a whale. The only difference between small and large is in how many times the airways branch.

Self-similarity and fractality appear in art and architecture, in the arches within arches of Roman aqueducts and the spires of Gothic cathedrals that mirror the forest canopy. Even ancient Chinese calligraphers Huai Su and Yan Zhenqing prized the fractality of summer clouds, cracks in a wall and water stains in a leaking house in 722.

Scale invariance

Self-similar objects have a scale invariance. In other words, some property holds regardless of how big they get, such as the efficiency of lungs.

In effect, scale invariance describes what changes between scales by saying what doesn’t change.

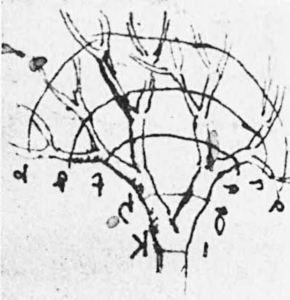
A sketch from Leonardo da Vinci’s notes on tree branches. Fractal Foundation

Leonardo da Vinci observed that, as trees branch, the total cross-sectional area of all branches is preserved. In other words, going from trunk to twigs, the number of branches and their diameter change with each branching, but the total thickness of all branches bundled together stays the same.

Da Vinci’s observation implies a scale invariance: For every branch of a certain radius, there are four downstream branches with half that radius.

Earthquake frequency has a similar scale invariance, which was observed in the 1940s. The big ones come to mind – Lisbon 1755, San Francisco 1989 – but many small earthquakes occur in California every day. The Gutenberg-Richter law says that earthquake frequency depends on the size of the earthquake. The answer is surprisingly simple. A tenfold bigger earthquake occurs roughly one-tenth as often.

Society and the power law

A 19th-century economist Vilifredo Pareto – famous in business school for the 80/20 rule – observed that the number of families with a certain wealth is inversely proportional to their wealth, raised to some exponent. Pareto measured the exponent for different years and different countries and found that it was usually around 1.5.

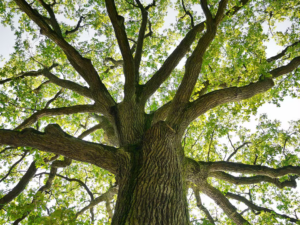
Patterns in an oak’s branches. Schlegelfotos/shutterstock.com

Pareto’s wealth distribution came to be known as the power law, ostensibly because of the exponent or “power.”

Anything self-similar has a corresponding power law. In an April paper, my colleague and I describe the corresponding power law for lungs, blood vessels and trees. It differs from Pareto’s power law only by taking into account specific ratios between branches.

The sizes of fortunes then are akin to the sizes of tree twigs or blood vessels – a few trunks or large branches and exponentially more tiny twigs.

Pareto thought of his distribution of wealth as a natural law, but many different models of social organization give rise to a Pareto distribution and societies do vary in wealth inequality. The higher Pareto’s exponent, the more egalitarian the society.

From understanding how humans are made up of tiny cells to how we affect the planet, self-similarity, fractality and scale invariance often help translate from one level of organization to another.

For more insights like this, visit our website at www.international-maths-challenge.com.
Credit of the article given to Mitchell Newberry


How Math Puzzles Help You Plan the Perfect Party

Credit: Getty Images

The right mix of people who already know one another, of boys and girls–Ramsey numbers may hold the answer

Let’s say you’re planning your next party and agonizing over the guest list. To whom should you send invitations? What combination of friends and strangers is the right mix?

It turns out mathematicians have been working on a version of this problem for nearly a century. Depending on what you want, the answer can be complicated.

Our book, “The Fascinating World of Graph Theory,” explores puzzles like these and shows how they can be solved through graphs. A question like this one might seem small, but it’s a beautiful demonstration of how graphs can be used to solve mathematical problems in such diverse fields as the sciences, communication and society.

A puzzle is born

While it’s well-known that Harvard is one of the top academic universities in the country, you might be surprised to learn that there was a time when Harvard had one of the nation’s best football teams. But in 1931, led by All–American quarterback Barry Wood, such was the case.

That season Harvard played Army. At halftime, unexpectedly, Army led Harvard 13–0. Clearly upset, Harvard’s president told Army’s commandant of cadets that while Army may be better than Harvard in football, Harvard was superior in a more scholarly competition.

Though Harvard came back to defeat Army 14-13, the commandant accepted the challenge to compete against Harvard in something more scholarly. It was agreed that the two would compete – in mathematics. This led to Army and Harvard selecting mathematics teams; the showdown occurred in West Point in 1933. To Harvard’s surprise, Army won.

The Harvard–Army competition eventually led to an annual mathematics competition for undergraduates in 1938, called the Putnam exam, named for William Lowell Putnam, a relative of Harvard’s president. This exam was designed to stimulate a healthy rivalry in mathematics in the United States and Canada. Over the years and continuing to this day, this exam has contained many interesting and often challenging problems – including the one we describe above.

Red and blue lines

The 1953 exam contained the following problem (reworded a bit): There are six points in the plane. Every point is connected to every other point by a line that’s either blue or red. Show that there are three of these points between which only lines of the same color are drawn.

In math, if there is a collection of points with lines drawn between some pairs of points, that structure is called a graph. The study of these graphs is called graph theory. In graph theory, however, the points are called vertices and the lines are called edges.

Graphs can be used to represent a wide variety of situations. For example, in this Putnam problem, a point can represent a person, a red line can mean the people are friends and a blue line means that they are strangers.

Show that there are three points connected by lines of the same color. Credit: richtom80 Wikimedia (CC BY-SA 3.0)

For example, let’s call the points A, B, C, D, E, F and select one of them, say A. Of the five lines drawn from A to the other five points, there must be three lines of the same color.

Say the lines from A to B, C, D are all red. If a line between any two of B, C, D is red, then there are three points with only red lines between them. If no line between any two of B, C, D is red, then they are all blue.

What if there were only five points? There may not be three points where all lines between them are colored the same. For example, the lines A–B, B–C, C–D, D–E, E–A may be red, with the others blue.

From what we saw, then, the smallest number of people who can be invited to a party (where every two people are either friends or strangers) such that there are three mutual friends or three mutual strangers is six.

What if we would like four people to be mutual friends or mutual strangers? What is the smallest number of people we must invite to a party to be certain of this? This question has been answered. It’s 18.

What if we would like five people to be mutual friends or mutual strangers? In this situation, the smallest number of people to invite to a party to be guaranteed of this is – unknown. Nobody knows. While this problem is easy to describe and perhaps sounds rather simple, it is notoriously difficult.

Ramsey numbers

What we have been discussing is a type of number in graph theory called a Ramsey number. These numbers are named for the British philosopher, economist and mathematician Frank Plumpton Ramsey.

Ramsey died at the age of 26 but obtained at his very early age a very curious theorem in mathematics, which gave rise to our question here. Say we have another plane full of points connected by red and blue lines. We pick two positive integers, named r and s. We want to have exactly r points where all lines between them are red or s points where all lines between them are blue. What’s the smallest number of points we can do this with? That’s called a Ramsey number.

For example, say we want our plane to have at least three points connected by all red lines and three points connected by all blue lines. The Ramsey number – the smallest number of points we need to make this happen – is six.

When mathematicians look at a problem, they often ask themselves: Does this suggest another question? This is what has happened with Ramsey numbers – and party problems.

For example, here’s one: Five girls are planning a party. They have decided to invite some boys to the party, whether they know the boys or not. How many boys do they need to invite to be certain that there will always be three boys among them such that three of the five girls are either friends with all three boys or are not acquainted with all three boys? It’s probably not easy to make a good guess at the answer. It’s 41!

Very few Ramsey numbers are known. However, this doesn’t stop mathematicians from trying to solve such problems. Often, failing to solve one problem can lead to an even more interesting problem. Such is the life of a mathematician.

This article was originally published on The Conversation. Read the original article.

For more insights like this, visit our website at www.international-maths-challenge.com.

Credit of the article given to Gary Chartrand, Arthur Benjamin, Ping Zhang & The Conversation US