Students generally learn to divide polynomials using long division or synthetic division. This post is about another method for dividing polynomials, the “grid” method. Although this method is used at some schools, I have not found it in any textbook (if you know of any, please let me know).
The grid method makes polynomial division a fun calculation – an almost SUDOKU-like process. The recreational challenge here is to master the method, and to convince yourself that it actually works in all cases (which cases does it work well for, and which are more difficult?).
Before tackling polynomial grid division, you need to be familiar with polynomial grid multiplication. It is the symbolic analog to the familiar “algebra tiles” manipulative, so if you have worked with these, it should be reasonably familiar.
Polynomial Grid Multiplication
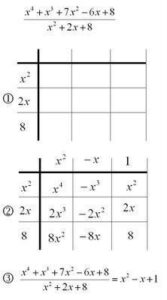
In polynomial grid multiplication, the two factors are arranged on the edges of a grid – the number of terms of the factors determine the number of horizontal and vertical lines that make up the grid.
The overall product is found by filling in the cells of the grid with the product of the terms for the row and column, and then summing up all the contents of the interior of the grid.
What polynomial grid multiplication does for us is provide an explicit way to keep track of the distributive property: each term-by-term product gets its own cell.
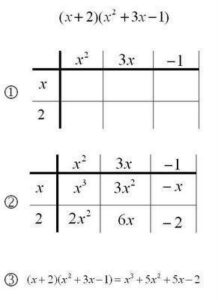
In the example below, the two factors are placed along the edges of the grid (1). One factor provides the row headings, the other provides the column headings. Then each cell is filled in with the product of the terms from the row and column (2). Finally, the cells are added together (like terms are combined) to find the final product (3). If the terms of the factors are placed according to the same order (descending powers of x, in our example) and there are no missing terms, then like-terms of the product are found along the diagonals of the grid.
Polynomial Grid Division
Polynomial grid division works the same way as polynomial grid multiplication, but in reverse – we start by knowing one of the factors (placed along the edge of the grid), and by knowing what we want the product to be (without knowing exactly how it is ‘split up’ in the grid). Using this knowledge we work backwards, filling in the grid and the top edge one cell at a time until we are done.
Consider the example below. In (1) we create an empty grid with the denominator (divisor) playing the role of one of the factors. Since this question involves a degree 3 polynomial divided by a degree 1 polynomial, we know that the other factor (the quotient) must be degree 2. This allows us to create a grid with the correct size. In step (2) we use the highest power of the dividend (the numerator) to begin to fill in the grid – we know that 27x^3 must be in the top left. This in turn tells us that the first column entry must be 9x^2 (so that the row and column multiply to 27x^3). In step (3) we use this to fill in all of the first column, multiplying 9x^2 by the terms of the row entries.
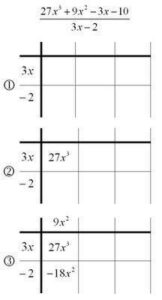
In step (3) we now have a quadratic term -18x^2. But we know from looking at the dividend (numerator) that in the final answer we actually want 9x^2. Consequently, the other entry on the quadratic diagonal must be 27x^2, so that the whole diagonal sums to 9x^2 . Filling this in for step (4) tells us what all the entries in the second column should be (step 5). Now that we have a linear entry -18x, we know that we need to add in a 15x so that the overall sum gives a -3x (step 6).
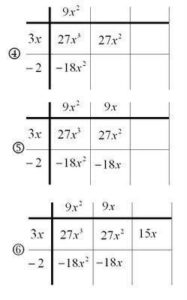
Having a 15x tells us that the top entry must be 5 (the product of 5 and 3x gives us 15x). Filling this in in step 7 allows us to complete the table, and we see that our final constant entry is -10, as hoped for. Now that the grid has been filled in and it matches the dividend, we can read the answer off the top – the factor that we have uncovered is the quotient we were hoping to calculate.
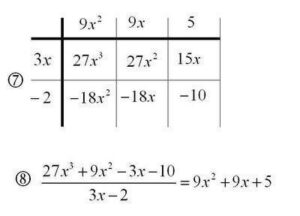
This method is actually easier than it seems at first, and when all steps are carried out on the same grid, is quite compact.
Here is another example for you to try it out on.
In these two examples, the division worked well – there was no remainder. In the case where we are dividing f/g and g is not a factor of f, and the degree of g is less than the degree of f, there is polynomial remainder whose degree is strictly less than that of g. So, for example, when g is a linear function (degree 1), f/g can have a constant remainder (degree 0).
In this case we proceed as above, attempting to fill in the grid with the numerator (dividend). However, if when we are done the grid does not match the numerator, we have a remainder. The remainder is the additional amount that we have to add to the grid in order to arrive at the numerator.
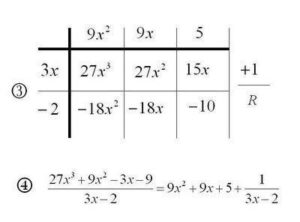
Consider a division question almost identical to the first one that we looked at, except here we change the numerator slightly so that it doesn’t factor well.
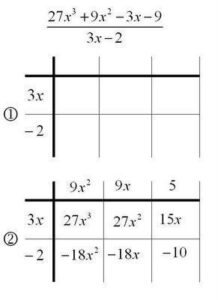
Following the same steps as before, we end up with a grid sum that does not match our desired answer: we have -10 instead of -9 for the final constant term. This tells us that we have a remainder of +1, that we choose to write next to the grid. In our final answer, the remainder tells us the “remaining fractional part” that we have to add at the end.
For more such insights, log into www.international-maths-challenge.com.
*Credit for article given to dan.mackinnon*
![]()
![]()
![]()
![]()
