Is there a typical rate of cultural evolution?

Are cultural evolution rates similar across human societies? The emerging field of Cliodynamics uses mathematical models to study history.

Tobias Wand and colleagues used a data-driven approach to estimate the rates of cultural evolution in 23 geographic areas, using data from Seshat: Global History Databank, which records nine “complexity characteristics” for 370 polities over 10,000 years, ending in the nineteenth century. The work is published in the journal PNAS Nexus.

The complexity characteristics are polity population; extent of polity territory; the size of the largest urban center; hierarchical complexity; the presence of professional soldiers, officers, priests, bureaucrats, and judges; the variety of observable structures; characteristics of writing and recordkeeping; variety of types of texts; and monetary system.

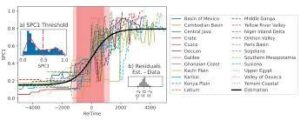
The authors focused on 23 Natural Geographic Areas (NGAs) and restricted their analysis to the central part of each NGA’s timeline so that they could focus on periods of steady, uninterrupted growth rather than moments of invasion or civilization-ending crisis. A universal logistic growth model was fitted to a variable combining all nine complexity characteristics.

On average, it takes societies that develop in isolation about 2,500 years to reach high levels of social complexity, according to the authors. Full development of complexity was spread out over multiple cultural or institutional phases in every NGA.

According to the authors, the data suggest that there are common pathways in human social evolution across cultures.

For more such insights, log into our website https://international-maths-challenge.com

Credit of the article given to PNAS Nexus


Factor Lattices

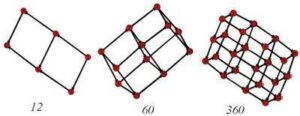
The objects pictured above are interesting structures – they are derived from the prime factorization of a given number n. They can be described in a number of ways – for example, as directed graphs. Because they are nicely structured, they actually form something more special – a lattice. Accordingly, these structures are called factor lattices.
It’s easy to start drawing these by hand following the instructions below.

1. The first node is 1
2. Draw arrows out of this node for each of the prime factors of n.
3. The arrows that you just drew should connect to nodes labled with the prime factors of n.

Now, for each of the new nodes that you drew do the following:

4. Start from a node x that is not equal to n.
5. Draw arrows out of this node for each of the prime factors of n/x.
6. The arrows that you just drew (one for each p = n/x) should connect to nodes labled with the numbers p*x.

7. Now repeat 4,5, and 6 for each new node that you have drawn that is not equal to n.

This process is recursive, and ends when you have the complete lattice. The process is well suited for implementation as a computer program – the images above were created using SAGE using output from a Java program based on the algorithm above.

Manually trying out the steps out for a number like n = 24 goes something like this: First write out the prime factorization of 24, 24=(2*2*2)*3 = (2^3)*3. Starting with 1, draw arrows out to 2 and 3. Now looking at each node and following the algorithm, from the 2 you will get arrows out to 4 and 6. From the 3 you will get an arrow out to 6 as well. From 4 you will get arrows out to 8 or 12. From 6 you will get an arrow out to 12 as well. From 8 and from 12 you get arrows out to 24, and you are done.

In general, the algorithm produces a lattice that can be described as follows. Each node is a factor of the given number n. Two nodes are connected by an edge if their prime factorization differs by a single prime number. In other words, if a and b are nodes, and p = b/a, then there is an arrow p:a–>b.

It’s a good exercise to make the connections between the lattice structure and the prime factorization of a number n.

1. What does the factor lattice of a prime number look like?
2. If a number is just a power of a prime, what does its lattice look like?
3. If you know the factorization, can you find the number of nodes without drawing the lattice.

The answer to the last question (3) can be expressed as:

For example, if n = 24= 2^3*3, then the number of nodes will be (3+1)(1+1) = 8

That these structures can be thought of as “lattices”comes from the fact that you can think of the arrows as an ordering of the nodes, ab. The number 1 is always the least node in the factor lattice for n, while n itself is the greatest node. The property that actually makes these structures a “lattice” is that for any two nodes there is always a lower-bound for any pair of nodes in the lattice, and always an upper-bound for the pair (these are often referred to as meets and joins).

The Wolfram Demonstrations Project has a nice factor lattice demo that will draw factor lattices for a large number of integers for you. There is also a good Wikipedia entry for lattices in general.

For more such insights, log into www.international-maths-challenge.com.

*Credit for article given to dan.mackinnon*