Understanding how children learn to count can have profound impacts on the kinds of instructional materials used in the classroom. And the way those materials are designed can shape the strategies children use to learn, according to a new paper led by Concordia researchers.
Writing in the journal School Science and Mathematics, the authors study how young children, mostly in the first grade, used a hundreds table to perform age-appropriate counting tasks. Hundreds tables, as the name suggests, are charts divided into rows and columns of 10, with each square containing a number from one to 100. The researchers discovered that the children who counted left-to-right, top-to-bottom outperformed children who counted left-to-right, bottom-to-top.
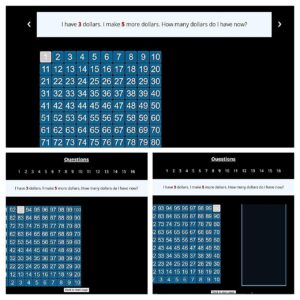
In this study, children used the tables on a screen to solve addition problems. One group of children used a top-down table, where the top left corner was marked 1 and bottom left corner was marked 100. Another group of children used a bottom-up, where one occupied the bottom left and 100 the top right. A third group of children used a bottom-up table with a visual cue of a cylinder next to it. The cylinder was designed to show the “up-is-more” relation as it filled with water when the numbers increased when moving up in the table.
“We found that children using the top-down chart used a more sophisticated strategy of counting by 10 and moving vertically, rather than using the more simplistic strategy of counting by one and moving horizontally,” says Vera Wagner. She co-authored the paper with Helena Osana, a professor in the Department of Education in the Faculty of Arts and Science and Jairo Navarrete-Ulloa of O’Higgins University in Chile.
The authors believe the benefits of the top-down table could be related to the way children learn to read and that they are applying the same approach to base-ten concepts.
“We were working with young children, so reading instruction is likely at the forefront of their attention,” says Wagner, who now teaches elementary students at a Montreal-area school. “The structure of moving in that particular way might be more ingrained.”
The power of spatial configuration
Osana notes that the practice of counting by 10s rather than by ones—which is a more efficient method of arriving at the same answer—is an example of unitizing, in which multiples of one unit form a new unit representing a larger number.
“From a theoretical perspective, the study shows that the spatial configuration of instructional materials can actually support this more sophisticated understanding of numbers and the unitizing aspect that goes along with it,” she says.
While the researchers are not suggesting children will automatically gravitate toward the top-down chart under every circumstance, they do think the study’s results provide educators with a sense of the ways their students process numbers and addition.
“It is important for teachers to be aware of how children are thinking about the tools we are giving them,” says Osana, principal investigator of the Mathematics Teaching and Learning Lab. “We are not saying that teachers have to use the top-down hundreds chart every time, but they should think about the strategies their students are using and why they use them with one particular instructional tool and not another.”
For more such insights, log into our website https://international-maths-challenge.com
Credit of the article given to Patrick Lejtenyi, Concordia University


