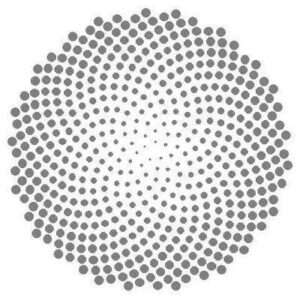
If you have already created the phyllotaxis data in Fathom, or opened the data created in TinkerPlots in Fathom, you can change the display you get when you drag open a collection box. Under the display tab on the Collection Inspector in Fathom you can set the display properties so that cases no longer show up as uniform gold balls. Setting the display attributes to the values below should give you a growing spiral like the one pictured above.
x = 10x+400
y = 10y+400
image = greyCircleIcon
width = sqrt(r*10)
height = sqrt(r*10)
caption=””
Note that the x and y on the right-hand side of the equations above are the x and y attributes that you defined for the data, and the x and y on the left-hand correspond to the position of the icons. You can experiment with other formulas for width and height—using a slider to provide a variable instead of the number “10” gives more flexibility.
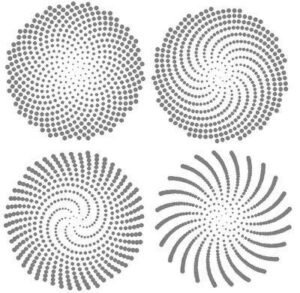
The images below show some of the other spirals you can obtain by varying the angle between the seeds, as mentioned in the previous post.

For more such insights, log into www.international-maths-challenge.com.
*Credit for article given to dan.mackinnon*

