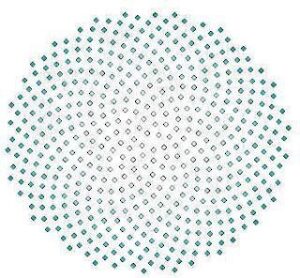
Phyllotaxis is a term used for the patterns that emerge in the growth of plants. Spiral phyllotaxis is observed in the heads of sunflowers, in pine-cones and pineapples, and in a variety of other plants.
Phyllotaxis is a popular topic in mathematics recreation – it’s interesting in its own right and also related to other perennial favourites, Fibonacci numbers and the golden ratio.
The article Modeling Spiral Growth in a GSP Environment describes how to model phyllotaxis-like patterns in GSP. Although GSP works reasonably well, TinkerPlots or Fathom environments seem to be better suited to capturing this particular model – they make the formulas more explicit and easy to manipulate, and they allow for the data generated to be viewed in a variety of ways. The images above were created by porting this model to TinkerPlots.
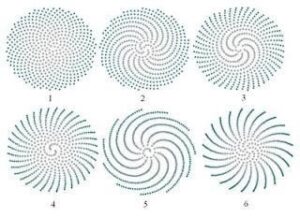
As the article suggests, experimenting with the the angle between successive seeds allows you to see different resulting patterns – angles that are multiples of rational numbers create patterns of rays while irrational numbers (actually approximate values) give spirals, or spiral/ray combinations (the rays form as the approximation gets more “rational”). A good choice for approximating actual phyllotaxis patterns is to use tau = (1+sqrt(5))/2 in your angle. Here is a listing for the attributes required to generate the pattern in TP or Fathom. The graph/plot is simply the x attribute on the horizontal and the y attribute on the vertical (in TP these need to be fully separated).
n = caseIndex
base_angle = pi*(1+sqrt(5))
r = sqrt(n)
theta = n*base_angle
x = r*cos(theta)
y = r*sin(theta)
The images shown in this post use a collection of 500 cases or “seeds”. The base angle is 2pi*tau, and the actual angle for a given seed is a multiple of this base angle.
The model is nice looking and easy to build, but it models only the end result of the growth process, not the process itself. It winds new seeds around the outer edge based on a pre-determined angle. A better model would be one that mirrors what is understood to be the underlying phonomena – new seeds are added to the center and old seeds are pushed out following a set of rules. Under this dynamic method, the angles and spirals are an emergent aspect of the system, rather than the explicit result. This website describes how such a dynamical system could be modeled.
Although the Fathom/TP model does not model the dynamical system that underlies phyllotaxis, it’s fun to play with in its own right. You can manually alter the base_angle attribute as suggested by the GSP article. If you add a parameter (a slider) to help you vary the angle, you can obtain a whole family of spiral/ray patterns whose properties you could take a closer look at. Different combinations of angles and sliders will give you various levels of control over the image.
For example, change the formula for base_angle to base_angle = pi*(1+sqrt(5))*base, and create a slider “base”. The image below shows the spirals obtained for base = 1…6.

Update: Here is an example of how to draw spirals like this in R.
For more such insights, log into www.international-maths-challenge.com.
*Credit for article given to dan.mackinnon*

