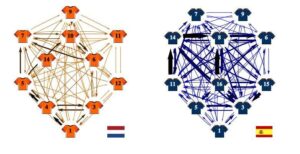
Passing networks for the Netherlands and Spain drawn before the final game, using the passing data and tactical formations of the semi-finals. Image from arXiv:1206.6904v1
For years, sports fanatics have turned to statistics to help them gauge the relative strength or weaknesses of different teams, though some have been more amenable to the process than others. Baseball and football, for example, seem to have a statistic for every action that occurs on the field of play, with different players ranked and rated by their numbers. International football, aka soccer on the other hand has generally defied such attempts due to their being far fewer things to measure with the sport and the continuity of play. That may change however, as mathematicians Javier López Peña and Hugo Touchette of University College and Queen Mary University respectively, have applied network theory to the unique style of play of the European Championship 2012 victor, Spain. And as they describe in the paper they’ve uploaded to the preprint server arXiv, the graphic that results gives some clues as to why the team is considered one of the best of all time.
Anyone who has watched the Spanish team knows that their style of play is different from other teams. So much so it’s been given a name by fans: tiki-taka. It’s all about quick passes and exquisite teamwork. But trying to describe what the team does only leads to superlatives, which don’t really get to the heart of the matter. To help, Peña and Touchette turned to network theory, which makes sense, because soccer is played as a network of teammates working efficiently together.
Unfortunately, on paper, network theory tends to wind up looking like a bunch of hard to decipher equations, which wouldn’t help anyone except those that create them. To make it so that anyone could understand what their theories have turned up, the two used a simple drawing depicting players as nodes and their relationship to one another on the team, the amount of passing that is done between them, the way it is done and to whom, as lines between the nodes.
What shows up in the drawing first, is what everyone already knows, namely, that the team passes the ball among its players a lot. More than a lot actually. In one match during 2010’s World Cup between Spain and the Netherlands, the Spanish players out-passed their opponent 417 to 266. The drawing also highlights the fact that two players on the team are “well connected” i.e. easy for others to get to, versus just one for the opponent.
The graphic also shows what is known as “betweenness centrality,” which is a way of measuring the amount a network relies on a single node to operate at its optimum capacity. With soccer, it measures how much a team relies on an individual player. In this instance, the opponent appears far more vulnerable to disruption if that individual is covered adequately than happens with the Spanish team. Also implemented in the graphic is the notion of PageRank, developed by Google, which ranks the most popular pages by linkages. Applied to soccer it would mean the player who is passed the ball most often by teammates. With Spain, of course, it was central midfielder, Xavi.
In many ways the graphic confirms what most suspect, that Spain wins more because it relies more on precise teamwork rather than the special skills of one or two superstars. In other ways though, it shows that even soccer can be made to offer up statistics if someone looks hard enough.
For more such insights, log into our website https://international-maths-challenge.com
Credit of the article given to Bob Yirka , Phys.org

